. 2018 Oct;8(10):1286-1299.
doi: 10.1158/2159-8290.CD-18-0432. Epub 2018 Aug 13.

A Digital RNA Signature of Circulating Tumor Cells Predicting Early Therapeutic Response in Localized and Metastatic Breast Cancer

Affiliations

A Digital RNA Signature of Circulating Tumor Cells Predicting Early Therapeutic Response in Localized and Metastatic Breast Cancer

Tanya T Kwan et al. Cancer Discov. 2018 Oct.

Abstract

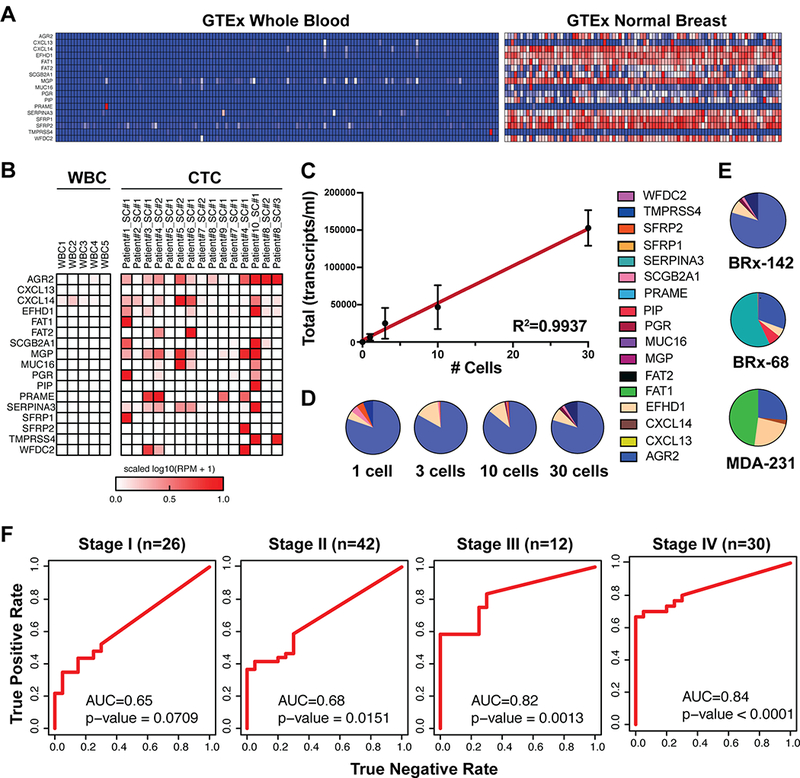
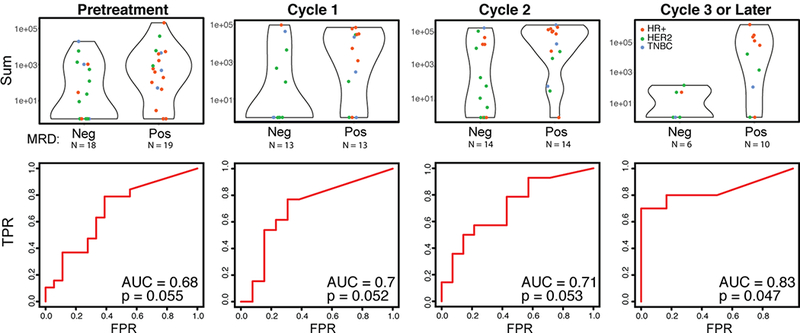
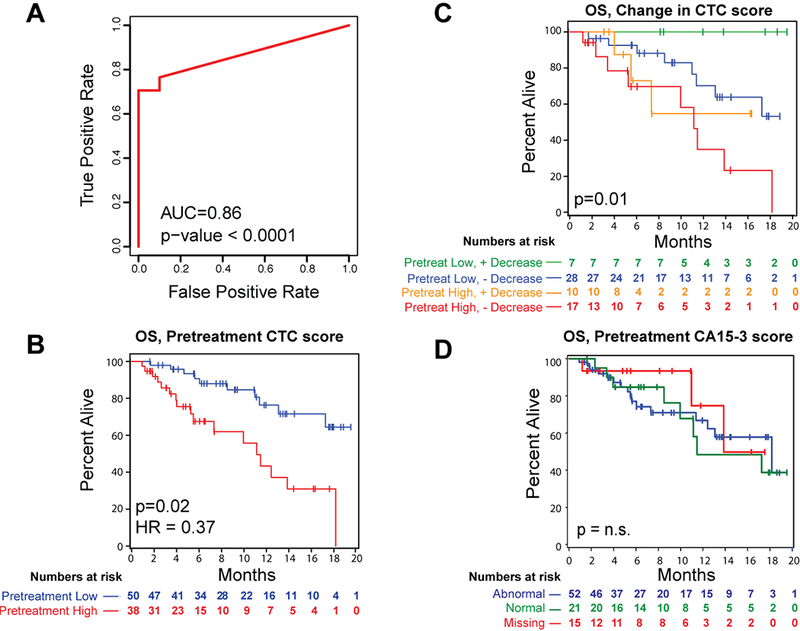
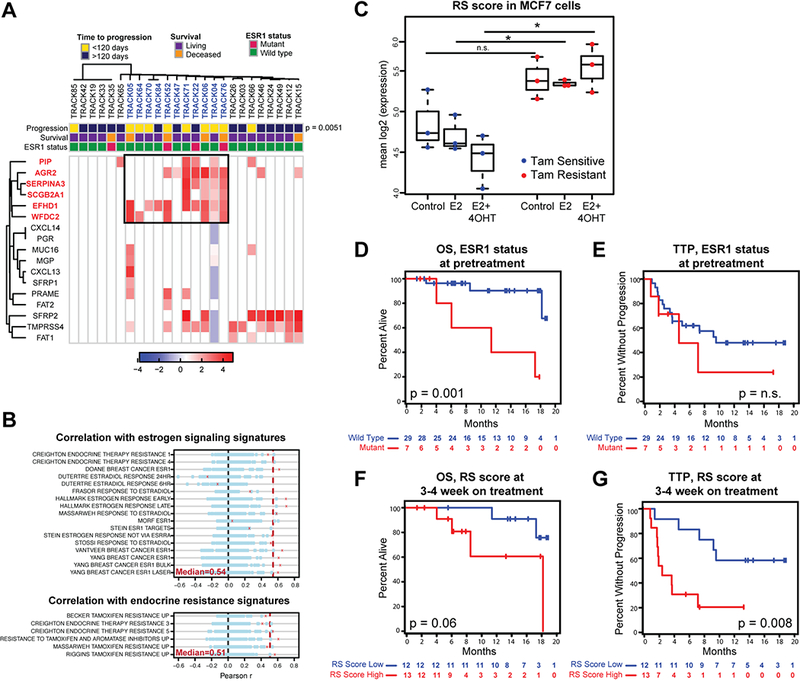
The multiplicity of new therapies for breast cancer presents a challenge for treatment selection. We describe a 17-gene digital signature of breast circulating tumor cell (CTC)-derived transcripts enriched from blood, enabling high-sensitivity early monitoring of response. In a prospective cohort of localized breast cancer, an elevated CTC score after three cycles of neoadjuvant therapy is associated with residual disease at surgery (P = 0.047). In a second prospective cohort with metastatic breast cancer, baseline CTC score correlates with overall survival (P = 0.02), as does persistent CTC signal after 4 weeks of treatment (P = 0.01). In the subset with estrogen receptor (ER)-positive disease, failure to suppress ER signaling within CTCs after 3 weeks of endocrine therapy predicts early progression (P = 0.008). Drug-refractory ER signaling within CTCs overlaps partially with presence of ESR1 mutations, pointing to diverse mechanisms of acquired endocrine drug resistance. Thus, CTC-derived digital RNA signatures enable noninvasive pharmacodynamic measurements to inform therapy in breast cancer.Significance: Digital analysis of RNA from CTCs interrogates treatment responses of both localized and metastatic breast cancer. Quantifying CTC-derived ER signaling during treatment identifies patients failing to respond to ER suppression despite having functional ESR1. Thus, noninvasive scoring of CTC-RNA signatures may help guide therapeutic choices in localized and advanced breast cancer. Cancer Discov; 8(10); 1286-99. ©2018 AACR. This article is highlighted in the In This Issue feature, p. 1195.


Conflict of interest statement

Conflict of Interest Statement: MGH has filed for patent protection for the CTC-iChip technology and molecular signatures

Figures

Figure 1.
Figure 1.
Development and validation of the breast cancer CTC-droplet digital (dd)PCR assay. A, Expression of the 17 selected breast CTC markers in whole blood versus normal breast tissue (GTeX database). B, Single-cell RNAseq-derived expression of the 17 breast CTC markers in 5 white blood cells and in 15 individually sequenced primary CTCs from women with metastatic breast cancer. C, CTC signal (total transcripts/ml of blood) from 0, 1, 3, 10 and 30 BRx-142 cells introduced into 4 ml healthy donor (HD) blood, followed by microfluidic CTC-enrichment and dd-PCR analysis (n=2, dots represent means, error bars represent SD, best fit line and R-squared statistics of the linear regression model are shown). D, Contribution of individual breast CTC markers to the signal detected from different numbers of BRx-142 cells introduced into blood. E, Contribution of individual markers to the signal detected from 30 cells each from three different cell lines (BRx-142, BRx-68 and MDA-231) introduced into blood. In all cases, cells were added to 4 ml of whole blood from HD and processed through the CTC-iChip for enrichment prior to ddPCR analysis. F, Receiver-operator characteristic (ROC) analysis of total CTC signal in healthy donors (n=20) and Stage I (N=26), Stage II (N=42), Stage III (N=12) and Stage IV (n=30) patient samples. AUC values are shown; p-values are based on Wilcoxon rank sum test.
Figure 2.
Figure 2.
Elevated CTC-Score during presurgical neoadjuvant therapy predicts the probability of residual disease in patients with localized breast cancer at the time of surgical resection. The BL-NEO blood draws were stratified by both treatment cycle (including chemotherapy, endocrine therapy and/or anti-HER2-targeted therapy) and presence of significant residual disease upon surgery, and their CTC scores compared. Breast cancer subtypes are noted (HR+, red; HER2, green; TNBC, blue). High CTC scores in pretreatment and cycles 1 and 2 samples reveal a trend towards presence of significant residual disease, while blood draws from ≥3 cycles of therapy predict significant residual disease. ROC curves, AUC values and p-values for each of the conditions are shown. P-values were computed by comparing the performance of the CTC score to a random predictor.
Figure 3.
Figure 3.
Pretreatment CTC-Score predicts overall survival in women with metastatic breast cancer receiving a new line of treatment. A, ROC analysis of total CTC signal in pretreatment samples from Stage IV patients (n= 87) from the TRACK cohort versus matched negative control (women with negative biopsies despite previously positive mammogram findings; n=10). AUC values are shown; p-values are based on Wilcoxon rank-sum test. B, Kaplan-Meier plot depicting overall survival (OS) in TRACK patients, based on pre-treatment CTC-Score. Patients were divided into two groups at a cut-off of 3000 transcripts/ml (see Methods). Patients with a high pretreatment CTC-Score (red) have a longer OS compared with those with a lower pretreatment CTC-Score (blue). Hazard ratio (HR) and p-value based on multivariable Cox proportional hazards model are shown. C, Kaplan-Meier plot depicting overall survival in TRACK patients, based on the change in CTC score between pre-treatment baseline versus 3–4 weeks on-treatment time point. Groups are defined based on low signal at pretreatment (<= 3000 transcripts/ml) with >90% reduction in signal on-treatment (green), low signal at pretreatment (<= 3000 transcripts/ml) without >90% reduction in signal on-treatment (blue), high signal at pre-treatment (>3000) with >90% reduction in signal at 3–4 weeks (orange) or high signal at pre-treatment (>3000) without >90% reduction in signal at 3–4 weeks on-treatment (red). P-value was calculated using the log-rank test. D, Kaplan-Meier plot depicting overall survival in TRACK patients, based CA15–3 levels at pretreatment. Groups are defined as abnormal CA15–3 levels (>30, blue), normal CA15–3 levels (<30, green), and missing CA15–3 levels (NA, red). P-value based on log-rank test.
Figure 4.
Figure 4.
Markers associated with persistent ER signaling (RS signature) identify HR+ patients at high risk of progression on endocrine treatment. A, Unsupervised clustering of breast CTC marker expression in HR+ patients receiving endocrine therapy for 3–4 weeks. A set of markers (boxed) identifies a group of patients (colored blue) significantly enriched for progression within 120 days. P=0.0051 was calculated using Fisher’s exact test. ESR1 mutation status for each patient is shown. B, Correlations between a metascore based on the expression of the 6 high risk RS genes and GSEA signatures associated with estrogen signaling (top) and endocrine resistance (bottom) across multiple publicly available datasets are shown in red crosses. Dotted red line represents the median correlation across the multiple comparisons. Correlations with metascores based on 100 random sets of 6 genes are shown in blue circles. C, RS expression based on bulk RNAseq in tamoxifen sensitive or resistant MCF7 cells, left untreated or treated with estrogen (E2) alone or together with tamoxifen (4-OTH). Asterisks show significance of p<0.05, p-values based on two-sided t-test. D, Kaplan-Meier plots depicting OS in HR+ patients receiving endocrine therapy based on the presence of ESR1 mutations at pretreatment. Cases with ESR1 mutations (red) are compared with those with wild-type ESR1 (blue). P-values were calculated using log rank test. E, Kaplan-Meier plots depicting TTP in HR+ patients receiving endocrine therapy based on the presence of ESR1 mutations at pretreatment. Cases with ESR1 mutations (red) are compared with those with wild-type ESR1 (blue). P-values were calculated using log rank test.F, Kaplan-Meier plots of OS of HR+ patients receiving endocrine therapy based on 3–4 weeks on-treatment RS score. Groups were divided at 25 transcripts/ml. Patients with high RS CTC-Score (red) are compared with those having a low RS CTC-Score (blue). P-values were calculated using log rank test. G, Kaplan-Meier plots of OS of HR+ patients receiving endocrine therapy based on 3–4 weeks on-treatment RS score. Groups were divided at 25 transcripts/ml. Patients with high RS CTC-Score (red) are compared with those having a low RS CTC-Score(blue). P-values were calculated using log rank test.

References

    1. O’leary B, Finn RS, Turner NC. Treating cancer with selective CDK4/6 inhibitors. Nature Reviews Clinical Oncology. 2016;13: 417–430. - PubMed
    1. Hortobagyi GN, Stemmer SM, Burris HA, et al. Ribociclib as first-line therapy for HR-positive, advanced breast cancer. New England Journal of Medicine. 2016;375: 1738–1748. - PubMed
    1. Turner NC, Ro J, André F, et al. Palbociclib in hormone-receptor–positive advanced breast cancer. New England Journal of Medicine. 2015;373: 209–219. - PubMed
    1. Hart CD, Migliaccio I, Malorni L, Guarducci C, Biganzoli L, Di Leo A. Challenges in the management of advanced, ER-positive, HER2-negative breast cancer. Nature Reviews Clinical Oncology. 2015;12: 541–552. - PubMed
    1. Poznak CV, Somerfield MR, Bast RC, et al. Use of Biomarkers to Guide Decisions on Systemic Therapy for Women With Metastatic Breast Cancer: American Society of Clinical Oncology Clinical Practice Guideline. Journal of Clinical Oncology. 2015;33: 2695–2704. - PMC - PubMed

Publication types