. 2018 Sep 19;38(38):8277-8294.
doi: 10.1523/JNEUROSCI.0511-18.2018. Epub 2018 Aug 13.

α-Neurexins Together with α2δ-1 Auxiliary Subunits Regulate Ca2+ Influx through Cav2.1 Channels

Affiliations

α-Neurexins Together with α2δ-1 Auxiliary Subunits Regulate Ca2+ Influx through Cav2.1 Channels

Johannes Brockhaus et al. J Neurosci. .

Abstract

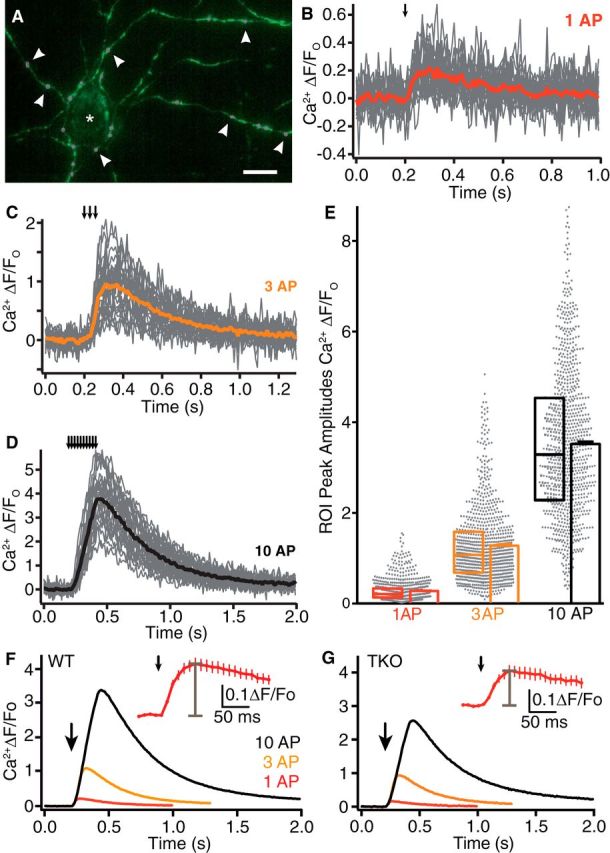
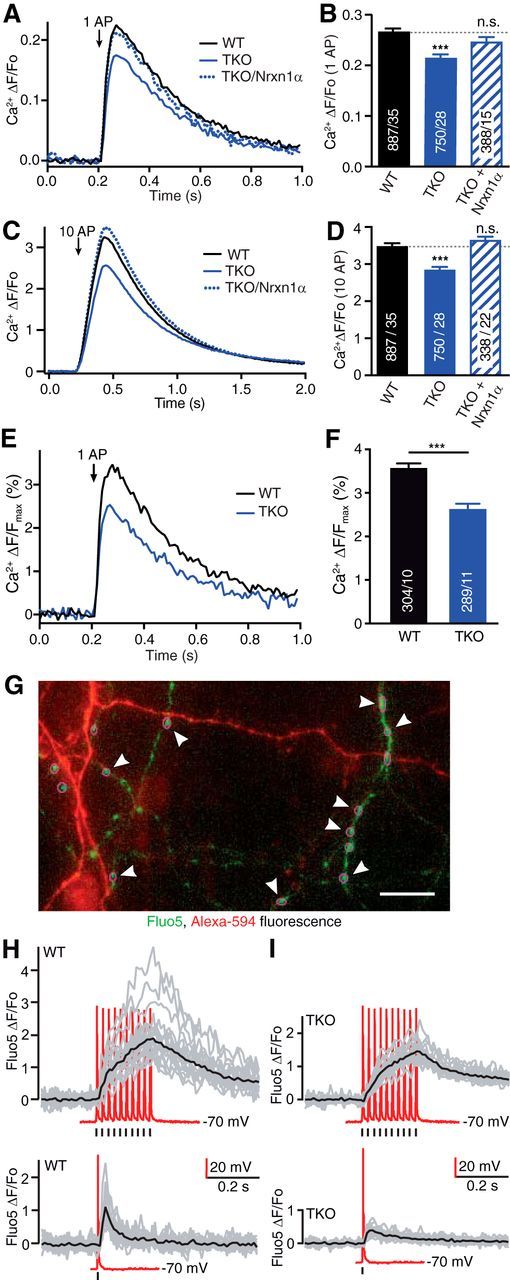
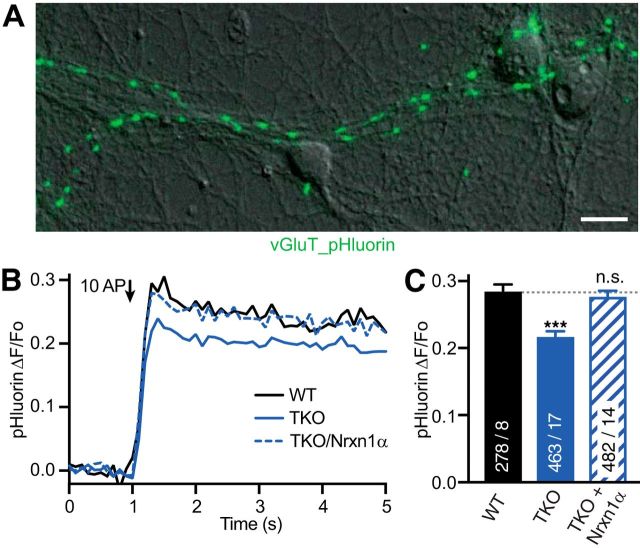
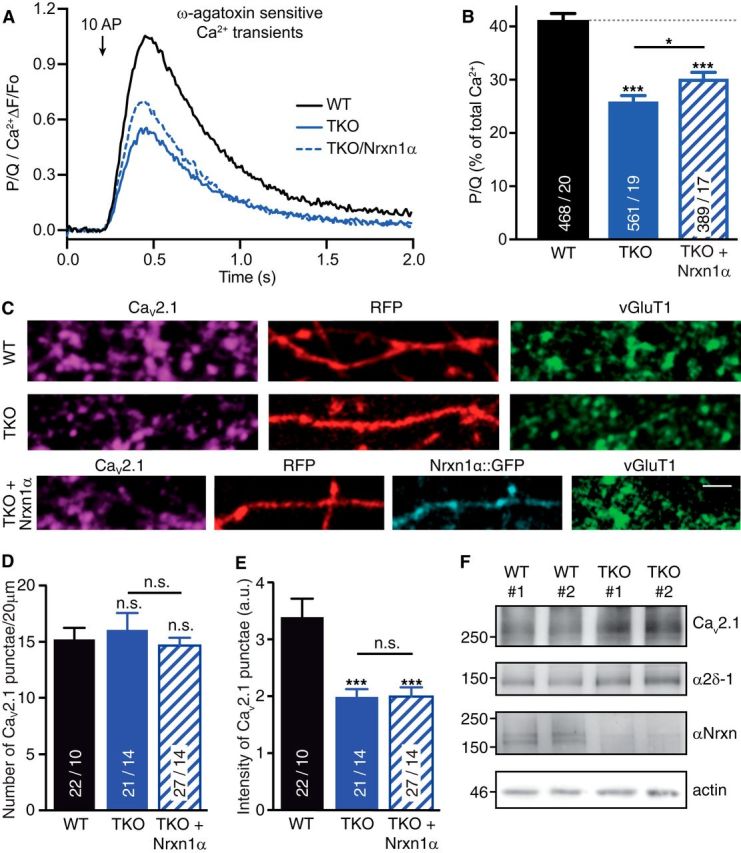
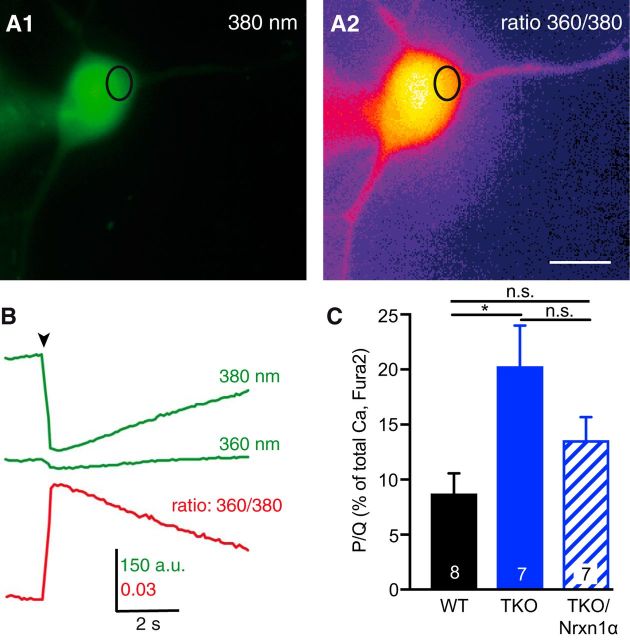
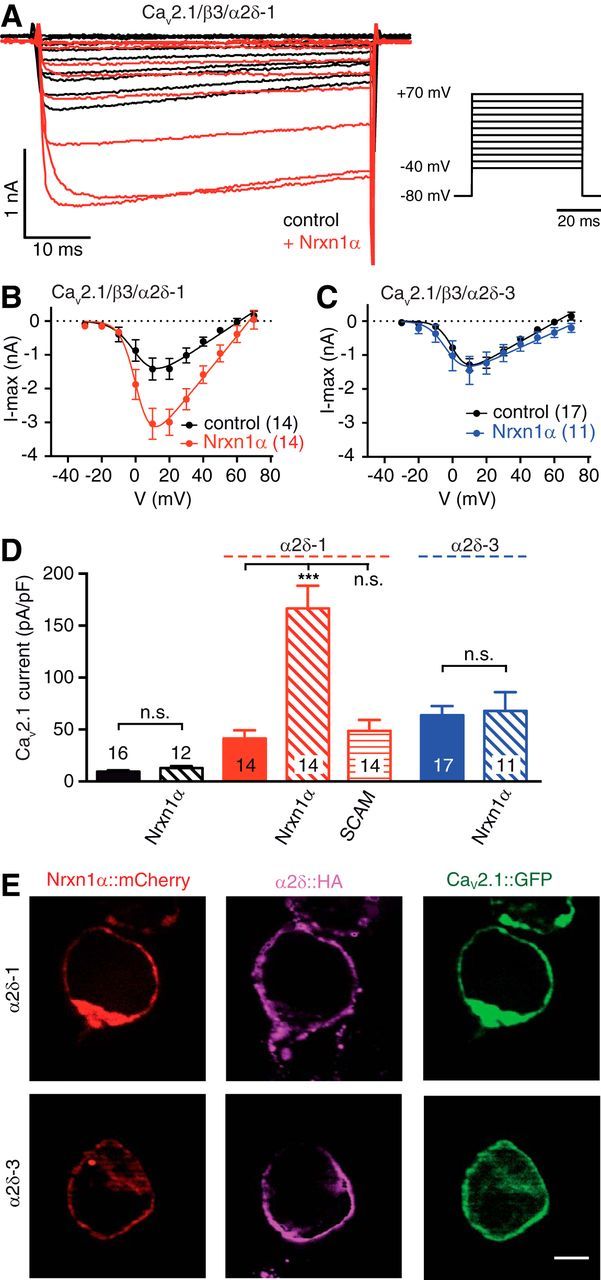
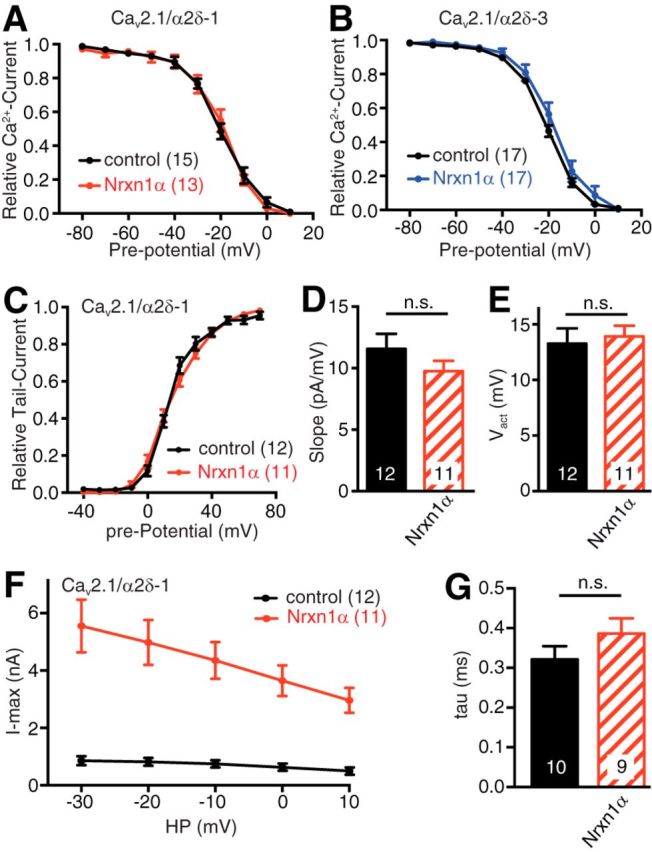
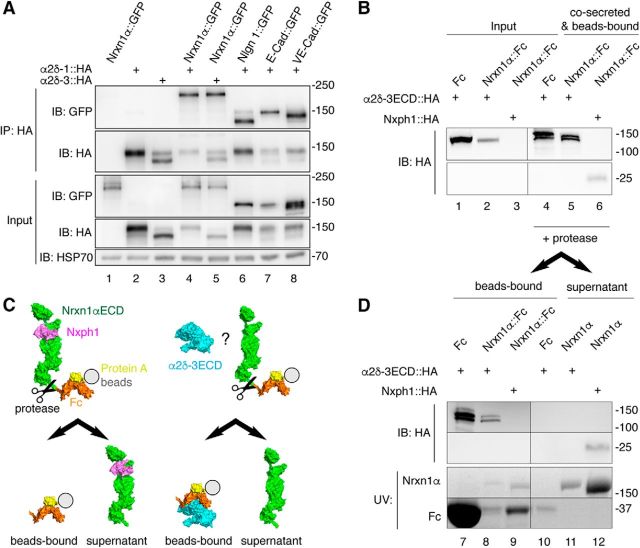
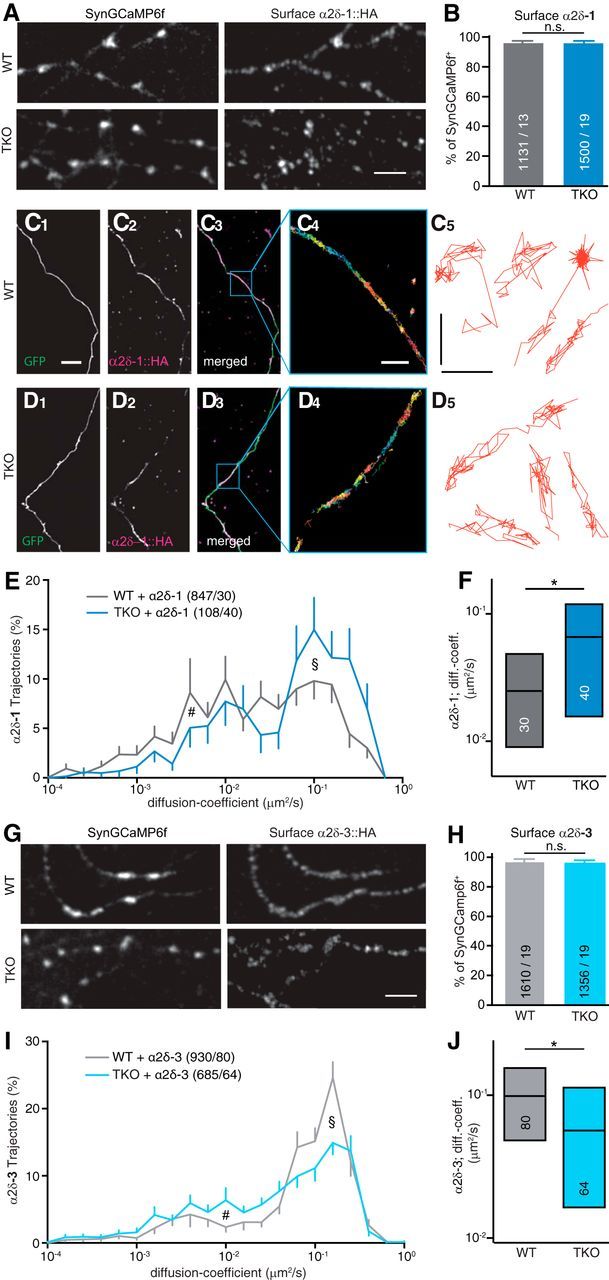
Action potential-evoked neurotransmitter release is impaired in knock-out neurons lacking synaptic cell-adhesion molecules α-neurexins (αNrxns), the extracellularly longer variants of the three vertebrate Nrxn genes. Ca2+ influx through presynaptic high-voltage gated calcium channels like the ubiquitous P/Q-type (CaV2.1) triggers release of fusion-ready vesicles at many boutons. α2δ Auxiliary subunits regulate trafficking and kinetic properties of CaV2.1 pore-forming subunits but it has remained unclear if this involves αNrxns. Using live cell imaging with Ca2+ indicators, we report here that the total presynaptic Ca2+ influx in primary hippocampal neurons of αNrxn triple knock-out mice of both sexes is reduced and involved lower CaV2.1-mediated transients. This defect is accompanied by lower vesicle release, reduced synaptic abundance of CaV2.1 pore-forming subunits, and elevated surface mobility of α2δ-1 on axons. Overexpression of Nrxn1α in αNrxn triple knock-out neurons is sufficient to restore normal presynaptic Ca2+ influx and synaptic vesicle release. Moreover, coexpression of Nrxn1α together with α2δ-1 subunits facilitates Ca2+ influx further but causes little augmentation together with a different subunit, α2δ-3, suggesting remarkable specificity. Expression of defined recombinant CaV2.1 channels in heterologous cells validates and extends the findings from neurons. Whole-cell patch-clamp recordings show that Nrxn1α in combination with α2δ-1, but not with α2δ-3, facilitates Ca2+ currents of recombinant CaV2.1 without altering channel kinetics. These results suggest that presynaptic Nrxn1α acts as a positive regulator of Ca2+ influx through CaV2.1 channels containing α2δ-1 subunits. We propose that this regulation represents an important way for neurons to adjust synaptic strength.SIGNIFICANCE STATEMENT Synaptic transmission between neurons depends on the fusion of neurotransmitter-filled vesicles with the presynaptic membrane, which subsequently activates postsynaptic receptors. Influx of calcium ions into the presynaptic terminal is the key step to trigger vesicle release and involves different subtypes of voltage-gated calcium channels. We study the regulation of calcium channels by neurexins, a family of synaptic cell-adhesion molecules that are essential for many synapse properties. Using optical measurements of calcium influx in cultured neurons and electrophysiological recordings of calcium currents from recombinant channels, we show that a major neurexin variant facilitates calcium influx through P/Q-type channels by interacting with their α2δ-1 auxiliary subunits. These results propose a novel way how neurons can modulate the strength of distinct synapses.

Keywords: calcium channels; cell adhesion molecules; live cell imaging; neurexins; patch-clamp electrophysiology; synaptic transmission.


Figures

Figure 1.
Figure 1.
Monitoring presynaptic Ca2+ influx with synGCaMP6f. A, Axonal branches and putative presynaptic boutons in a hippocampal culture transfected with synGCaMP6f (green) during a stimulation with 10 AP. ROIs were drawn around synaptic boutons (circles, magenta, some are indicated by arrowheads) for evaluation of presynaptic Ca2+ transients. Asterisk, nontransfected neuron. Scale bar, 20 μm. B, Exemplary experiment of fluorescence changes to stimulation by a single action potential (1 AP; arrow indicates stimulation) in a recording from WT neurons transfected with synGCaMP6f; recordings of individual ROIs (gray lines), and averaged response (red line). C, Exemplary fluorescence changes as in B to stimulation by a train of 3 AP (averaged response, orange). D, Exemplary fluorescence changes as in B to stimulation by a train of 10 AP (averaged response, black). E, Maxima of all ROIs from WT neurons corresponding to single synaptic boutons (n = 887 from 35 independent experiments; scatter diagram, gray dots). Overlaid box plots represent median and 25–75% percentiles; bar diagrams show average of ROI maxima (mean ± SEM), colors as in BD). Note that the mean of ROI maxima is not identical to the maximum of averaged traces due to noise of individual ROI traces and different time points of maxima. F, Traces of Ca2+ fluorescence changes determined by transfected synGCaMP6f from WT neurons averaged across 887 boutons (35 experiments) in response to 1 (red), 3 (yellow), and 10 (black) APs (arrow: start of stimulation train). Inset, The initial response to single AP on an enlarged time scale, gray bar indicates peak amplitude. The recording frequency (100 Hz) is adequate for determination of the peak of the synGCaMP6f fluorescence signal. G, Fluorescence changes of boutons as in F from neurons lacking αNrxns (TKO, n = 750/28).
Figure 2.
Figure 2.
α-Neurexins are required for normal presynaptic Ca2+ influx in primary hippocampal neurons. A, Comparison of averaged presynaptic Ca2+ traces (n given in corresponding bars in B) from single AP responses of WT, TKO and TKO transfected with Nrxn1α. B, Summary of mean peak synGCaMP6f signals (ΔF/Fo) of Ca2+ transients after single AP stimulation of WT boutons compared with TKO, and TKO transfected with Nrxn1α. Data are mean ± SEM n = ROIs/neurons (in bars), differences to WT are indicated (dotted line); ***p < 0.001; n.s. not significant, p = 0.221; one-way ANOVA, F(2,2040) = 14.6. C, Comparison of presynaptic Ca2+ traces as in A using 10 AP trains for stimulation. Arrow indicates start of stimulation train. D, Analysis as in B with stimulation by 10 AP trains; ***p < 0.001; n.s. not significant, p = 0.182; one-way ANOVA, F(2,2040) = 51.3. E, Traces from WT neurons and from neurons lacking all αNrxns (TKO) that were stimulated with 1 AP (arrow) and normalized offline to the maximal synGCaMP6f fluorescence, as measured by saturating internal Ca2+ after application of the Ca2+-ionophore ionomycin (10 μm) at the end of each recording. F, For each ROI, the maximum of a Ca2+ transient induced by 1 AP was compared with the maximal fluorescence seen in presence of ionomycin. Data are mean ± SEM; n = number of ROIs/neurons, shown in bars. ***p < 0.001 by unpaired t test, t(587) = 5.37. G, Fluorescence image of neurites from WT hippocampal neurons loaded with Fluo5 (green) and AlexaFluor 568 (red) in a combined patch-clamp and imaging experiment. Magenta circles (some are highlighted by arrowheads) indicate ROIs around putative presynaptic boutons. Scale bar, 20 μm. H, Fluorescence changes of Fluo5 recorded from individual WT synaptic boutons (gray lines) and their averaged response (black) to 10 AP (top) or 1 AP (bottom) stimulation. Current traces of depolarization-induced somatic APs recorded in current-clamp (red); position of 1 and 10 AP stimulations indicated by marker bars. I, Individual and averaged responses as in H but from recordings of neurons lacking all αNrxns (TKO). Representative samples from at least three independent experiments per genotype are shown.
Figure 3.
Figure 3.
Synaptic vesicle release is reduced in neurons lacking all α-neurexins. A, ΔF fluorescence image of vGlut_pHluorin (green) from a 100 AP stimulation, overlayed on DIC image of WT neurons. Scale bar, 20 μm. B, Exocytotic response of vGluT_pHluorin averaged across multiple synapses; comparison of WT, TKO, and TKO transfected with Nrxn1α (N given in corresponding bars in C). C, Summary of mean peak vGluT_pHluorin signals (ΔF/Fo) from conditions as in B. Data are mean ± SEM; n = ROIs/neurons (in bars), differences to WT are indicated. ***p < 0.001, n.s. = not significant, p = 0.454, by one-way ANOVA, F(2,1222) = 25.4.
Figure 4.
Figure 4.
Deletion of αNrxns leads to reduced CaV2.1-mediated presynaptic Ca2+ influx and channel abundance. A, Isolated ω-agatoxin IVA-sensitive traces of Ca2+ transients through CaV2.1 (P/Q-type) channels derived from subtraction of transients before and after addition of the CaV2.1 blocker. Traces are recorded by synGCaMP6f and averaged across multiple boutons of WT, TKO, and TKO neurons transfected with Nrxn1α (TKO+Nrxn1α). B, Summary histogram of CaV2.1 channel contributions (in percentage of total Ca2+ transients) of WT boutons compared with TKO, and TKO+Nrxn1α. Data are mean ± SEM; n = ROIs/neurons (in bars), differences to WT (dotted line) are indicated above columns; ***p < 0.001; *p = 0.042, by one-way ANOVA, F(2,1415) = 42.6. C, Representative images of immunofluorescence with antibodies against endogenous α1A of CaV2.1 (magenta), colabeled against vesicular glutamate transporter (vGluT1, green) in WT and TKO neurons transfected with RFP (red) alone (WT, TKO) or in combination with Nrxn1α::GFP (cyan, TKO+Nrxn1α). Scale bar, 2.5 μm. D, Quantification of the number of α1A-positive puncta that colocalize with presynaptic vGluT1 along RFP-filled axons of WT, TKO and TKO+Nrxn1α neurons. E, Quantification of immunofluorescence intensity of α1A-positive puncta colocalizing with vGluT1. Data in D and E are mean ± SEM; n = number of axonal segments (shown in bars) from at least three independent experiments. **p < 0.01; ***p < 0.001, n.s. = not significant, by one-way ANOVA. F, Immunoblots of total protein lysates from two independent WT and TKO cultures, each representing ∼300,000 hippocampal cells. Blots were probed with antibodies against the α1A pore forming and α2δ-1 auxiliary subunits of CaV2.1, and against all αNrxn variants that are deleted in TKO; actin = loading control.
Figure 5.
Figure 5.
Monitoring Ca2+ influx in the somata of neurons with Fura-2. A, Representative images of a WT neuron loaded with Fura-2 via patch pipette and excited at 380 nm before stimulation (A1). Ca2+ transient by 100 ms depolarization to +20 mV visualized by the 360/380 nm ratio (A2). The oval indicates a ROI for evaluation; Scale bar, 20 μm. B, Sample traces of fluorescence changes within the ROI marked in A at 360 and 380 nm excitation (green). The Ca2+ transient expressed as 360/380 nm ratio is shown below (red). C, Summary of mean peak amplitudes (ΔF/Fo) at 100 ms depolarization, comparing untransfected WT neurons (black bars), TKO neurons (blue) and TKO neurons transfected with Nrxn1α. Bars indicate somatic Ca2+ transients through ω-agatoxin IVA-sensitive P/Q-channels, analyzed in relation to the total Ca2+-transient before wash-in of the blocker. The part of P/Q-channels in somatic Ca2+-transients (in WT: 8.8 ± 1.8%) was increased in TKO (20.3 ± 3.6%; *p = 0.012) and showed a tendency to rescue (not significant: p = 0.191) in TKO-expressing Nrxn1α (13.6 ± 2.1%), this value is not significantly different to WT (p = 0.395). Data are mean ± SEM. n = neurons, as indicated in bars; p values by one-way ANOVA, F(2,19) = 5.17.
Figure 6.
Figure 6.
α2δ-1 auxiliary subunits together with Nrxn1α facilitate presynaptic Ca2+ influx in TKO neurons. A, Traces of Ca2+ fluorescence changes determined from TKO neurons cotransfected with Nrxn1α and α2δ-1 subunits. Ca2+ transients indicated by synGCaMP6f are averaged across multiple boutons in response to 1 (red), 3 (yellow), and 10 (black) APs (arrow: start of stimulation train). Inset, Initial response to a single AP on an enlarged time scale. B, Fluorescence changes of boutons as in A from TKO neurons expressing α2δ-3 subunits together with Nrxn1α. C, Summary of mean peak synGCaMP6f signals (ΔF/Fo) of Ca2+ transients after single AP stimulation of neurons transfected with different proteins. Data are mean ± SEM. n = ROIs/neurons (in bars), differences to WT and TKO are indicated (dotted lines); significance is given compared with WT above columns (black) and compared with TKO (blue; above dashed line). ***p < 0.001, *p < 0.05, n.s. = not significant, by one-way ANOVA with Tukey's multiple-comparisons test (F(6,4034) = 17.79); exact p values are given in gray. D, Immunofluorescent images of Ca2+ indicator synGCaMP6f, mCherry-tagged Nrxn1α and HA-tagged α2δ-1 subunits (top) or HA-tagged α2δ-3 (bottom), labeled by an antibody against the HA moiety, cotransfected into TKO neurons. Scale bars: E, F, 5 μm. E, Similar experiment to D but without expression of mCherry-tagged Nrxn1α. F, Quantification of colocalization of α2δ-1/Nrxn1α and α2δ-3/Nrxn1α with synGCaMP6f-positive puncta as in E, and of colocalization between α2δ-1 or α2δ-3 with synGCaMP6f-positive puncta as in F. Data are mean ± SEM. n = puncta/neurons (in bars); n.s. = not significant, by unpaired t test.
Figure 7.
Figure 7.
Nrxn1α in combination with α2δ-1 facilitates Ca2+ currents through recombinant CaV2.1 channels. A, Representative CaV2.1-mediated Ca2+ current traces recorded from heterologous tsA201 cells expressing α1A, β3 and α2δ-1 subunits alone (black) or together with Nrxn1α (red). Step potentials as shown (right) were used to elicit Ca2+ currents. B, I–V relationships of CaV2.1/β3/α2δ-1 alone (black) or in combination with Nrxn1α (red). C, Similar analysis as in B but using α2δ-3; trace in combination with Nrxn1α in blue. D, Summary of maximum current densities for cells expressing CaV2.1(α1A/β3) without an α2δ (black bars), with α2δ-1 (red) or with α2δ-3 (blue), and additionally with Nrxn1α or SynCAM1 (SCAM) as indicated below bars. Data are mean ± SEM. n = number of cells as indicated in bars from at least four independent experiments. ***p < 0.001, n.s. = not significant (all p > 0.99), by one-way ANOVA, F(6,91) = 20.1. E, Immunofluorescence images of transfected tsA201 cells showing Nrxn1α fused to mCherry (red, Nrxn1α::mCherry), α1A pore-forming subunit fused to EGFP (green, CaV2.1::GFP), and colabeling with antibodies against HA-tagged α2δ (magenta, α2δ::HA). β3 auxiliary subunits were coexpressed in all conditions. Scale bar, 5 μm. Res, residues.
Figure 8.
Figure 8.
Biophysical properties of recombinant CaV2.1 are not altered by Nrxn1α. A, Voltage dependence of steady-state inactivation of CaV2.1 channels tested by a pre-pulse protocol in tsA201 cells expressing α1A, β3, and α2δ-1 subunits alone (black) or together with Nrxn1α (red). B, Analysis as in A expressing α1A, β3, and α2δ-3 subunits alone (black) or together with Nrxn1α (blue). C, Tail current amplitude at −40 mV after a 10 ms voltage step to the given pre-potential, recorded in tsA201 cells expressing CaV2.1/α2δ-1 without (black) or with Nrxn1α (red). D, Slope factor of the voltage dependence of the channel activation of CaV2.1/α2δ-1 without (black) or with Nrxn1α (red); n.s. = not significant, p = 0.204, by unpaired t test, t(21) = 1.32. E, Half-activation voltage of the voltage dependence of activation of CaV2.1/α2δ-1 tail current (as given in C) without (black) or with Nrxn1α (red); n.s. = not significant, p = 0.812, by unpaired t test, t(21) = 0.24. F, I–V curves of tail currents of CaV2.1/α2δ-1 without (black) or with Nrxn1α (red). G, Analysis of tail current deactivation time constant at −20 mV of CaV2.1/α2δ-1 without (black) or with Nrxn1α (red); n.s. = not significant, p = 0.199 by unpaired t test, t(17) = 1.34. Data are mean ± SEM. N = number of cells as shown in bars or in brackets from at least four independent experiments.
Figure 9.
Figure 9.
Nrxn1α does not engage in stable complexes with α2δ subunits. A, IP of cotransfected α2δ subunits and Nrxn1α or control membrane proteins from HEK293 cell lysates (top). IPs of HA-tagged α2δ-1 and α2δ-3 enrich Nrxn1α::GFP (lanes 4, 5) similar to the controls neuroligin-1 (Nlgn1), E-cadherin (E-Cad) and VE-cadherin (VE-Cad; lanes 6–8). Single transfections served as control for antibody specificity (lanes 1–3). Endogenous HSP70 indicates equal amounts of lysates used (botto). B, Co-secretion of extracellular domains of α2δ-3 (α2δ-3ECD::HA) and Nrxn1α (Nrxn1α::Fc) into HEK293 cell medium with subsequent binding of the Fc moiety to protein A beads. Lysates of cells show α2δ-3ECD::HA (lanes 1–2). Whereas the positive control, Nxph1-HA, is hardly detectable in cell lysates (lane 3, bottom), it is enriched with Nrxn1α::Fc (lane 6, bottom). α2δ-3ECD::HA is enriched similarly with Nrxn1α::Fc (lane 5, top) but also with the Fc-tag alone. C, Diagram of the cleavage experiment using HRV 3C protease to release the Nrxn1αECD from Fc-beads (immunoblot data in D). Left, Nxph1 (magenta) is bound to Nrxn1αECD (green) as expected. Right, α2δ-3ECD (cyan) remains on Fc-coupled beads (orange) but does not interact with Nrxn1αECD. D, Immunoblot of the cleavage experiment (C) that starts from the precipitated samples in B. After addition of protease, α2δ-3ECD remains on Fc-tag bound to beads (lanes 7, 8) but is not found on Nrxn1αECD in the supernatant (lane 11). The positive control, Nxph1, is bound to the released Nrxn1αECD (lane 12). α2δ-3 and Nph1 are shown by immunoblot, Nrxn1α and Fc proteins are visualized by UV light.
Figure 10.
Figure 10.
αNrxn modulates surface mobility of α2δ-1 and α2δ-3 auxiliary subunits differentially. A, Representative immunofluorescent images of surface α2δ-1 enriched in synaptic boutons, visualized by an antibody against the HA moiety of α2δ-1::HA cotransfected with synGCaMP6f into WT neurons (top) or TKO neurons (bottom). Scale bar, 5 μm. B, Quantification of colocalization between synGCaMP6f and surface α2δ-1-positive puncta in WT and TKO. Data are mean ± SEM; n = synGCaMP6f-positive puncta/neurons from three to four independent experiments per condition; n.s. = not significant (p = 0.433) by unpaired t test. C, Labeling of the surface population of HA-tagged α2δ-1 (C1) transfected into WT neurons using an antibody specific to the HA moiety. EGFP was cotransfected to visualize neurites (C2), merged images (C3) and an overlay of all trajectories of QD-tracked single α2δ-1 molecules in a subfield as indicated (C4); sample trajectories of QD-tracked single α2δ-1 molecules (C5). Scale bars: C1D3, 10 μm; C4, D4, 2 μm; C5, D5, 0.5 μm. D, Labeling of surface α2δ-1 as in C using TKO neurons. E, Logarithmic distribution of diffusion coefficients for α2δ-1 on axons of WT and TKO neurons, showing more trajectories of higher mobility in TKO (see §) and fewer low mobility trajectories (see #); n = trajectories/cells; error bars (SEM) shown only in outward direction. F, Median and IQR (25–75%) of diffusion coefficients of α2δ-1 shown in E. Numbers of cells from four independent experiments (in bars). *p = 0.0277, by Kruskal–Wallis test with Dunn's post-test. G, Immunofluorescent images of surface α2δ-3 in synaptic boutons as in A. Scale bar, 5 μm. H, Quantification of colocalization between synGCaMP6f and surface α2δ-3-positive puncta in WT and TKO. Data are mean ± SEM. n = synGCaMP6f-positive puncta/neurons from three to four independent experiments per condition; n.s. = not significant (p = 0.4835), by unpaired t test. I, Logarithmic distribution of diffusion coefficients as in E but for α2δ-3. With α2δ-3, more trajectories of higher mobility occurred in WT (see §), indicating a reverse effect when compared with α2δ-1 (E). J, Median and IQR (25–75%) of diffusion coefficients of α2δ-3 shown in I. Numbers of cells from four independent experiments (in bars). *p = 0.0347, by Kruskal–Wallis test with Dunn's post-test.

Similar articles

Cited by

References

    1. Anderson GR, Aoto J, Tabuchi K, Földy C, Covy J, Yee AX, Wu D, Lee SJ, Chen L, Malenka RC, Südhof TC (2015) Beta-neurexins control neural circuits by regulating synaptic endocannabinoid signaling. Cell 162:593–606. 10.1016/j.cell.2015.06.056 - DOI - PMC - PubMed
    1. Aoto J, Martinelli DC, Malenka RC, Tabuchi K, Südhof TC (2013) Presynaptic neurexin-3 alternative splicing trans-synaptically controls postsynaptic AMPA receptor trafficking. Cell 154:75–88. 10.1016/j.cell.2013.05.060 - DOI - PMC - PubMed
    1. Biermann B, Sokoll S, Klueva J, Missler M, Wiegert JS, Sibarita JB, Heine M (2014) Imaging of molecular surface dynamics in brain slices using single-particle tracking. Nat Commun 5:3024. 10.1038/ncomms4024 - DOI - PMC - PubMed
    1. Born G, Grayton HM, Langhorst H, Dudanova I, Rohlmann A, Woodward BW, Collier DA, Fernandes C, Missler M (2015) Genetic targeting of NRXN2 in mice unveils role in excitatory cortical synapse function and social behaviors. Front Synaptic Neurosci 7:3. 10.3389/fnsyn.2015.00003 - DOI - PMC - PubMed
    1. Bucurenciu I, Bischofberger J, Jonas P (2010) A small number of open Ca2+ channels trigger transmitter release at a central GABAergic synapse. Nat Neurosci 13:19–21. 10.1038/nn.2461 - DOI - PubMed

Publication types

MeSH terms

Substances