. 2018 Aug 28;115(35):E8228-E8235.
doi: 10.1073/pnas.1807000115. Epub 2018 Aug 13.

Tyrosyl-tRNA synthetase stimulates thrombopoietin-independent hematopoiesis accelerating recovery from thrombocytopenia

Affiliations

Tyrosyl-tRNA synthetase stimulates thrombopoietin-independent hematopoiesis accelerating recovery from thrombocytopenia

Taisuke Kanaji et al. Proc Natl Acad Sci U S A. .

Abstract

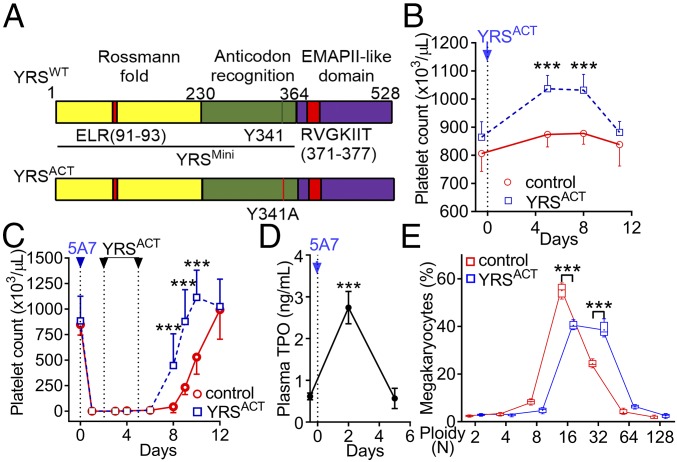
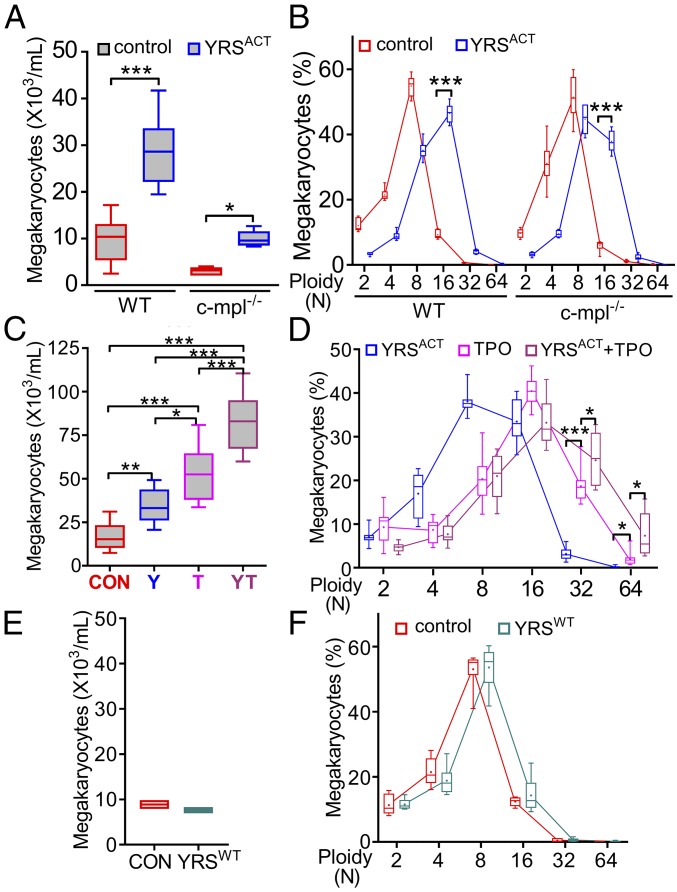
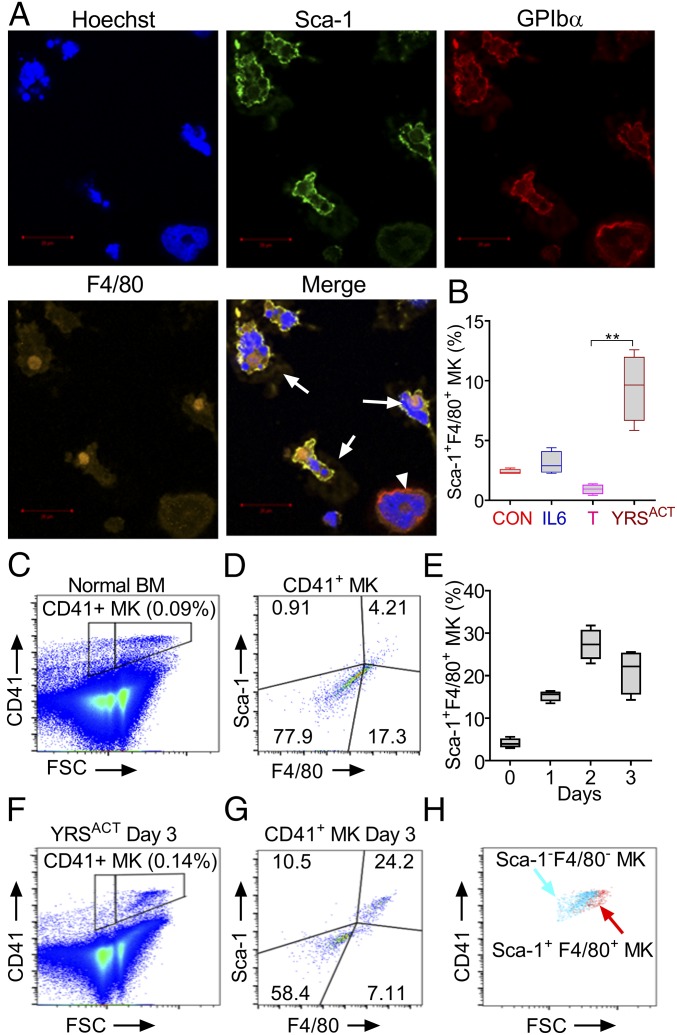
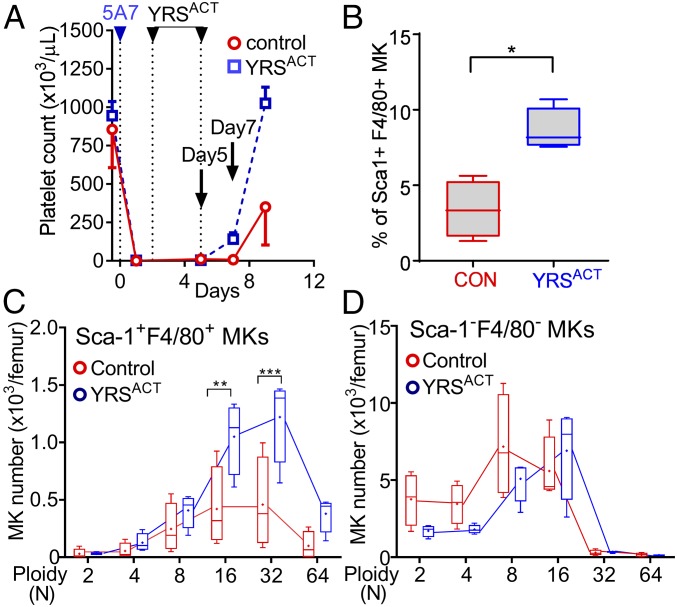
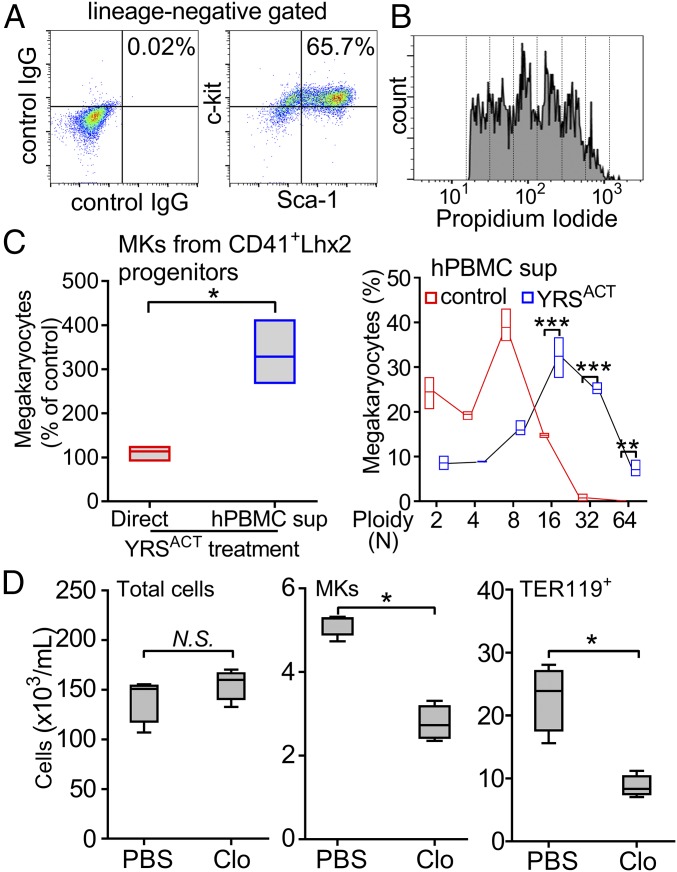
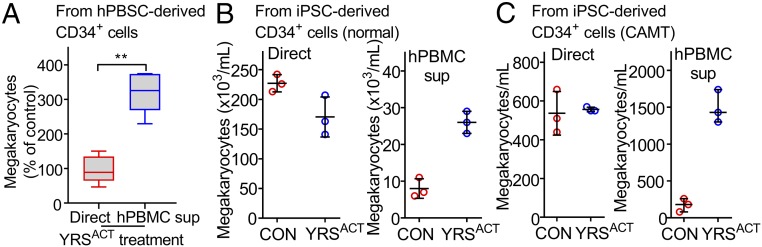
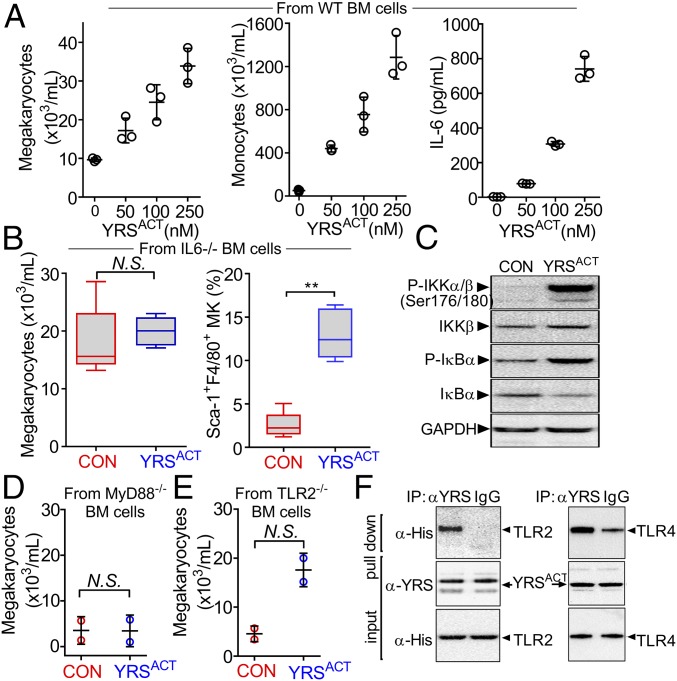
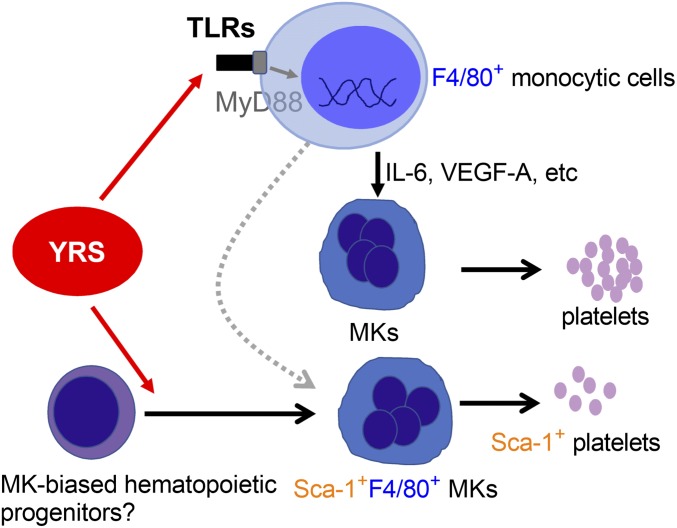
New mechanisms behind blood cell formation continue to be uncovered, with therapeutic approaches for hematological diseases being of great interest. Here we report an enzyme in protein synthesis, known for cell-based activities beyond translation, is a factor inducing megakaryocyte-biased hematopoiesis, most likely under stress conditions. We show an activated form of tyrosyl-tRNA synthetase (YRSACT), prepared either by rationally designed mutagenesis or alternative splicing, induces expansion of a previously unrecognized high-ploidy Sca-1+ megakaryocyte population capable of accelerating platelet replenishment after depletion. Moreover, YRSACT targets monocytic cells to induce secretion of transacting cytokines that enhance megakaryocyte expansion stimulating the Toll-like receptor/MyD88 pathway. Platelet replenishment by YRSACT is independent of thrombopoietin (TPO), as evidenced by expansion of the megakaryocytes from induced pluripotent stem cell-derived hematopoietic stem cells from a patient deficient in TPO signaling. We suggest megakaryocyte-biased hematopoiesis induced by YRSACT offers new approaches for treating thrombocytopenia, boosting yields from cell-culture production of platelet concentrates for transfusion, and bridging therapy for hematopoietic stem cell transplantation.

Keywords: megakaryopoiesis; thrombocytopenia; tyrosyl-tRNA synthetase.


Conflict of interest statement

Conflict of interest statement: R.B., M.-H.D., X.-L.Y., and P.S. have a financial interest in aTyr Pharma, although none specifically for this work.

Figures

Fig. 1.
Fig. 1.
YRSACT promotes platelet production in vivo. (A) Schematic representation of YRS domains. A Rossmann fold catalytic domain and anticodon-recognition domain, both essential for tRNATyr aminoacylation, constitute YRSMini. YRSACT contains a gain-of-function mutation (Y341A) in the context of full-length YRS. (B) A single injection of YRSACT (30 mg/kg), compared with vehicle (PBS), increased the blood platelet count of WT mice (n =14 in each group). (C) WT mice received one i.v. injection of anti-GPIbα monoclonal antibody (5A7; day 0) to deplete platelets. YRSACT (30 mg/kg) or vehicle (PBS) was injected on days 2 and 5 (n = 4) and blood cell counts were monitored at the indicated times. (D) Plasma samples were collected before and after (day 2) 5A7 injection, and TPO levels were determined by ELISA (n = 12). (E) BM cells of WT mice (n = 4) injected with YRSACT or vehicle (PBS) were harvested on day 3 and analyzed for MK ploidy by flow cytometry. Data are shown as mean ± 95% confidence interval (CI) (BD) or 25th to 75th percentile bars with median and min to max whiskers (E); in the latter panel, color-coded lines join the mean values (marked by a cross indicated inside each bar) of each ploidy distribution. ***P < 0.001 determined by one-way ANOVA with Dunn’s multiple comparison test (D) or two-way ANOVA with Sidak’s multiple comparison test (B, C, and E).
Fig. 2.
Fig. 2.
YRSACT induces ex vivo MK expansion independent of TPO signaling. (A) BM cells isolated from WT or c-mpl−/− mice (n = 6) were cultured for 3 d with PBS or 100 nM YRSACT and analyzed for MK number. (B) The cultures were analyzed for MK ploidy. Data are shown as 25th to 75th percentile bars with median and min to max whiskers. (C) BM cells isolated from WT mice (n = 12) were treated with 100 nM YRSACT (Y), 1.4 nM TPO (T), YRSACT plus TPO (YT), or PBS as control (CON) for 3 d; MKs were then counted. (D) Selected culture conditions described in C were analyzed for ploidy distribution. Data are shown as in A and B. *P < 0.05, **P < 0.01, ***P < 0.001 determined by one-way ANOVA followed by Sidak’s multiple comparison test (A) or Tukey’s multiple comparison test (C), or two-way ANOVA with Sidak’s multiple comparison test (B and D). (E) Pooled BM cells from two WT mice were cultured with added YRSWT (100 nM) or PBS (CON) for 3 d; MKs were then counted. (F) The cultures described in E were analyzed for ploidy distribution. Data of two experiments with technical triplicates are shown as min to max floating bars with mean. In B and F, color-coded lines join the mean values (marked by a cross indicated inside each bar) of each ploidy distribution.
Fig. 3.
Fig. 3.
Unique MK population expressing Sca-1 and F4/80 is induced by YRSACT in mouse BM cells cultured in vitro. (A) BM cells isolated from human GPIbα transgenic mice (mGPIbαnull;hGPIbαTg) and cultured in the presence of 100 nM YRSACT for 3 d were analyzed by immunofluorescent staining and confocal microscopy. MKs were identified by staining with anti-hGPIbα antibody (LJ-1b1). Arrows indicate Sca-1+F4/80+ MKs; the arrowhead indicates a Sca-1F4/80 MK. (B) WT mouse BM cells (n = 4) were treated with 2.3 nM IL-6 (IL6), 1.4 nM TPO (T), 100 nM YRSACT, or PBS as control (CON) for 3 d and analyzed by flow cytometry. **P < 0.01 determined by one-way ANOVA with Dunn’s multiple comparison test. (C) BM cells freshly isolated from a WT mouse were gated for MKs based on CD41 binding and FSC. (D) MKs gated in C analyzed for Sca-1 and F4/80 expression. (E) Time course of Sca-1+F4/80+ MK expansion (%) after YRSACT addition to BM cell cultures. (F) WT mouse BM cells treated with 100 nM YRSACT for 3 d were gated for MKs as in C. (G) MKs gated in F analyzed for Sca-1 and F4/80 expression. (H) Sca-1F4/80 and Sca-1+F4/80+ MKs identified in G were backgated for CD41 expression and size (FSC) showing that Sca-1+F4/80+ MKs are larger than Sca-1F4/80 MKs.
Fig. 4.
Fig. 4.
Induction of Sca-1+F4/80+ MKs and platelets by YRSACT administration into thrombocytopenic mice. (A) Acute thrombocytopenia induction (day 0) and YRSACT or PBS (control) administration (days 2 and 5) were as described in Fig. 1C (n = 4 in each group). Platelets were counted on days −1, 2, 5, 7, and 9. (BD) BM cells were harvested from femurs on day 7 and analyzed by flow cytometry to determine the percentage of Sca-1-F4/80–positive and –negative MKs (B) and respective ploidy distribution (C and D). Data are shown as mean ± 95% CI (A) or 25th to 75th percentile bars with median and min to max whiskers in other panels; in C and D, color-coded lines join the mean values (marked by a cross indicated inside each bar) of each ploidy distribution. *P < 0.05, **P < 0.01, ***P < 0.001 calculated by two-tailed Mann–Whitney test (B) or two-way ANOVA with Sidak’s multiple comparison test (C).
Fig. 5.
Fig. 5.
Monocytes/macrophages targeted by YRSACT mediate effects on MKs. (A and B) CD41+ cells isolated from WT mouse BM were transduced with the Lhx2 retrovirus for in vitro expansion. CD41+Lhx2 cells were cultured in the presence of stem cell factor (SCF), TPO, and IL-6, and analyzed by flow cytometry for KSL cell expansion and megakaryocyte ploidy. (C, Left) CD41+Lhx2 cells were cultured with added 100 nM YRSACT or PBS control (Direct; n = 3, in triplicate) or human peripheral blood mononuclear cells derived from healthy donors (n = 3) were cultured for 2 d with added 100 nM YRSACT or PBS, after which culture supernatants were transferred to CD41+Lhx2 cells (hPBMC sup). After 3 d in culture, CD41+Lhx2 cells were harvested and analyzed. MK counts in cultures exposed to YRSACT are expressed as the percent of those in PBS-treated control cultures and shown as min to max floating bars with mean. *P < 0.05 determined by two-tailed Welch’s t test. (C, Right) Analysis of MK ploidy distribution in cultures exposed to hPBMC supernatants; color-coded lines join the mean values of each ploidy distribution. **P < 0.01, ***P < 0.001 determined by two-way ANOVA with Sidak’s multiple comparison test. (D) Clodronate (Clo)- or PBS-encapsulated liposomes were injected into WT mice (n = 4) on day 0, and then YRSACT was given i.v. on days 1 and 3; BM cells were harvested for MK count on day 4. Clodronate liposomes had no effect on total BM cell number (Left) but reduced MKs (Middle) and TER119+ erythrocytes (Right). Data are shown as 25th to 75th percentile bars with median and min to max whiskers. *P < 0.05 calculated by two-tailed Mann–Whitney test. N.S., not significant.
Fig. 6.
Fig. 6.
Thrombopoietic activity of YRSACT is relevant in human cells. (A) Human CD34+ cells (from two donors) isolated from cryopreserved PBSCs were expanded and kept for 7 d in cultures supplemented with 200 nM YRSACT or PBS (CON), or with the supernatant of hPBMC cultures (from three donors) pretreated with YRSACT or PBS (CON) for 2 d. The number of MKs in cultures exposed to YRSACT directly (red boxes) or indirectly (blue boxes) was calculated as the percent of that in PBS-treated cultures. All hPBMC supernatants were tested in triplicate and the corresponding results were averaged for analysis. Data are shown as 25th to 75th percentile bars with median and min to max whiskers. **P < 0.01 calculated by two-tailed Mann–Whitney test. (B) CD34+ cells from normal human iPS sacs (sac-like structures that enclose hematopoietic progenitor cells) were cultured for 14 d and then differentiated for 9 d with added YRSACT (200 nM) or PBS (Left), or culture supernatant of hPBMCs exposed to YRSACT or PBS (Right). (C) Experiment as in B, except that CD34+ cells were isolated from iPS cells derived from a patient with CAMT. MK counts in C and D are shown as dot plots with mean ± SD of technical triplicates.
Fig. 7.
Fig. 7.
Effect of YRSACT depends on the TLR/MyD88 signaling pathway. (A) BM cells from three WT mice were pooled and split into aliquots for treatment with different YRSACT concentrations for 3 d. Cells were analyzed for MK (Left) and monocyte (Middle) count; additionally, culture supernatants were collected to measure IL-6 by ELISA (Right). Each experiment was performed with technical triplicates. (B) BM cells from IL-6−/− mice (n = 4) were isolated and treated with YRSACT for 3 d for evaluation by flow cytometry. (C) Normal hPBMCs were treated with YRSACT or PBS (CON) for 20 min and then lysed and analyzed by Western blotting to evaluate NF-κB activation. (D) BM cells from three MyD88−/− mice were pooled and treated with 100 nM YRSACT or PBS (CON) for 3 d before analysis by flow cytometry (n = 2 with technical triplicates). (E) BM cells prepared from three TLR2−/− mice were treated with YRSACT or PBS (CON) for 3 d before analysis by flow cytometry. (F) YRSACT was incubated with His-tagged recombinant TLR2 or TLR4 and then mixed with anti-YRS polyclonal antibody or control IgG; the precipitate was then analyzed by immunoblotting with an anti-His tag antibody. IP, immunoprecipitation. Data are shown as dot plots with mean ± SD in A, D, and E, or as 25th to 75th percentile bars with median and min to max whiskers in B; *P < 0.01 determined by Mann–Whitney two-tailed unpaired t test. N.S., not significant.
Fig. 8.
Fig. 8.
Schematic representation of the mechanism of YRSACT influence on megakaryopoiesis. YRSACT targets monocytic cells and signals through the TLR/MyD88 pathway, inducing cytokine secretion that facilitates MK expansion and platelet production. One remarkable effect of YRSACT is the induction of a unique subset of MKs that express Sca-1 and F4/80 as well as MK markers. Both of these mechanisms may represent the action of YRSACT on “MK-biased hematopoiesis” that contributes to rapid MK expansion and platelet replenishment under stress conditions.

Comment in

Similar articles

Cited by

References

    1. Guo M, Schimmel P. Essential nontranslational functions of tRNA synthetases. Nat Chem Biol. 2013;9:145–153. - PMC - PubMed
    1. Mukhopadhyay R, Jia J, Arif A, Ray PS, Fox PL. The GAIT system: A gatekeeper of inflammatory gene expression. Trends Biochem Sci. 2009;34:324–331. - PMC - PubMed
    1. Mirando AC, Francklyn CS, Lounsbury KM. Regulation of angiogenesis by aminoacyl-tRNA synthetases. Int J Mol Sci. 2014;15:23725–23748. - PMC - PubMed
    1. Kim S, You S, Hwang D. Aminoacyl-tRNA synthetases and tumorigenesis: More than housekeeping. Nat Rev Cancer. 2011;11:708–718. - PubMed
    1. Lo WS, et al. Human tRNA synthetase catalytic nulls with diverse functions. Science. 2014;345:328–332. - PMC - PubMed

Publication types

MeSH terms

LinkOut - more resources