. 2018 Aug 28;115(35):E8276-E8285.
doi: 10.1073/pnas.1806133115. Epub 2018 Aug 13.

Deep mutational scanning of hemagglutinin helps predict evolutionary fates of human H3N2 influenza variants

Affiliations

Deep mutational scanning of hemagglutinin helps predict evolutionary fates of human H3N2 influenza variants

Juhye M Lee et al. Proc Natl Acad Sci U S A. .

Abstract

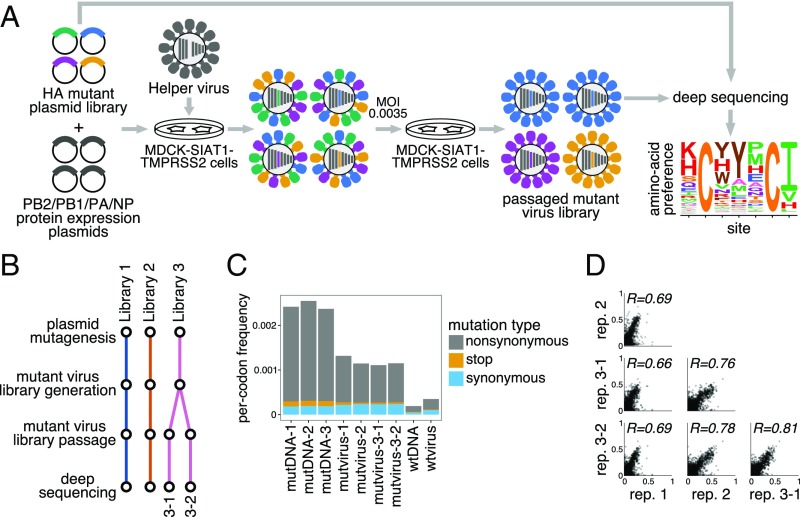
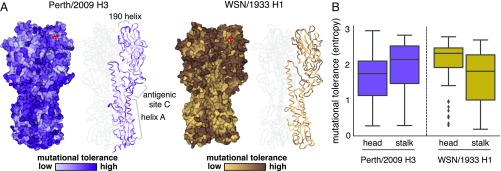
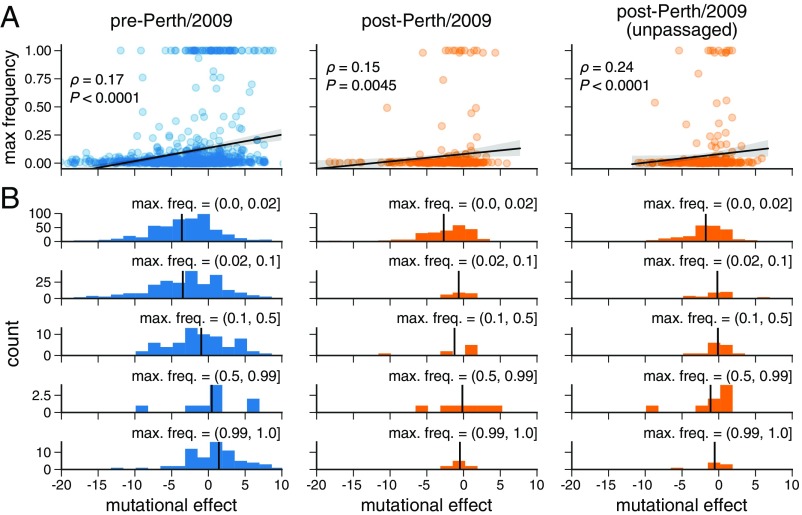
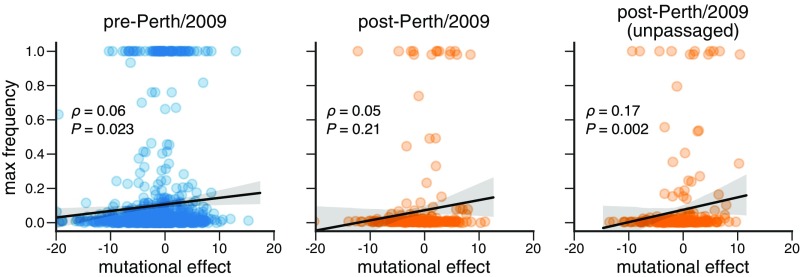
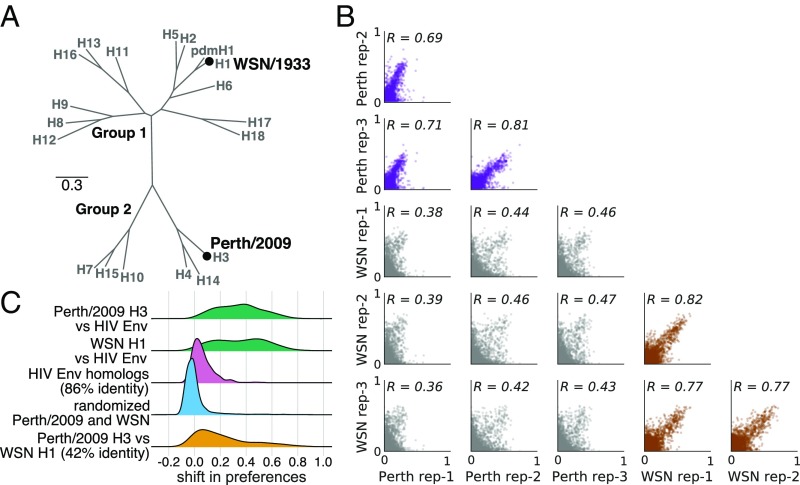
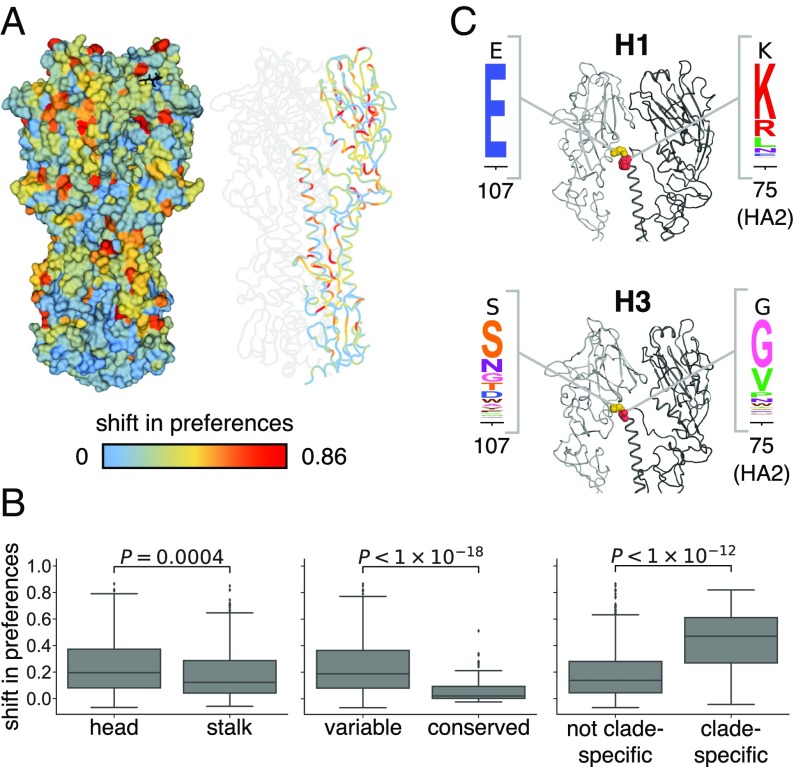
Human influenza virus rapidly accumulates mutations in its major surface protein hemagglutinin (HA). The evolutionary success of influenza virus lineages depends on how these mutations affect HA's functionality and antigenicity. Here we experimentally measure the effects on viral growth in cell culture of all single amino acid mutations to the HA from a recent human H3N2 influenza virus strain. We show that mutations that are measured to be more favorable for viral growth are enriched in evolutionarily successful H3N2 viral lineages relative to mutations that are measured to be less favorable for viral growth. Therefore, despite the well-known caveats about cell-culture measurements of viral fitness, such measurements can still be informative for understanding evolution in nature. We also compare our measurements for H3 HA to similar data previously generated for a distantly related H1 HA and find substantial differences in which amino acids are preferred at many sites. For instance, the H3 HA has less disparity in mutational tolerance between the head and stalk domains than the H1 HA. Overall, our work suggests that experimental measurements of mutational effects can be leveraged to help understand the evolutionary fates of viral lineages in nature-but only when the measurements are made on a viral strain similar to the ones being studied in nature.

Keywords: deep mutational scanning; epistasis; hemagglutinin; influenza virus; mutational shifts.


Conflict of interest statement

The authors declare no conflict of interest.

Figures

Fig. 1.
Fig. 1.
Deep mutational scanning of the Perth/2009 H3 HA. (A) We generated mutant virus libraries using a helper-virus approach (10) and passaged the libraries at low MOI to establish a genotype–phenotype linkage and to select for functional HA variants. Deep sequencing of the variants before and after selection allowed us to estimate each site’s amino acid preferences. (B) The experiments were performed in full biological triplicate. We also passaged and deep sequenced library 3 in duplicate. (C) Frequencies of nonsynonymous, stop, and synonymous mutations in the mutant plasmid DNA, the passaged mutant viruses, and wild-type DNA and virus controls. (D) The Pearson correlations among the amino acid preferences estimated in each replicate.
Fig. 2.
Fig. 2.
The site-specific amino acid preferences of the Perth/2009 HA measured in our experiments. The height of each letter is the preference for that amino acid, after taking the average over experimental replicates and rescaling (35) by the stringency parameter in Table 1. The sites are in H3 numbering. The top overlay bar indicates whether or not a site is in the set of epitope residues delineated in ref. . The bottom overlay bar indicates the HA domain (sig. pep., signal peptide; HA1 ecto., HA1 ectodomain; HA2 ecto., HA2 ectodomain; TM, transmembrane domain; cyto. tail, cytoplasmic tail). The letters directly above each logo stack indicate the wild-type amino acid at that site.
Fig. 3.
Fig. 3.
Mutational tolerance of each site in H3 and H1 HAs. (A) Mutational tolerance as measured in the current study is mapped onto the structure of the H3 trimer [Protein Data Bank (PDB) ID code 4O5N (41)]. Mutational tolerance of the WSN/1933 H1 HA as measured in ref. is mapped onto the structure of the H1 trimer [PDB ID code 1RVX (42)]. Different color scales are used because measurements are comparable among sites within the same HA but not necessarily across HAs. Both trimers are shown in the same orientation. For each HA, the structure at Left shows a surface representation of the full trimer, while the structure at Right shows a ribbon representation of just one monomer. The sialic acid receptor is shown in red sticks. (B) The mutational tolerance of solvent-exposed residues in the head and stalk domains of the Perth/2009 H3 HA (purple) and WSN/1933 H1 HA (gold). Residues falling in between the two cysteines at sites 52 and 277 were defined as belonging to the head domain, while all other residues were defined as the stalk domain. A residue was classified as solvent exposed if its relative solvent accessibility was 0.2. The results are robust to the choice of solvent accessibility cutoff (see SI Appendix, Fig. S7). Note that the mutational tolerance values are not comparable between the two HAs but are comparable between domains of the same HA.
Fig. 4.
Fig. 4.
Frequency trajectories of individual mutations and their relation to the experimentally measured effects of these mutations. Top shows the subset of the full H3N2 HA tree in SI Appendix, Fig. S8 from 2004 to 2014. Circles indicate individual amino acid mutations and are colored according to the mutational effect measured in our deep mutational scanning (negative values indicate mutations measured to be deleterious to viral growth). The Perth/2009 strain is labeled with a star, and nodes in the clade containing the Perth/2009 strain were excluded from our analyses. Bottom shows the frequency trajectory of each mutation, with trajectories colored according to the mutational effects as in Top. It is clear that most mutations that reach high frequency are measured to be relatively favorable in our experiments. SI Appendix, Fig. S11 shows a similar layout but colors mutations by whether they are in HA’s head or stalk domain.
Fig. 5.
Fig. 5.
Experimental measurements are informative about the evolutionary fate of viral mutations. (A) Correlation between the effects of mutations as measured in our deep mutational scanning of the Perth/2009 HA and the maximum frequency reached by these mutations in nature. The plots show Spearman ρ and an empirical P value representing the proportion of 10,000 permutations of the experimental measurements for which the permuted ρ was greater than or equal to the observed ρ. (B) The distribution of mutational effects partitioned by maximum mutation frequency. The vertical black line shows the mean mutation effect for each category. The analysis is performed separately for pre-Perth/2009, post-Perth/2009, and unpassaged isolates from the post-Perth/2009 partitions of the tree (see SI Appendix, Fig. S8).
Fig. 6.
Fig. 6.
Experimental measurements on an H1 HA are less informative about the evolutionary fate of H3N2 mutations. This figure repeats the analysis of the H3N2 mutation frequencies in Fig. 5A but uses the deep mutational scanning data for an H1 HA as measured in ref. . SI Appendix, Fig. S10 shows the histograms comparable to those in Fig. 5B. The empirical P value represents the result of 1,000 permutations.
Fig. 7.
Fig. 7.
There are large shifts in the effects of mutations between H1 and H3 HAs. (A) Phylogenetic tree of HA subtypes, with the WSN/1933 H1 and Perth/2009 H3 HAs labeled. (B) All pairwise correlations of the amino acid preferences measured in the three individual deep mutational scanning replicates in the current study and the three replicates in prior deep mutational scanning of the H1 HA (10). Comparisons between H3 replicates are in purple, those between H1 replicates are in brown, and those across H1 and H3 replicates are in gray. R indicates the Pearson correlation coefficient. (C) We calculated the shift in amino acid preferences at each site between H3 and H1 HAs using the method in ref. and plotted the distribution of shifts for all sites. The shifts between H3 and H1 (yellow) are much larger than the null distribution (blue) expected if all differences are due to experimental noise. The shifts are also much larger than those previously observed between two variants of HIV Env that share 86% amino acid identity (pink). However, the shifts between H3 and H1 are less than the differences between HA and HIV Env (green).
Fig. 8.
Fig. 8.
Sites with strongly shifted amino acid preferences between H3 and H1 HAs. (A) The shift in amino acid preferences between the H3 and H1 HA at each site as calculated in Fig. 7C is mapped onto the structure of the H3 HA. (B) Amino acid preferences of sites in the stalk domain are less shifted than those in the head domain. Sites absolutely conserved in all 18 HA subtypes are less shifted than other sites. Sites with one amino acid identity in the clade containing H1, H2, H5, and H6 and another identity in the clade containing H3, H4, and H14 are more shifted than other sites. (C) Sites 107 and 75(HA2) help determine the different orientation of the globular head domain in H1 versus H3 HAs. These sites are shown in spheres on the structure of H1 and H3 and colored as in A, and the experimentally measured amino acid preferences in the H1 and H3 HAs are shown. One monomer is in dark gray, while the HA1 domain of the neighboring monomer is in lighter gray.

References

    1. Fitch WM, Bush RM, Bender CA, Cox NJ. Long term trends in the evolution of H(3) HA1 human influenza type A. Proc Natl Acad Sci USA. 1997;94:7712–7718. - PMC - PubMed
    1. Bhatt S, Holmes EC, Pybus OG. The genomic rate of molecular adaptation of the human influenza A virus. Mol Biol Evol. 2011;28:2443–2451. - PMC - PubMed
    1. Smith DJ, et al. Mapping the antigenic and genetic evolution of influenza virus. Science. 2004;305:371–376. - PubMed
    1. Bedford T, Cobey S, Pascual M. Strength and tempo of selection revealed in viral gene genealogies. BMC Evol Biol. 2011;11:220. - PMC - PubMed
    1. Strelkowa N, Lässig M. Clonal interference in the evolution of influenza. Genetics. 2012;192:671–682. - PMC - PubMed

Publication types

Substances