. 2018 Aug 28;115(35):E8143-E8152.
doi: 10.1073/pnas.1809540115. Epub 2018 Aug 13.

Deciphering the super relaxed state of human β-cardiac myosin and the mode of action of mavacamten from myosin molecules to muscle fibers

Affiliations

Deciphering the super relaxed state of human β-cardiac myosin and the mode of action of mavacamten from myosin molecules to muscle fibers

Robert L Anderson et al. Proc Natl Acad Sci U S A. .

Abstract

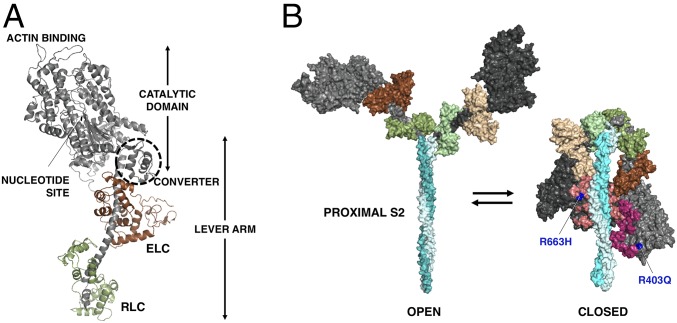
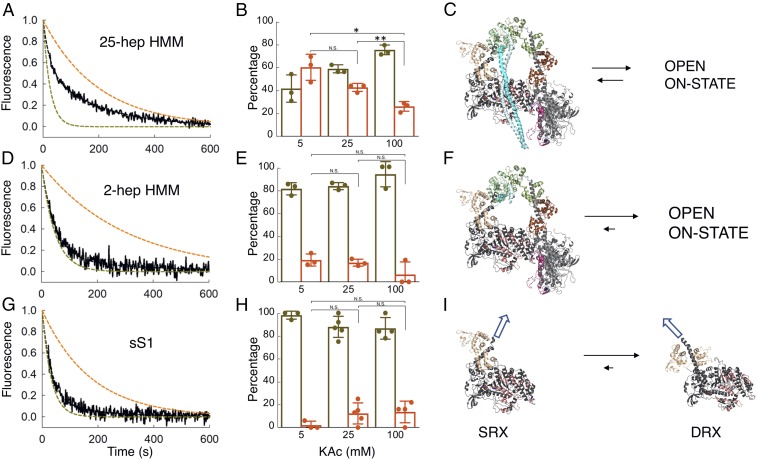
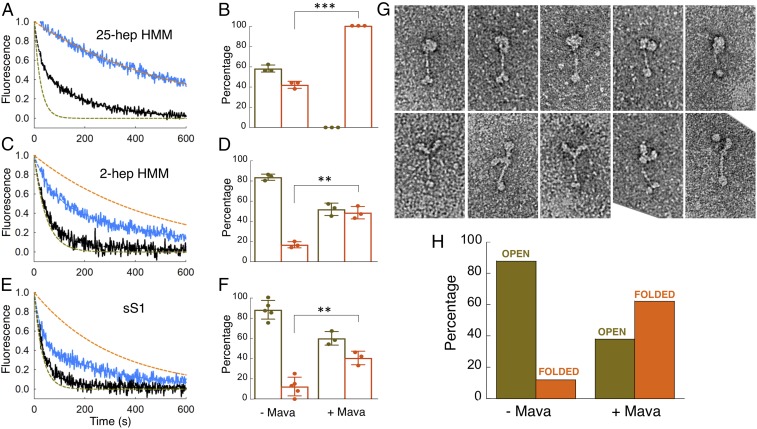
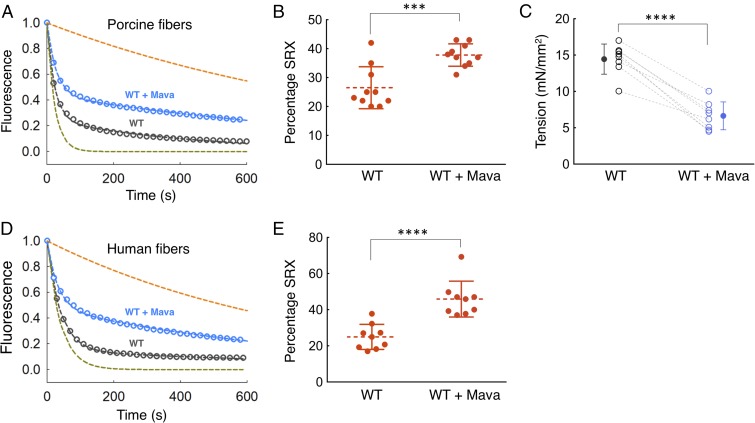
Mutations in β-cardiac myosin, the predominant motor protein for human heart contraction, can alter power output and cause cardiomyopathy. However, measurements of the intrinsic force, velocity, and ATPase activity of myosin have not provided a consistent mechanism to link mutations to muscle pathology. An alternative model posits that mutations in myosin affect the stability of a sequestered, super relaxed state (SRX) of the protein with very slow ATP hydrolysis and thereby change the number of myosin heads accessible to actin. Here we show that purified human β-cardiac myosin exists partly in an SRX and may in part correspond to a folded-back conformation of myosin heads observed in muscle fibers around the thick filament backbone. Mutations that cause hypertrophic cardiomyopathy destabilize this state, while the small molecule mavacamten promotes it. These findings provide a biochemical and structural link between the genetics and physiology of cardiomyopathy with implications for therapeutic strategies.

Keywords: cardiac inhibitor; interacting heads motif; mavacamten; myosin; super relaxed state.


Conflict of interest statement

Conflict of interest statement: J.A.S. is a cofounder of MyoKardia, a biotechnology company developing small molecules that target the sarcomere for the treatment of inherited cardiomyopathies, and of Cytokinetics and is a member of their scientific advisory boards. J.G.S. is a cofounder of MyoKardia and a member of its scientific advisory board. K.M.R. and R.C. are members of the MyoKardia scientific advisory board. R.L.A., M.H., and F.L.W. are employees of and own shares in MyoKardia. E.M.G. owns shares in MyoKardia.

Figures

Fig. 1.
Fig. 1.
Human β-cardiac myosin structural models. (A) PyMol homology model of human β-cardiac myosin S1 in the prestroke state showing its various domains. The ELC is in brown, and the RLC is in green. Modeling was done as described previously (30, 45). (B) Structural models of the open on-state and the closed IHM off-state of human β-cardiac myosin. The motor domains are black (blocked head) and dark gray (free head), the ELCs are in shades of brown, and the RLCs are in shades of green. The positions of R403Q and R663H (blue) are shown in the IHM relative to the mesa residues (45) (blocked head: light pink; free head: dark pink). Modeling was done as described previously (30, 45).
Fig. 2.
Fig. 2.
MANT-nucleotide release rates for purified human β-cardiac myosin fragments. (A, D, and G) Fluorescence decays of MANT-nucleotide release from 25-hep HMM, 2-hep HMM, and sS1, respectively, in 25 mM KAc (solid black curves). Fitting the traces to a double-exponential equation yielded the DRX and SRX rates of 0.040 and 0.0050 s−1 for 25-hep HMM, 0.021 and 0.0033 s−1 for 2-hep HMM, and 0.031 and 0.0057 s−1 for sS1. The simulated single-exponential orange dashed curves are the SRX rate (0.003–0.005 s−1), and the simulated single-exponential dashed olive green curves are the DRX rate (0.02–0.04 s−1). The simulated orange and olive green dashed curves act as references for the single exponential fits of slow and fast phases, respectively, that derive from fitting the solid black data curves with the best two exponential fits. Thus, the data (black lines) were fit with a combination of these two single exponentials. (B, E, and H) Percentage of myosin heads in the SRX (orange) versus DRX (olive green) states calculated from the amplitudes of the double-exponential fits of the fluorescence decays corresponding to the MANT-nucleotide release from the 25-hep HMM, 2-hep HMM, and sS1 constructs at various KAc concentrations. The 25-hep and 2-hep data are from three measurements each. The measurements come from three individual protein preparations done on different days. sS1 data have three, five, and four measurements at 5, 25, and 100 mM KAc, respectively. The measurements come from three individual protein preparations done on different days. (C) Homology model of folded-back human β-cardiac 25-hep HMM (MS03, https://spudlab.stanford.edu/homology-models/, showing only 13 heptad repeats of the S2) in equilibrium with an open on-state. (F) The 2-hep HMM (from MS03) in equilibrium with an open on-state. (I) The homology-modeled blocked head from the MS03 structure in equilibrium with the sS1 DRX structure from HBCprestrokeS1, downloadable at https://spudlab.stanford.edu/homology-models/. These two structures represent the two potential relaxed ATP- and/or ADP.Pi-bound states of the human β-cardiac myosin heads. The white arrows illustrate the different directions in which the light chain-binding regions point in the SRX vs. DRX states, where all alignments in C, F, and I are the same. Error bars denote SD. N.S., not significant, P > 0.05; *P ≤ 0.05; **P ≤ 0.01.
Fig. 3.
Fig. 3.
MANT-nucleotide release rates and percentage of folded states for purified human β-cardiac myosin fragments with and without mavacamten. (A, C, and E) Fluorescence decays of MANT-nucleotide release from 25-hep HMM, 2-hep HMM, and sS1 in 25 mM KAc with (blue curve) and without (black curve) mavacamten. Fitting the traces with mavacamten to exponential equations yielded the DRX and SRX rates of 0.014 and 0.0021 s−1 for 2-hep HMM and 0.035 and 0.0032 s−1 for sS1. The SRX rate for 25-hep HMM was 0.0017 s−1. The simulated orange and olive green dashed curves act as references for the single exponential fits of slow and fast phases, respectively, that derive from fitting the solid black data curves with the best two exponential fits. (B, D, and F) Percentage of myosin heads in the SRX (orange) versus DRX (olive green) states with and without mavacamten calculated from the double-exponential fits of the fluorescence decays corresponding to the MANT-nucleotide release from 25-hep HMM, 2-hep HMM, and sS1 at 25 mM KAc. The 25-hep and 2-hep data with and without mavacamten are from three measurements each. The measurements come from three individual protein preparations done on different days. sS1 data have three measurements with mavacamten and five measurements without mavacamten. The measurements come from three individual protein preparations done on different days. (G) Representative single-particle negatively stained EM images of the open and closed forms of the 25-hep HMM. Both the open and closed molecules were selected from a sample containing mavacamten cross-linked to 25-hep HMM at 25 mM KAc. (H) Percentage of 25-hep HMM molecules in the closed or open form in the presence and absence of mavacamten. A total of 622 and 183 molecules were counted for the with-mavacamtem and without-mavacamten samples, respectively. Ten micromolars mavacamten was used for single-turnover assays and 10 µM MYK-3046 (cross-linkable mavacamten) was used for EM imaging. Error bars denote SD. **P ≤ 0.01; ***P ≤ 0.001.
Fig. 4.
Fig. 4.
Effect of mavacamten on WT porcine and human cardiac fibers. Blue and dark gray curves denote experimental conditions with and without mavacamten, respectively. (A) SRX measurements with skinned cardiac fibers from WT pigs in the presence and absence of mavacamten. Fitting the traces to a double-exponential equation yielded the DRX and SRX rates of 0.043 and 0.0023 s−1 for porcine cardiac fibers in the absence of mavacamten and 0.036 and 0.0010 s−1 for porcine cardiac fibers in the presence of mavacamten. The simulated orange and green dashed curves act as references for the single exponential fits of slow and fast phases, respectively, that derive from fitting the solid blue and black data curves with the best two exponential fits. (B) Percentage of SRX detected in the porcine cardiac fibers with and without mavacamten. n = 10 unpaired measurements. (C) Maximum tension measurement in the skinned porcine cardiac fibers in the presence (1 µM) and absence of mavacamten. One pair of measurements was made per fiber; n = 8 paired measurements. Dashed lines represent a paired dataset with open circles. Solid circles denote the mean. (D) SRX measurements with skinned cardiac fibers from human hearts in the presence and absence of mavacamten. Fitting the traces to a double-exponential equation yielded the DRX and SRX rates of 0.046 and 0.0058 s−1 for human cardiac fibers in the absence of mavacamten and 0.057 and 0.0032 s−1 for human cardiac fibers in the presence of mavacamten. (E) The percentage of SRX in human cardiac fibers in the presence and absence of mavacamten. Fifty micromolars mavacamten was used for the fiber SRX assays. n = 9 unpaired measurements. Error bars for all measurements denote SD. ***P ≤ 0.001; ****P ≤ 0.0001.
Fig. 5.
Fig. 5.
Effect of mavacamten on ordering of myosin heads onto the thick filaments in WT porcine fibers. One pair of measurements was made per fiber for all fiber diffraction experiments. Solid circles denote the mean. (AC) Diffraction patterns of WT porcine fibers under relaxing conditions (pCa 8) without and with mavacamten and the difference in intensities. Color scales indicate increases in intensity. (D) Mavacamten increases the intensity of the meridional reflection M3 under relaxing conditions; n = 13 paired measurements. (E) Mavacamten decreases the equatorial intensity ratio, I1,1/1,0, under relaxing conditions. The intensity ratio (I1,1/I1,0) is the ratio of the integrated intensity of the 1,1 equatorial reflection arising from density in the plane containing both thick and thin filaments to that of the 1,0 equatorial reflection arising from density in the plane containing only thick filaments (72). Changes in the ratio I1,1/I1,0 are commonly used as a measure of shifts of mass, presumably cross-bridges, from the region of the thick filament to that of the thin filament; n = 20 paired measurements. (FH) Diffraction patterns of WT porcine fibers under contracting conditions (pCa 4) without and with mavacamten and the difference in intensities. Color scales indicate increases in intensity. (I) Mavacamten increases the intensity of the meridional reflection M3 under contracting conditions; n = 4 paired measurements. (J) Mavacamten decreases the equatorial intensity ratio, I1,1/1,0, under contracting conditions. n = 11 paired measurements. In D, E, I, and J, blue and black colors denote experimental conditions with and without mavacamten, respectively. Dotted lines represent a paired dataset with open circles. Error bars for all measurements denote SD. *P ≤ 0.05; ****P ≤ 0.0001.
Fig. 6.
Fig. 6.
Mavacamten stabilizes the SRX in porcine and human cardiac fibers carrying HCM mutations. Blue and dark gray denote experimental conditions with and without mavacamten, respectively. (A) SRX measurement with skinned cardiac fibers from R403Q pigs in the presence and absence of mavacamten. Fitting the traces to a double-exponential equation yielded the DRX and SRX rates of 0.030 and 0.0024 s−1 for R403Q porcine cardiac fibers in the absence of mavacamten and 0.033 and 0.0025 s−1 for R403Q porcine cardiac fibers in the presence of mavacamten. The green and orange curves are simulated single-exponential fits of fast and slow phase, respectively. (B) Percentage of SRX detected in the R403Q porcine cardiac fibers with (n = 8 measurements) and without (n = 10 measurements) mavacamten. One measurement was made per fiber. (C) Maximum tension measurement in the skinned cardiac fibers from R403Q pigs in the presence (1 µM) and absence of mavacamten. One paired measurement was made per fiber; n = 9 paired measurements. Dotted lines represent a paired dataset with open circles. Solid circles denote the mean. (D) Mavacamten increases the intensity of the meridional reflection M3 under relaxing conditions. One paired measurement was made per fiber for all fiber diffraction experiments. Dotted lines represent a paired dataset with open circles. Solid circles denote the mean. n = 6 paired measurements. (E, Upper) Diffraction patterns of R403Q porcine fibers under relaxing conditions (pCa 8) without and with mavacamten and the difference in intensities. (Lower) Diffraction patterns of R403Q porcine fibers under contracting conditions (pCa 4) without and with mavacamten and the difference in intensities. Color scales indicate increases in intensity. (F) Mavacamten decreases the equatorial intensity ratio, I1,1/1,0, of R403Q porcine fibers under relaxing conditions; n = 21 paired measurements. (G) Mavacamten decreases the equatorial intensity ratio, I1,1/1,0, of R403Q porcine fibers under contracting conditions; n = 7 paired measurements. (H) SRX measurements with skinned cardiac fibers from R663H human hearts in the presence and absence of mavacamten. Fitting the traces to a double-exponential equation yielded the DRX and SRX rates of 0.050 and 0.0038 s−1 for R663H human cardiac fibers in the absence of mavacamten and 0.060 and 0.0037 s−1 for R663H human cardiac fibers in the presence of mavacamten. (I) The percentage of SRX with and without mavacamten in the R663H human cardiac fibers. Fifty micromolars mavacamten was used for the fiber SRX and diffraction experiments. One measurement was made per fiber; n = 4 unpaired measurements. Error bars for all measurements denote the SD. *P ≤ 0.05; **P ≤ 0.01; ***P ≤ 0.001; ****P ≤ 0.0001.

References

    1. Toyoshima YY, et al. Myosin subfragment-1 is sufficient to move actin filaments in vitro. Nature. 1987;328:536–539. - PubMed
    1. Wendt T, Taylor D, Messier T, Trybus KM, Taylor KA. Visualization of head-head interactions in the inhibited state of smooth muscle myosin. J Cell Biol. 1999;147:1385–1390. - PMC - PubMed
    1. Wendt T, Taylor D, Trybus KM, Taylor K. Three-dimensional image reconstruction of dephosphorylated smooth muscle heavy meromyosin reveals asymmetry in the interaction between myosin heads and placement of subfragment 2. Proc Natl Acad Sci USA. 2001;98:4361–4366. - PMC - PubMed
    1. Burgess SA, et al. Structures of smooth muscle myosin and heavy meromyosin in the folded, shutdown state. J Mol Biol. 2007;372:1165–1178. - PubMed
    1. Jung HS, et al. Role of the tail in the regulated state of myosin 2. J Mol Biol. 2011;408:863–878. - PMC - PubMed

Publication types