. 2018 Oct 17;38(5):BSR20180411.
doi: 10.1042/BSR20180411. Print 2018 Oct 31.

The N-terminal polypeptide derived from vMIP-II exerts its anti-tumor activity in human breast cancer by regulating lncRNA SPRY4-IT1

Affiliations

The N-terminal polypeptide derived from vMIP-II exerts its anti-tumor activity in human breast cancer by regulating lncRNA SPRY4-IT1

Haihua Wu et al. Biosci Rep. .

Abstract

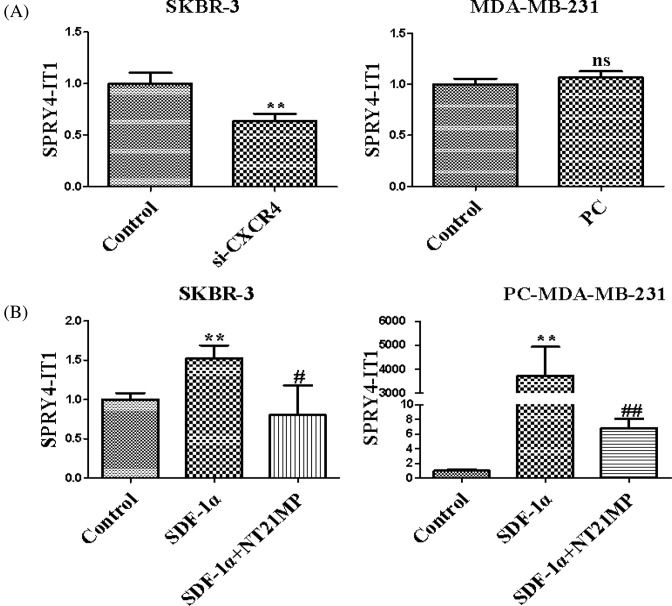
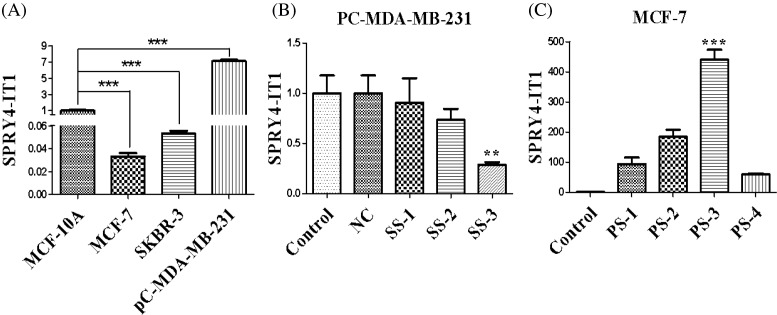
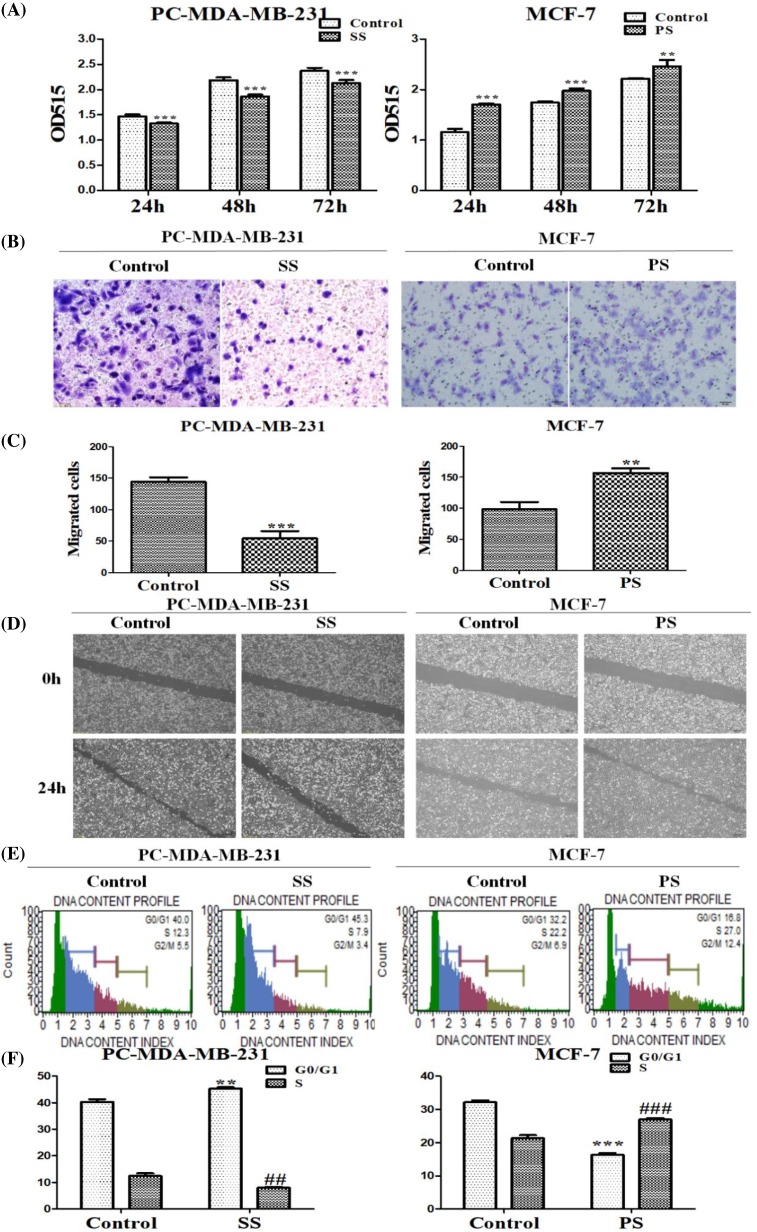
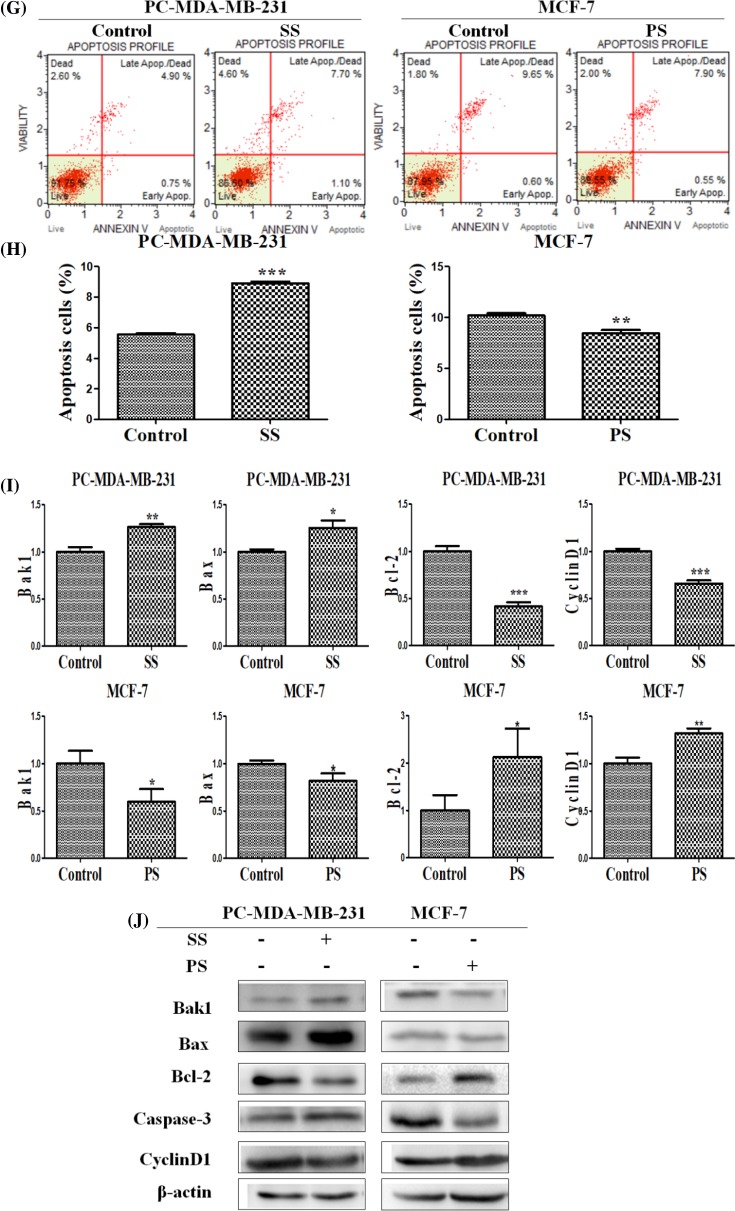
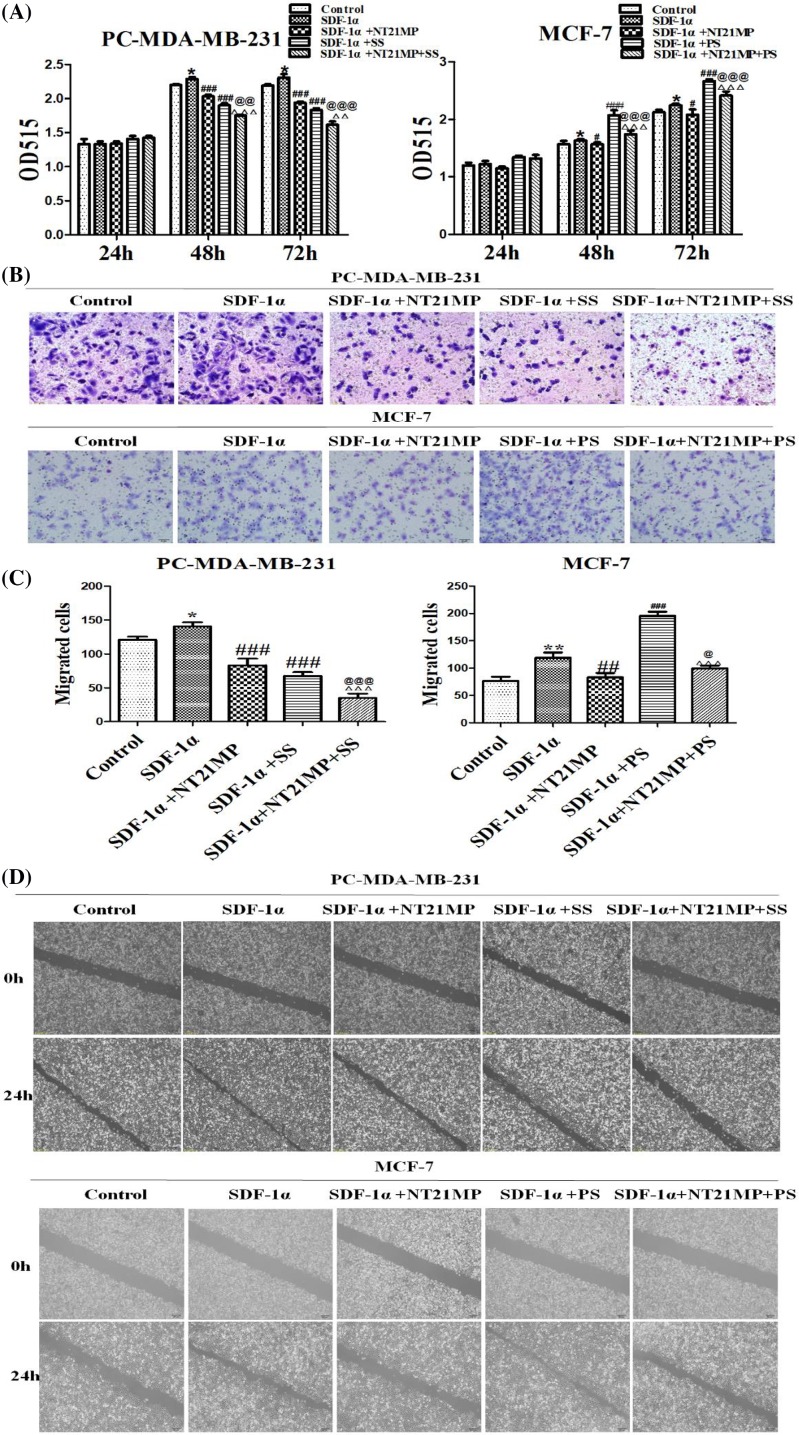
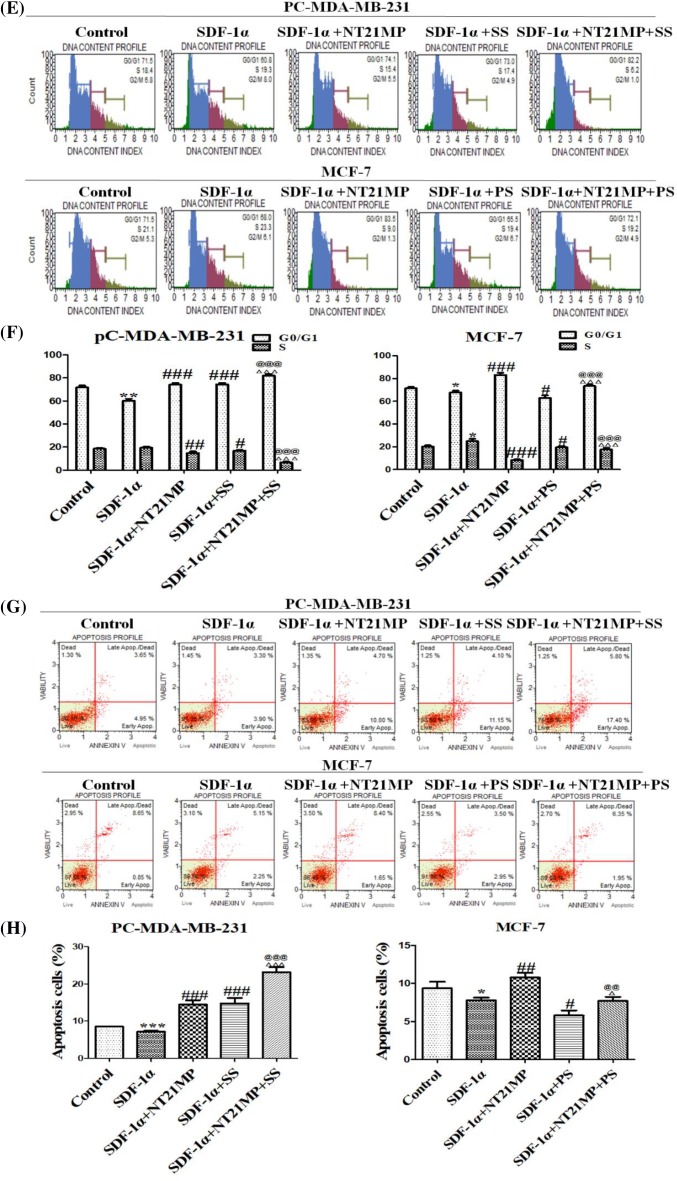
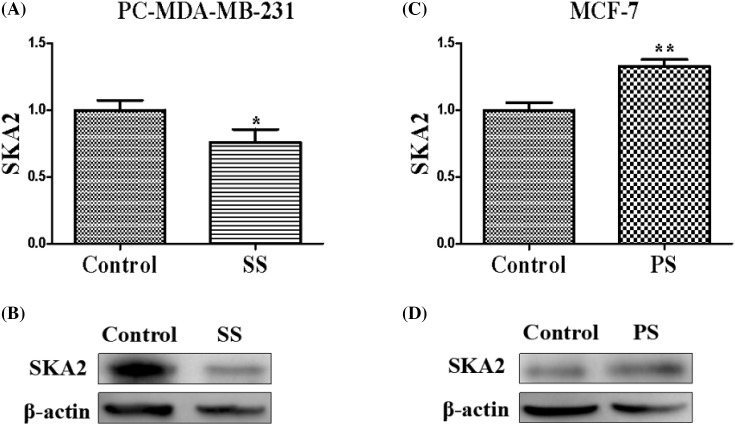
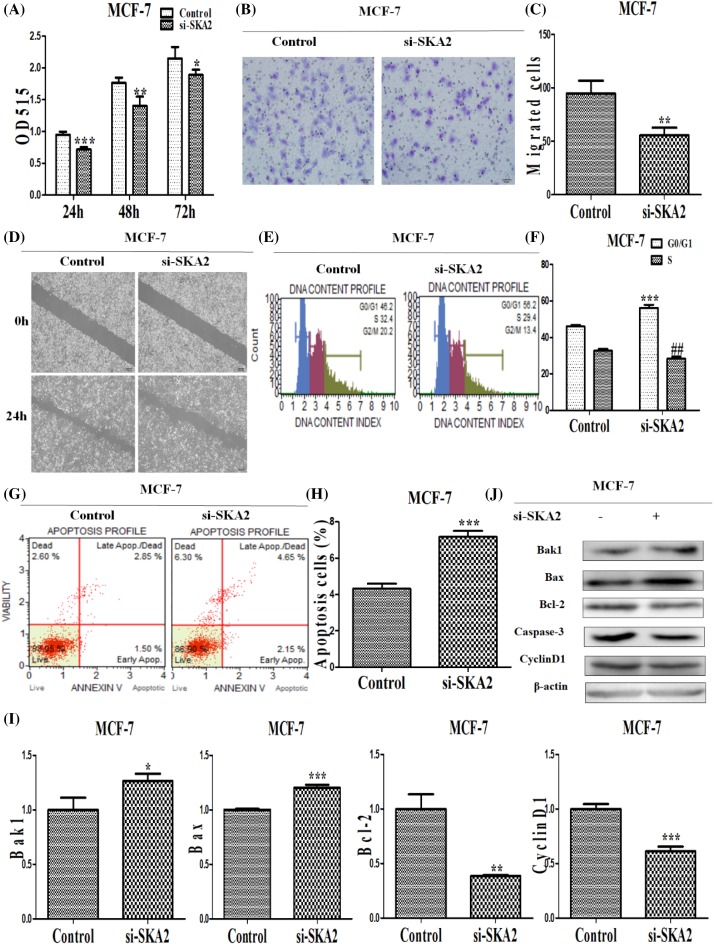
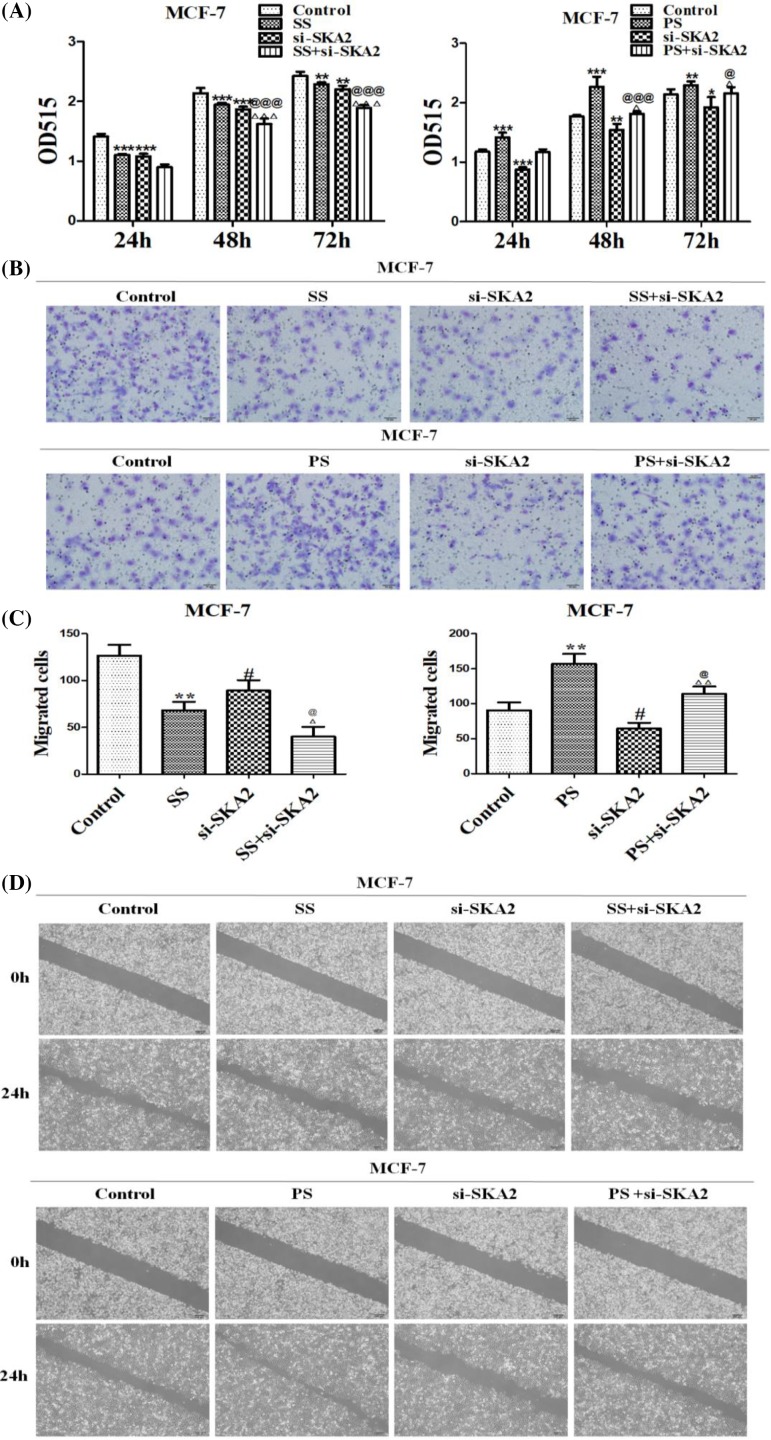
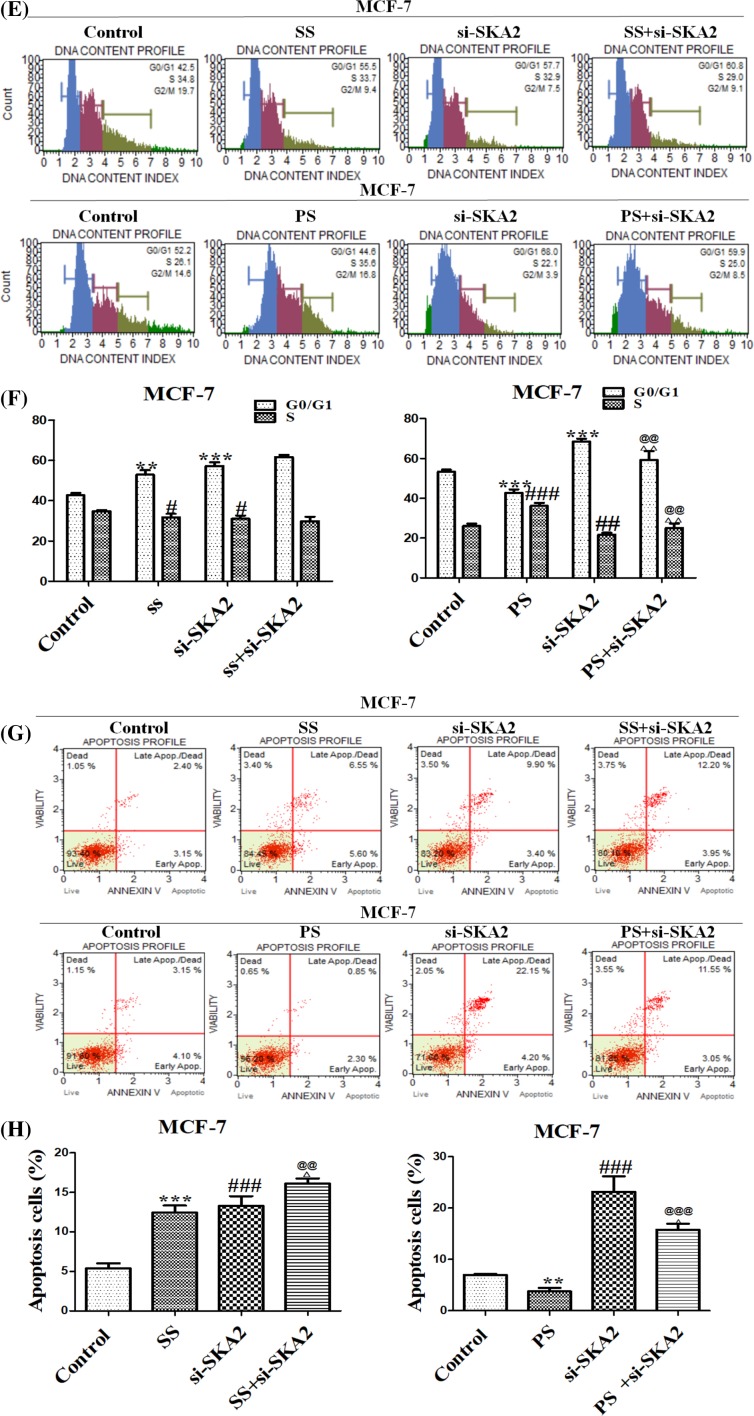
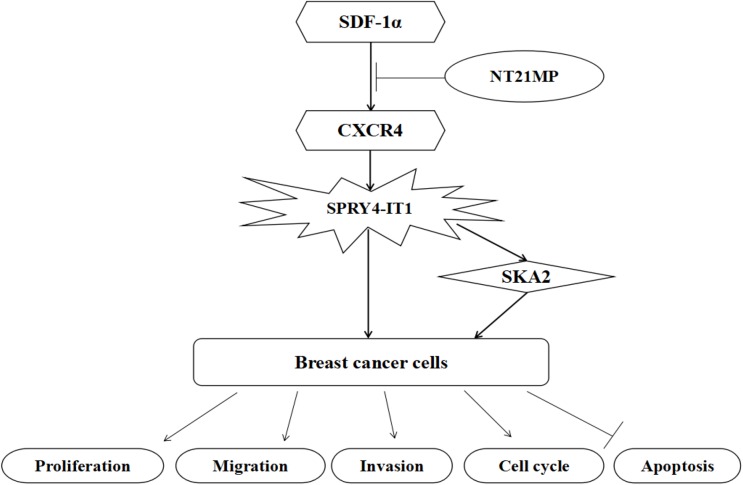
Accumulating evidence demonstrates that long non-coding RNA (lncRNA) sprouty4-intron transcript 1 (lncRNA SPRY4-IT1) plays a vital role in the development of breast cancer. However, the underlying mechanism has not been eventually illuminated. We aimed to explore the biological activity of lncRNA SPRY4-IT1 in breast cancer cells and whether N-terminal polypeptide derived from viral macrophage inflammatory protein II (NT21MP) could exert its anti-tumor effect by regulating lncRNA SPRY4-IT1 and its target gene SKA2 Real-time RT-PCR, Western blotting, wound healing, and invasion assays were used to achieve this goal. We found that lncRNA SPRY4-IT1 was highly expressed in breast cancer cells. Moreover, NT21MP markedly inhibited biological effects of breast cancer cells by regulating lncRNA SPRY4-IT1, which was partially achieved through SKA2. Our findings suggested that lncRNA SPRY4-IT1 could serve as a novel biomarker by NT21MP for breast cancer.

Keywords: Breast cancer; NT21MP; SKA2; SPRY4-IT1.


Conflict of interest statement

The authors declare that there are no competing interests associated with the manuscript.

Figures

Figure 1
Figure 1. Effects of NT21MP and depletion or overexpression of CXCR4 on the expression of SPRY4-IT1 in breast cancer cells
(A) The effects of depletion or overexpression of CXCR4 on the expression of SPRY4-IT1. (B) The influences of NT21MP on the expression of SPRY4-IT1. Data were presented as mean ± S.D. of three independent experiments. **P<0.05; #P or ##P<0.05. ns represents P>0.05 compared with the control group.
Figure 2
Figure 2. Expression of SPRY4-IT1 in breast cancer cell lines
(A) The mRNA level of SPRY4-IT1 in breast cancer cell lines (MCF-7, pC-MDA-MB-231, and SKBR-3) was compared with human breast epithelial cells (MCF-10A). (B) Quantitative RT-PCR screened the best siRNAs of SPRY4-IT1 after transfection of SPRY4-IT1. (C) Quantitative RT-PCR screened the cell lines of overexpression of the SPRY4-IT1. The data are the result of three independent experiments and are presented as mean ± S.D.; **P<0.05; ***P<0.01. ‘PC-MDA-MB-231’ is short for ‘pcDNA-CXCR4-MDA-MB-231’, ‘SS’ is short for ‘si-SPRY4-IT1’, ‘PS’ is short for ‘pcDNA-SPRY4-IT1’.
Figure 3
Figure 3. Effects of SPRY4- IT1 on cell proliferation, migration, invasion, cell cycle, and apoptosis in breast cancer cells
(A) The influence of depletion or overexpression of SPRY4-IT1 on cell proliferation in pcDNA-CXCR4-MDA-MB-231 cells and MCF-7 cells was measured by SRB assays. (B) Representative images indicated the invading cells with down-regulated or up-regulated SPRY4-IT1 analyzed by Transwell assay. Scale bar: 50 μm. Data are mean ± S.D. of five fields. (C) Quantitative results are illustrated for (B). (D) The influence of depletion or overexpression of SPRY4-IT1 on cell migration in breast cancer cells was measured by wound healing assays. (E) Effects of SPRY4-IT1 on cell cycle in breast cancer cells. The influence of depletion or overexpression of SPRY4-IT1 on cell cycle was analyzed by propidium iodide staining and flow cytometry. Bar plots illustrating the percentage of G0/G1 and S phase in breast cancer cells with down-regulated or up-regulated SPRY4-IT1. (F) Quantitative results are illustrated for (E). (G) Effects of SPRY4-IT1 on apoptosis in breast cancer cells. The influence of depletion or overexpression of SPRY4-IT1 on cell apoptosis was evaluated by AnnexinV/PI staining and flow cytometry. (H) Bar plots illustrate the percentage of apoptosis cells in breast cancer cells with down-regulated or up-regulated SPRY4-IT1. (I) Effects of SPRY4-IT1 on cell cycle and apoptosis related factors in breast cancer cells. The influence of depletion or overexpression of SPRY4-IT1 on the mRNA level of cell cycle and apoptosis related factors was analyzed by qRT-PCR. (J) Western blot analyzed the protein level of cell cycle and apoptosis related factors in breast cancer cells with down-regulated or up-regulated SPRY4-IT1. Data were presented as mean ± S.D. of three independent experiments. *P or **P<0.05, ***P<0.01. ##P<0.05 or ###P<0.01 vs control group. ‘SS’ is short for ‘si-SPRY4-IT1-3’, ‘PS’ is short for ‘pcDNA-SPRY4-IT1-3’.
Figure 4
Figure 4. Biological effects on NT21MP combined with SPRY4-IT1
(A) Effects of NT21MP and depletion or overexpression of SPRY4-IT1 on cell proliferation in breast cancer cells. The cells were transfected with SPRY4-IT1-specific siRNA or SPRY4-IT1-specific pcDNA-vector and stimulated with (+SDF-1α) or not (−SDF-1α) with 100 ng/ml of SDF-1α and NT21MP (1.0 μg/ml). (B) Representative images indicated the invading cells with down-regulated or up-regulated SPRY4-IT1 combinded with NT21MP analyzed by Transwell assay; scale bar: 50 μm. (C) Quantitative results are illustrated for (B). (D) The influence of NT21MP and depletion or overexpression of SPRY4-IT1 on cell migration and invasion were measured by wound healing assays. (E) Effects of NT21MP and depletion or overexpression of SPRY4-IT1 on cell cycle in breast cancer cells. The cells were transfected with SPRY4-IT1-specific siRNA or SPRY4-IT1-specific pcDNA-vertor and stimulated with (+SDF-1α) or not (−SDF-1α) with 100 ng/ml of SDF-1α and NT21MP (1.0 μg/ml). The influence of NT21MP and depletion or overexpression of SPRY4-IT1 on cell cycle were analyzed by propidium iodide staining and flow cytometry. Bar plots illustrating the percentage of G0/G1 and S phase in breast cancer cells with down-regulated or up-regulated SPRY4-IT1 combined with NT21MP. (F) Quantitative results are illustrated for (E). (G) Effects of NT21MP and depletion or overexpression of SPRY4-IT1 on apoptosis in breast cancer cells. The influence of NT21MP and depletion or overexpression of SPRY4-IT1 on cell apoptosis were evaluated by AnnexinV/PI staining and flow cytometry. Bar plots illustrating the percentage of apoptosis cells in breast cancer cells with down-regulated or up-regulated SPRY4-IT1 combined with NT21MP. (H) Quantitative results are illustrated for (G). Data were presented as mean ± S.D. of five fields, *P or **P<0.05; ***P<0.01; #P or ##P<0.05; ###P<0.01; @P or @@P<0.05; @@@P<0.01; ΔP or ΔΔP<0.05; ΔΔΔP<0.01. ‘SS’ is short for ‘si-SPRY4-IT1-3’, ‘PS’ is short for ‘pcDNA-SPRY4-IT1-3’.
Figure 5
Figure 5. Influence of depletion or overexpression of SPRY4-IT1 on the SKA2
The influence of depletion (A,B) or overexpression (C,D) of SPRY4-IT1 on the expression of SKA2 in breast cancer cells by quantitative RT-PCR and protein level. Data were presented as mean ± S.D. of three independent experiments, *P or **P<0.05. ‘SS’ is short for ‘si-SPRY4-IT1-3’, ‘PS’ is short for ‘pcDNA-SPRY4-IT1-3’.
Figure 6
Figure 6. The expression of SKA2 in three breast cancer cells and the screening of the best siRNA of SKA2
(A) The mRNA and protein level of SKA2 in the MCF-7, pC-MDA-MB-231, and SKBR-3 cells. (B) The protein level of SKA2 in the MCF-7, pC-MDA-MB-231, and SKBR-3 cells. (C) Quantitative RT-PCR screened the best siRNAs of SKA2 after transfection of SKA2-specific siRNA or a non-targetting control siRNA for 24 h. (D) Western blot screened the best siRNAs of SKA2 after transfection with SKA2-specific siRNA or a non-targetting control siRNA for 24 h. Data were presented as mean ± S.D. of three independent experiments, ***P<0.01.
Figure 7
Figure 7. The influence of depletion of SKA2 on biological effects in breast cancer cells
(A) The influence of depletion of SKA2 on the ability of cell proliferation in breast cancer cells. (B) Representative images indicated that the invading cells with down-regulated SKA2 analyzed by Transwell assays; scale bar: 50 μm. (C) Quantitative results are illustrated for (B). (D) The influence of depletion of SKA2 on cell migration and invasion was measured by wound healing assays. (E) The influence of depletion of SKA2 on the cell cycle in breast cancer cells. The influence of depletion of SKA2 on cell cycle was analyzed by propidium iodide staining and flow cytometry. Bar plots illustrating the percentage of G0/G1 and S phase in breast cancer cells with depletion of SKA2. (F) Quantitative results are illustrated for (E). (G) The influence of depletion of SKA2 on apoptosis in breast cancer cells. The influence of depletion of SKA2 on cell apoptosis was evaluated by AnnexinV/PI staining and flow cytometry. (H) Bar plots illustrating the percentage of apoptosis cells in breast cancer cells with depletion of SKA2. (I) Effects of depletion of SKA2 on cell cycle and apoptosis related factors in breast cancer cells. The influence of depletion of SKA2 on the mRNA level of cell cycle and apoptosis-related factors were analyzed by qRT-PCR. (J) Western blot analyzed the protein level of cell cycle and apoptosis-related factors in breast cancer cells with depletion of SKA2. The data are the results of three independent experiments and are presented as mean ± S.D. *P and ##P<0.05; **P<0.05 or ***P<0.01. ‘si-SKA2’ is short for ‘si-SKA2-1’.
Figure 8
Figure 8. SPRY4-IT1 exhibits its function through SKA2 on biological effects in breast cancer cells
(A) Effects of depletion of SKA2 and depletion or overexpression of SPRY4-IT1 on cell proliferation in breast cancer cells. (B) Representative images indicated that the invading cells with depletion of SKA2 and depletion or overexpression of SPRY4-IT1 analyzed by Transwell assay; scale bar: 50 μm. (C) Quantitative results are illustrated for (B). (D) Effects of depletion of SKA2 and depletion or overexpression of SPRY4-IT1 on cell migration and invasion in breast cancer cells were measured by wound healing assays. (E) Effects of depletion of SKA2 and depletion or overexpression of SPRY4-IT1 on cell cycle in breast cancer cells. The influence of depletion of SKA2 and depletion or overexpression of SPRY4-IT1 on cell cycle were analyzed by propidium iodide staining and flow cytometry. (F) Bar plots illustrating the percentage of G0/G1 and S phase in breast cancer cells with depletion of SKA2 and depletion or overexpression of SPRY4-IT1. (G) Effects of depletion of SKA2 and depletion or overexpression of SPRY4-IT1 on apoptosis in breast cancer cells. The influence of depletion of SKA2 and depletion or overexpression of SPRY4-IT1 on cell apoptosis were evaluated by Annexin V/PI staining and flow cytometry. (H) Bar plots illustrating the percentage of apoptosis cells in breast cancer cells with depletion of SKA2 and depletion or overexpression of SPRY4-IT1. Data were presented as mean ± S.D. of three independent experiments, **P<0.05, ***P<0.01, #P or ##P<0.05, ###P<0.01. *P<0.05; @P or @@P<0.05; @@@P<0.01; ΔP or ΔΔP<0.05,ΔΔΔ; P<0.01. ‘SS’ is short for ‘si-SPRY4-IT1-3’, ‘PS’ is short for ‘pcDNA-SPRY4-IT1-3’, ‘si-SKA2’ is short for ‘si-SKA2-1’.
Figure 9
Figure 9. Correlation between NT21MP and SKA2
(A) Effects of NT21MP and depletion of SKA2 on the ability of cell proliferation in breast cancer cells. The cells were transfected with SKA2-specific siRNA and stimulated with (+SDF-1α) or not (−SDF-1α) with 100 ng/ml of SDF-1α and NT21MP (1.0 μg/ml). (B) The influence of NT21MP and depletion of SKA2 on cell migration and invasion were measured by Transwell assays. Representative images indicated that the invading cells with depletion of SKA2 combined with NT21MP analyzed by Transwell assay; scale bar: 50 μm. (C) Quantitative results are illustrated for (B). (D) The influence of NT21MP and depletion of SKA2 on cell migration and invasion were measured by wound healing assays. (E) Effects of NT21MP and depletion of SKA2 on cell cycle in breast cancer cells. The cells were transfected with SKA2-specific siRNA and stimulated with (+SDF-1α) or not (−SDF-1α) with 100 ng/ml of SDF-1α and NT21MP (1.0 μg/ml). The influence of NT21MP and depletion of SKA2 on cell cycle were analyzed by propidium iodide staining and flow cytometry. (F) Effects of NT21MP and depletion of SKA2 on apoptosis in breast cancer cells. The influence of NT21MP and depletion of SKA2 on cell apoptosis were evaluated by AnnexinV/PI staining and flow cytometry. (G) Bar plots illustrating the percentage of G0/G1 and S phase in breast cancer cells with depletion of SKA2 combined with NT21MP. (H) Bar plots illustrating the percentage of apoptosis cells in breast cancer cells with depletion of SKA2 combined with NT21MP. Data were presented as mean ± S.D. of three independent experiments. *P or **P<0.05; #P or ##P<0.05, ###P<0.01; @P or @@P<0.05, @@@P<0.01; △P or △△P<0.05, △△△P<0.01. ‘si-SKA2’ is short for ‘si-SKA2-1’.
Figure 10
Figure 10. A model for SPRY4-IT1 in breast cancer cells is proposed

Similar articles

Cited by

References

    1. Torre L.A., Islami F., Siegel R.L., Ward E.M. and Jemal A. (2017) Global cancer in women: burden and trends. Cancer Epidemiol. Biomarkers Prev. 6, 444–457 10.1158/1055-9965.EPI-16-0858 - DOI - PubMed
    1. Donepudi M.S., Kondapalli K., Amos S.J. and Venkanteshan P. (2014) Breast cancer statistics and markers. J. Cancer Res. Ther. 10, 506–511 - PubMed
    1. Rygiel K. (2017) Cardiotoxic effects of radiotherapy and strategies to reduce them in patients with breast cancer: an overview. J. Cancer Res. Ther. 13, 186–192 10.4103/0973-1482.187303 - DOI - PubMed
    1. Chen W.Y. (2017) Role of aspirin in breast cancer survival. Curr. Oncol. Rep. 19, 48 10.1007/s11912-017-0605-6 - DOI - PubMed
    1. Lei H. Gao Y. and Xu X. (2017) LncRNA TUG1 influences papillary thyroid cancer cell proliferation, migration and EMT formation through targeting miR-145. Acta Biochim. Biophys. Sin. 22, 1–10 - PubMed

Publication types

MeSH terms