Review
. 2018 Aug 13;14(8):e8126.
doi: 10.15252/msb.20178126.

Data-independent acquisition-based SWATH-MS for quantitative proteomics: a tutorial

Affiliations
Review

Data-independent acquisition-based SWATH-MS for quantitative proteomics: a tutorial

Christina Ludwig et al. Mol Syst Biol. .

Abstract

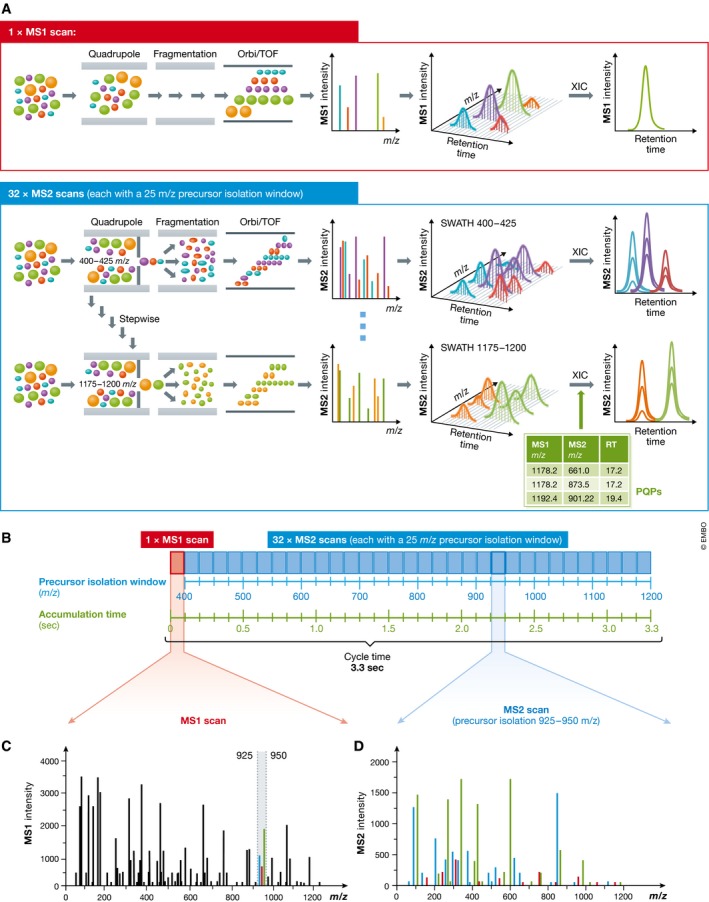
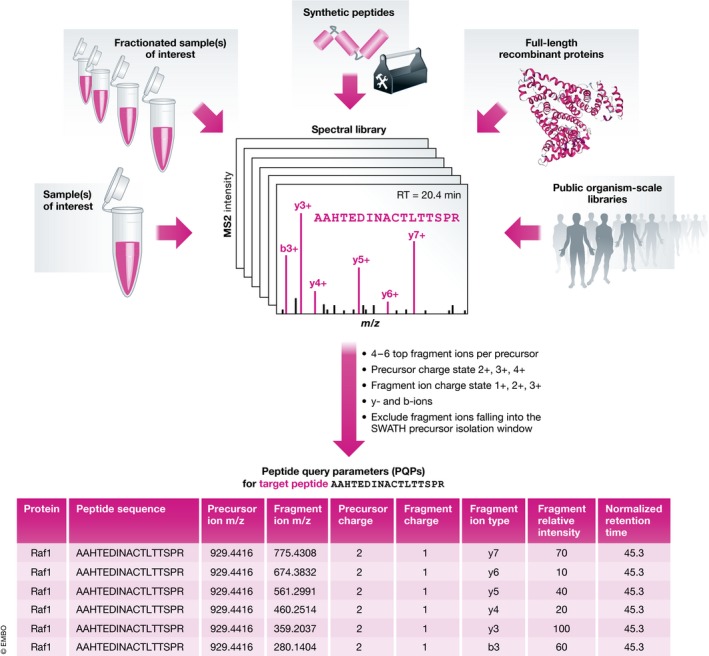
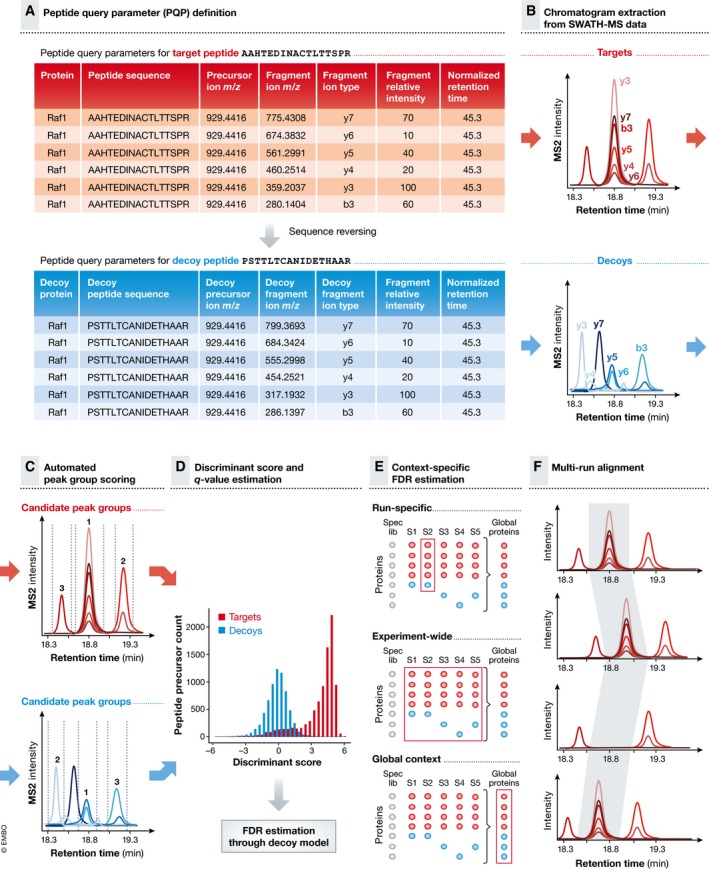
Many research questions in fields such as personalized medicine, drug screens or systems biology depend on obtaining consistent and quantitatively accurate proteomics data from many samples. SWATH-MS is a specific variant of data-independent acquisition (DIA) methods and is emerging as a technology that combines deep proteome coverage capabilities with quantitative consistency and accuracy. In a SWATH-MS measurement, all ionized peptides of a given sample that fall within a specified mass range are fragmented in a systematic and unbiased fashion using rather large precursor isolation windows. To analyse SWATH-MS data, a strategy based on peptide-centric scoring has been established, which typically requires prior knowledge about the chromatographic and mass spectrometric behaviour of peptides of interest in the form of spectral libraries and peptide query parameters. This tutorial provides guidelines on how to set up and plan a SWATH-MS experiment, how to perform the mass spectrometric measurement and how to analyse SWATH-MS data using peptide-centric scoring. Furthermore, concepts on how to improve SWATH-MS data acquisition, potential trade-offs of parameter settings and alternative data analysis strategies are discussed.

Keywords: SWATH‐MS; data‐independent acquisition; mass spectrometry; quantitative proteomics; systems biology.


Figures

Figure 1
Figure 1. Principle of sequentially windowed data‐independent acquisition in SWATHMS
(A) SWATHMS measurements are performed on fast scanning hybrid mass spectrometers, typically employing a quadrupole as first mass analyser and a TOF or Orbitrap as second mass analyser. In SWATHMS mode, typically a single precursor ion (MS1) spectrum is recorded, followed by a series of fragment ion (MS2) spectra with wide precursor isolation windows (for example 25 m/z). Through repeated cycling of consecutive precursor isolation windows over a defined mass range, a comprehensive data set is recorded, which includes continuous information on all detectable fragment and precursor ions. Hence, extracted ion chromatograms can be generated on MS2 as well as MS1 level. For the analysis of SWATHMS data, a peptide‐centric scoring strategy can be employed, which requires prior knowledge about the chromatographic and mass spectrometric behaviour of all queried peptides in form of peptide query parameters (PQPs). (B) The SWATHMS data acquisition scheme described by Gillet et al (2012) for a Q‐TOF mass spectrometer uses 32 MS2 scans with defined increments of 25 m/z, starting at 400 m/z and ending at 1,200 m/z. One full MS1 scan is recorded at the beginning. By applying an acquisition time of 100 ms per scan, a total cycle time of ~3.3 s is achieved. (C) The MS1 full scan detects all peptide precursors eluting at a given time point. For example, in the mass range from 925 to 950 m/z, three co‐eluting peptide species are detected (green, red and blue). (D) The corresponding MS2 scan with a precursor isolation window of 925–950 m/z represents a mixed MS2 spectrum with fragments of all three peptide species.
Figure 2
Figure 2. What are peptide query parameters (PQPs) and where do these parameters come from?
PQPs contain information about the chromatographic and mass spectrometric behaviour of a given peptide, as exemplified here for the peptide AAHTEDINACTLTTSPR. Various different input sample types can be used for the purpose of PQP generation. Typically, those samples are analysed in initial DDA measurements, and the results are summarized in the form of one or several spectral library files. From the spectral library file(s), the relevant PQPs are extracted by filtering the identified peptide coordinates using the indicated criteria. PQPs contain information about: the underlying protein, peptide sequence, precursor m/z, fragment m/z, precursor and fragment charge, fragment ion type, expected relative fragment ion intensities and normalized retention time (retention time relative to a set of reference peptides, iRT).
Figure 3
Figure 3. Setting up the optimal SWATHMS data acquisition scheme
(A) Effect of liquid chromatography gradient length on the number of identified proteins for technical triplicate injections of a trypsin‐digested HEK cell lysate acquired either in DDA (grey bars), SWATH 32 fixed windows (dark blue bars) or SWATH 64 variable windows (light blue bars) on a Q‐TOF instrument. (B) To improve precursor selectivity in SWATHMS, an acquisition scheme using variable precursor isolation window widths can be used to partition the precursor density equally across all isolation windows. (C) Ten recorded data points are considered necessary for accurate reconstruction of a chromatographic peak. For a peak width of 30 s a cycle time of 3 s leads to 10 recorded data points (red), which allows appropriate reconstruction of the actual peak shape (grey dashed line). Longer cycle times, for example 6 s (green) or 12 s (blue), lead to under sampling and the correct peak shape can no longer be optimally reconstructed. (D) If the average peak width is reduced from 30 (left panel) to 15 (middle panel) or even 5 s (right panel), the cycle time needs to be decreased accordingly from 3 to 1.5 and 0.5 s, in order to maintain 10 data points over the elution profile.
Figure 4
Figure 4. The rationale for using slightly overlapping precursor isolation windows
(A) In the first implementation of SWATHMS, a 1 m/z overlap between adjacent SWATH windows was used to compensate the inefficient ion transmission of the quadrupole at the edges of the precursor isolation window (B) and to limit the effect of precursor isotope splitting between windows (C and D). (B) Schematic representation of the efficiency of ion transmission with a state‐of‐the‐art quadrupole mass analyser filtering for the [500–526] m/z range. (C) Theoretical isotopic distribution of the doubly charged peptide MLSYPITIGSLLHK (m/z = 524.965). If non‐overlapping nominal windows are used [(500–525) and (525–550)], the isotopic profile is split between both windows and falls within the inefficient ion transmission range of the quadrupole [effective windows from ca. (500.5–524.5) and (525.5–549.5)]. Even if the window edge is placed at a mass where no precursor mass is supposed to occur (for example 525.1), the issue of inefficient ion transmission and loss of parts of the isotopic envelope would remain. (D) With overlapping nominal windows [(499–525) and (524–550)], most of the precursor isotopic pattern will be transmitted within the effective ion transmission range of the quadrupole [effective windows from ca. (499.5–524.5) and (524.5–549.5)].
Figure 5
Figure 5. Advanced DIA acquisition schemes with improved precursor selectivity
(A) Multiplexed DIA (MSX) (Egertson et al, 2013) can be used to improve data selectivity by isolating and co‐fragmenting at each cycle different non‐contiguous precursor mass regions. (B) In the offset‐windowed DIA approach, the precursor isolation window boundaries are offset by a discrete mass between consecutive cycles. For example, 25 m/z isolation windows get shifted by ± 12.5 m/z in each cycle. (C) In the “scanning quadrupole” isolation approach, termed SONAR (Moseley et al, 2018), the instrument continuously scans a wide precursor isolation window through the entire precursor mass range of interest, for example by scanning a mass range from 500 to 900 m/z using 200 × 20 m/z wide windows swiped with an 2 m/z increment.
Figure 6
Figure 6. Principle of peptide‐centric scoring of SWATHMS data
(A) Peptide‐centric scoring begins with a set of peptide query parameters (PQPs), which represent retention time, precursor ion masses, fragment ion masses and fragment ion signal intensity coordinates for the target peptides (red table). PQPs are also required for decoy peptides and are generated, for example, by reversing the amino acid sequence of target peptides, while keeping the terminal amino acid (blue table). Decoy peptides are used to assess the chance that peptides which are expected to be absent in the sample may also be detected by chance. (B) Extracted ion chromatograms (XICs) are generated based on PQPs from the continuously acquired SWATHMS2 spectra for target and decoy peptides. This results in a transformed and reduced data structure similar to data generated by targeted proteomics (SRM or PRM). (C) Fragment ion chromatograms are grouped according to their peptide association and “peak groups” with defined peak boundaries in the retention time dimension are selected. (D) For both target and decoy peak groups, a range of chromatogram‐ and spectrum‐based scores are computed and combined to a discriminant score by a semi‐supervised learning approach. The false discovery rate (FDR) of a set of detected peptides can be estimated by statistical modelling of the score distributions of target and decoy peptides. (E) For large‐scale SWATHMS analyses, error rate control should not only be performed on the peptide level, but should be extended to the protein level. Further, in large experiments including many samples, it might not be sufficient to conduct error rate control individually per run (“run‐specific” context), but better on an “experiment‐wide” scale. The “global” context considers only the best scoring detected peak groups, peptides or inferred proteins over all runs. (F) A multi‐run alignment allows to correct or reinforce confidence in peak detection by leveraging the chromatographic time consistency and transfer of detection confidence across runs.

Similar articles

Cited by

References

    1. Aebersold R, Mann M (2016) Mass‐spectrometric exploration of proteome structure and function. Nature 537: 347–355 - PubMed
    1. Ahrne E, Glatter T, Vigano C, Schubert C, Nigg EA, Schmidt A (2016) Evaluation and improvement of quantification accuracy in isobaric mass tag‐based protein quantification experiments. J Proteome Res 15: 2537–2547 - PubMed
    1. Bereman MS, Beri J, Sharma V, Nathe C, Eckels J, MacLean B, MacCoss MJ (2016) An automated pipeline to monitor system performance in liquid chromatography‐tandem mass spectrometry proteomic experiments. J Proteome Res 15: 4763–4769 - PMC - PubMed
    1. Bilbao A, Varesio E, Luban J, Strambio‐De‐Castillia C, Hopfgartner G, Muller M, Lisacek F (2015) Processing strategies and software solutions for data‐independent acquisition in mass spectrometry. Proteomics 15: 964–980 - PubMed
    1. Blainey P, Krzywinski M, Altman N (2014) Points of significance: replication. Nat Methods 11: 879–880 - PubMed

Publication types