

Unraveling mitotic protein networks by 3D multiplexed epitope drug screening
- PMID: 30104419
- PMCID: PMC6088390
- DOI: 10.15252/msb.20188238
Unraveling mitotic protein networks by 3D multiplexed epitope drug screening
Abstract
Three-dimensional protein localization intricately determines the functional coordination of cellular processes. The complex spatial context of protein landscape has been assessed by multiplexed immunofluorescent staining or mass spectrometry, applied to 2D cell culture with limited physiological relevance or tissue sections. Here, we present 3D SPECS, an automated technology for 3D Spatial characterization of Protein Expression Changes by microscopic Screening. This workflow comprises iterative antibody staining, high-content 3D imaging, and machine learning for detection of mitoses. This is followed by mapping of spatial protein localization into a spherical, cellular coordinate system, a basis for model-based prediction of spatially resolved affinities of proteins. As a proof-of-concept, we mapped twelve epitopes in 3D-cultured spheroids and investigated the network effects of twelve mitotic cancer drugs. Our approach reveals novel insights into spindle fragility and chromatin stress, and predicts unknown interactions between proteins in specific mitotic pathways. 3D SPECS's ability to map potential drug targets by multiplexed immunofluorescence in 3D cell culture combined with our automated high-content assay will inspire future functional protein expression and drug assays.
Keywords: cell profiling; mitosis modeling; multiplexed immunostaining; protein–protein interactions.
© 2018 The Authors. Published under the terms of the CC BY 4.0 license.
Figures
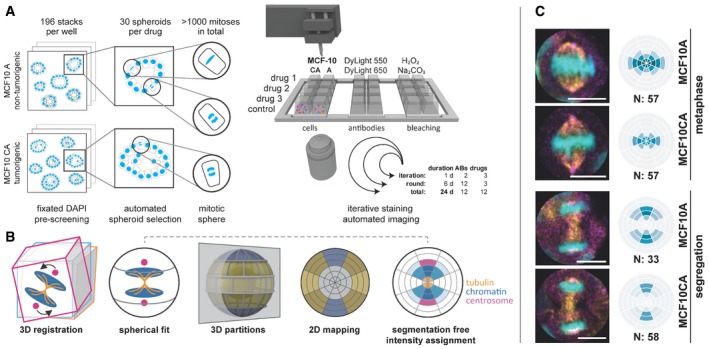
After 48 h of drug treatment, MCF10A and MCF10CA cells were fixed and DAPI stained. Pre‐screening comprised 196 image stacks per well to automatically select 30 spheroids that each showed at least one mitosis. At each round, selected positions for three drug treatments plus control were stained, imaged, and bleached in six iterations with two antibodies each. Within 24 days, we acquired 3D stacks of 12 antibodies on 12 drug treatments and two cell lines. ABs, antibodies.
SpheriCell visualization: Stacks were 3D registered and a sphere was fitted to each cell division area, which was partitioned into three symmetrical sets of spherical sectors (equatorial, diagonal, polar) and six equidistant shells. Spherical 3D localization can be visualized by a longitudinal cut resulting in a 2D polar grid that contains projected mean values of 3D partitions. Moreover, cell poles are not distinguishable, so the results are centrically symmetric. Localization of mitotic proteins can be intuitively determined from the 2D projected partitions as exemplified by tubulin, chromatin, and centrosomal regions. Color intensities reflect normalized, mean protein concentrations in each bin.
Example images and DAPI binning. Distinguished between MCF10A and MCF10CA, and metaphase and segregation spanning ana‐ and telophase. DAPI (cyan), γ‐tubulin (magenta), and β‐tubulin (yellow). For visualization, images were rotated to vertically align mitotic axes. N, number of mitoses contributing to mean values (scale bars: 10 μm).
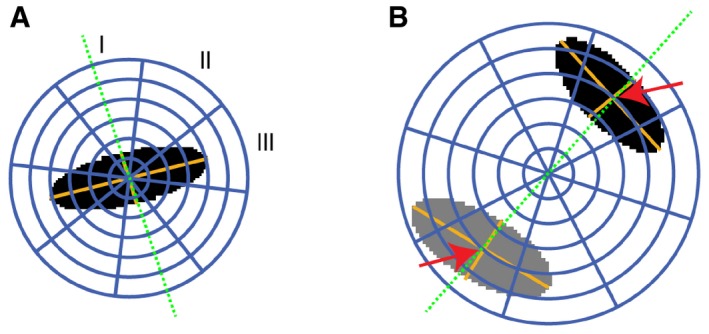
In cells during metaphase, a 3D ellipsoid (black area) was fitted to the DAPI signal to determine the orientation of the mitotic axis (green dotted line). This axis was defined by the smallest axis of the ellipsoid. Relative to the mitotic axis, three spherical sectors (I, polar; II, diagonal; III, equatorial) were delineated. Six shells were defined by dividing the sphere radius into six equally large intervals, of which the inner four spanned the largest ellipsoid axis nucleus area. Finally, 18 spherical 3D partitions were defined as intersections between spherical sectors and shells.
In cells during segregation, two ellipsoids were fitted to the chromatin regions (black and gray areas). The mitotic axis (green dotted line) was defined by the centroid to centroid vector. The map of spherical ROIs was specified relative to the centroid distances of the two chromatin regions. Six shells with equal radius intervals were defined by scaling the fourth shell to the distance between the centers of the two ellipsoids (red arrows).
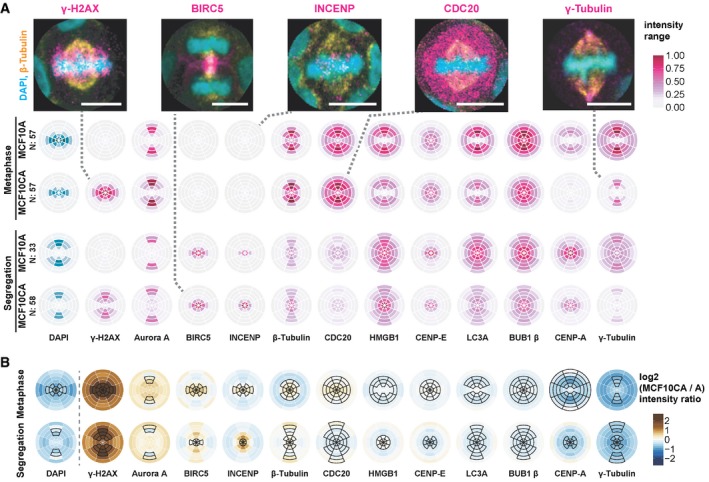
Localization of epitopes of twelve antibodies, besides DAPI staining, during metaphase and segregation (comprising ana‐ and telophase). SpheriCell plots depict mean intensity values across all imaging rounds. Stainings of proteins were ordered by decreasing difference between MCF10CA and MCF10A cells. Intensity ranges were specific to the antibody and are shown normalized between 0 and 1, effectively across all values of a column in the figure. Distribution patterns generally reflect the localization of individual proteins described before. Dashed lines connect SpheriCell plots with example images of antibody stainings (magenta), DAPI (cyan), and β‐tubulin (yellow) (scale bars: 10 μm). LC3A: microtubule‐associated proteins 1A/1B light chain 3A.
MCF10CA shows altered intensity patterns compared to MCF10A. SpheriCell plots depict differences of log2 transformed fluorescence intensity of MCF10CA and MCF10A [log2(CA) – log2(A)] for metaphase and segregation, in decreasing order. Black framed partitions indicate intensity distributions in untreated control images. LC3A, microtubule‐associated proteins 1A/1B light chain 3A.
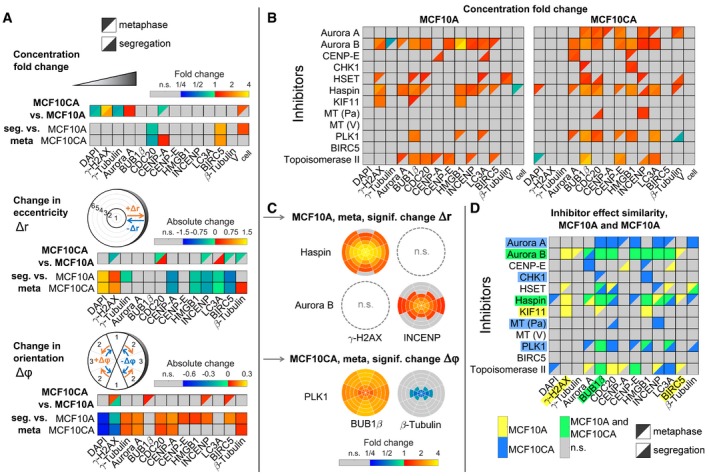
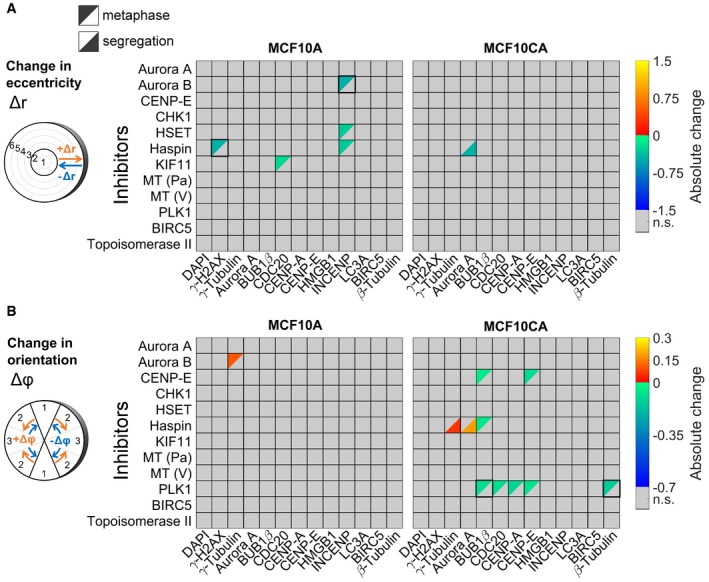
Concentration fold changes and localization changes, quantified as changes in eccentricity and orientation of localization patterns for comparisons between cell lines (MCF10CA vs. MCF10A), mitotic phases (segregation vs. metaphase). Effects related to cell line were indicated separately for metaphase (upper left triangles) and segregation (lower right triangles). The upper panel shows color‐coded fold changes in average concentrations (total intensities normalized by cell volumes) for DAPI and antibody stainings, together with fold changes of the cell volume, on a logarithmic scale. In the panel below, eccentricity changes for intensity distributions in spherical ROIs were visualized. Positive values describe a movement to the periphery, while negative values represent a movement to the center of the cell. Similarly, in the bottom panel, changes in angular orientation of intensity distributions were visualized. Positive values describe a movement toward the plane perpendicular to the cell division axis, while negative values describe a movement toward the cell division axis. In cases of significant differences to negative controls (Welch's t‐test with P < 0.05, Bonferroni multiple testing correction for 52 comparisons in each measured species), fold changes relative to negative controls are indicated by colors (n.s., not significant; seg., segregation).
Fold changes for inhibitor treatments (inhibitor vs. control) for MCF10A (left) and MCF10CA cells (right) as in (A). Analogous measures in eccentricity and orientation changes are shown in Fig EV2 (MT, microtubule inhibitor; Pa, paclitaxel; V, vinblastine).
Exemplary SpheriCell plots showing fold changes in ROIs for inhibitor treatments relative to controls. A significant decrease in the eccentricity of distribution patterns Δr, due to pronounced concentration increase in central ROIs, was observed for γ‐H2AX upon Haspin inhibitor treatment and for INCENP upon Aurora B inhibitor treatment (n.s., no significant change in Δr). A significant decrease in the measure of the distribution pattern orientation Δϕ, equivalent to an arrangement toward the cell division axis, was observed for BUB1β and β‐tubulin upon treatment with PLK1 inhibitor. All SpheriCell plots for fold changes in response to inhibitor treatments are shown in Figs EV3 and EV4.
Overlay of significant inhibitor effects in MCF10A cells, MCF10CA cells, or MCF10A and MCF10CA cells. Color highlighted proteins denote predominant effects per row (inhibitors) or column (measured species).
Changes in eccentricities of distribution patterns due to inhibitor treatments in MCF10A (left panel) or MCF10CA cells (right panel). All significant effects were visualized (Welch's t‐tests performed for 18 ROIs followed by Bonferroni correction, P < 0.05/18). Positive values describe a movement to the periphery, while negative values represent a movement to the center of the cell (MT, microtubule inhibitor; Pa, paclitaxel; V, vinblastine; n.s., not significant).
Changes in orientation of distribution patterns due to inhibitor treatments in MCF10A (left panel) or MCF10CA cells (right panel). All significant effects were visualized as in (A). Positive values describe a movement toward the plane perpendicular to the cell division axis, while negative values describe a movement toward the cell division axis.
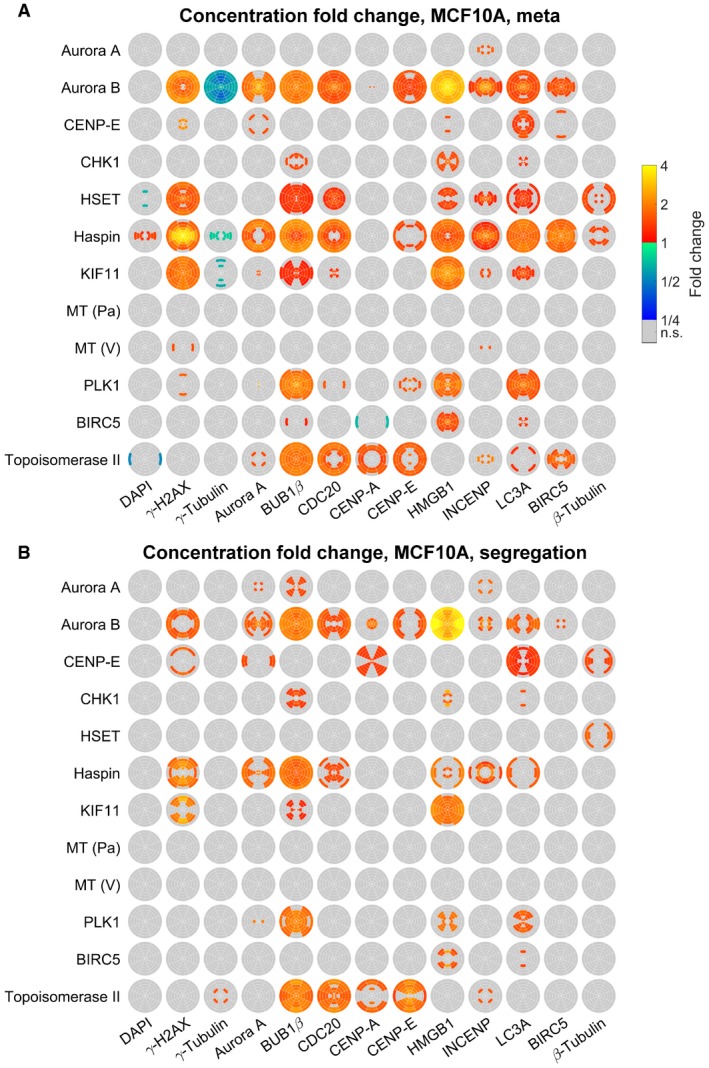
- A, B
SpheriCell plots indicating concentration fold changes for measured species in metaphase (A) or segregation phase (B) MCF10A cells treated by 12 inhibitors. Effects were visualized in ROIs with significant effects (Welch's t‐tests performed for 18 ROIs followed by Bonferroni correction, P < 0.05/18).
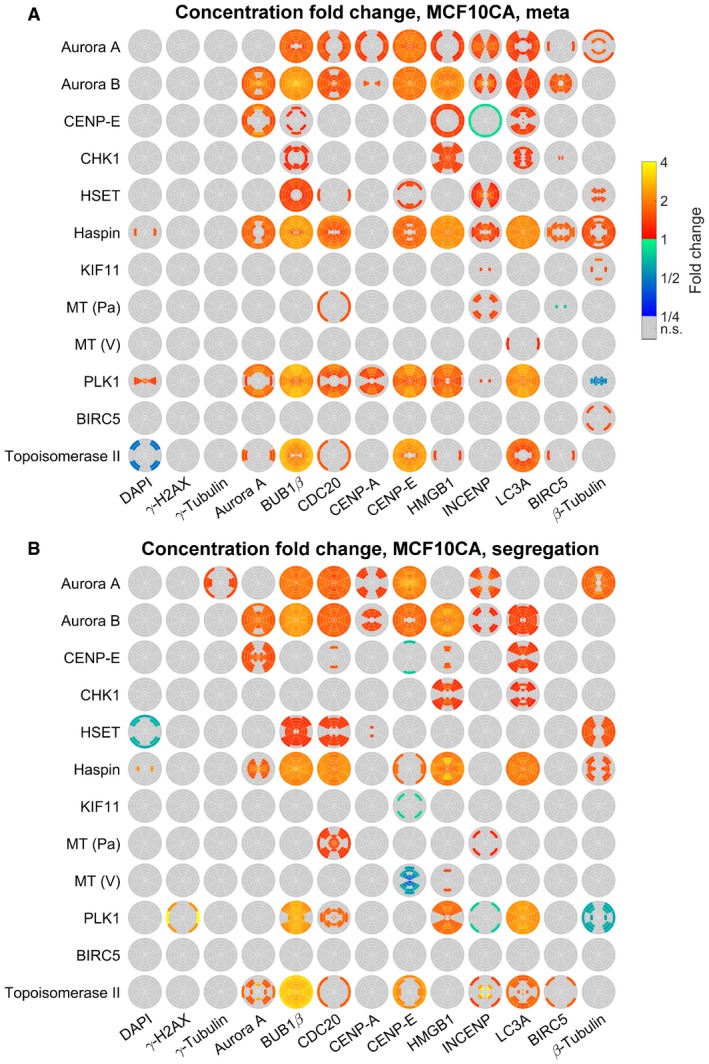
- A, B
SpheriCell plots indicating concentration fold changes for measured species in metaphase (A) or segregation phase (B) MCF10CA cells treated by 12 inhibitors. Effects were visualized in ROIs with significant effects (Welch's t‐tests performed for 18 ROIs followed by Bonferroni correction, P < 0.05/18).
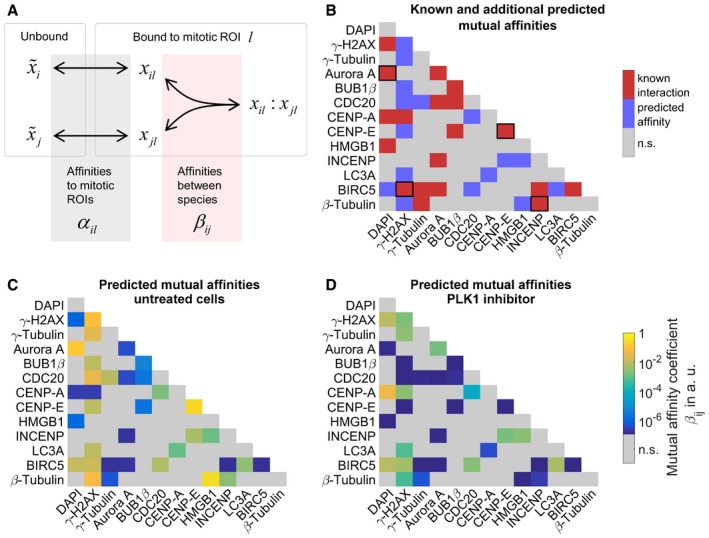
Schematic graph of the mathematical model describing concentration distributions of measured species in mitotic ROIs. Spatial distributions are explained by affinities of species to cellular structures contained in mitotic ROIs α il as well as homo‐ or heterodimeric interactions in ROIs described by affinities β ij. Affinities are defined as the inverse of dissociation constants (, unbound species i; x il, bound species i in ROI l, x il:x jl, heterodimer of species i and j in ROI l; see Materials and Methods for details).
Affinities related to known protein–protein interactions from Ingenuity Pathway Analysis overlaid with additional predicted mutual affinities between measured proteins. Known affinities that significantly contributed to explaining the measured intensity distributions were marked by black squares. For affinities to mitotic ROIs, see Appendix Fig S2.
Estimates of mutual affinities between measured proteins for untreated cells.
Estimated mutual affinities between measured proteins after treatment with PLK1 inhibitor.
Similar articles
-
3-Dimensional culture systems for anti-cancer compound profiling and high-throughput screening reveal increases in EGFR inhibitor-mediated cytotoxicity compared to monolayer culture systems.PLoS One. 2014 Sep 23;9(9):e108283. doi: 10.1371/journal.pone.0108283. eCollection 2014. PLoS One. 2014. PMID: 25247711 Free PMC article.
-
Large-Scale Gene Expression Profiling Platform for Identification of Context-Dependent Drug Responses in Multicellular Tumor Spheroids.Cell Chem Biol. 2016 Nov 17;23(11):1428-1438. doi: 10.1016/j.chembiol.2016.09.013. Epub 2016 Oct 27. Cell Chem Biol. 2016. PMID: 27984028
-
3D cell cultures toward quantitative high-throughput drug screening.Trends Pharmacol Sci. 2022 Jul;43(7):569-581. doi: 10.1016/j.tips.2022.03.014. Epub 2022 Apr 30. Trends Pharmacol Sci. 2022. PMID: 35504760 Review.
-
Phenotypic profiling of Raf inhibitors and mitochondrial toxicity in 3D tissue using biodynamic imaging.J Biomol Screen. 2014 Apr;19(4):526-37. doi: 10.1177/1087057113516674. Epub 2013 Dec 20. J Biomol Screen. 2014. PMID: 24361645 Free PMC article.
-
High Content Imaging (HCI) on Miniaturized Three-Dimensional (3D) Cell Cultures.Biosensors (Basel). 2015 Dec 14;5(4):768-90. doi: 10.3390/bios5040768. Biosensors (Basel). 2015. PMID: 26694477 Free PMC article. Review.
Cited by
-
Multi-omics analysis defines 5-fluorouracil drug resistance in 3D HeLa carcinoma cell model.Bioresour Bioprocess. 2021 Dec 23;8(1):135. doi: 10.1186/s40643-021-00486-z. Bioresour Bioprocess. 2021. PMID: 38650282 Free PMC article.
References
-
- Berthold MR, Cebron N, Dill F, Gabriel TR, Kötter T, Meinl T, Ohl P, Sieb C, Thiel K, Wiswedel B (2008) KNIME: the Konstanz information miner In Data analysis, machine learning and applications SE ‐ 38, Preisach C, Burkhardt H, Schmidt‐Thieme L, Decker R. (eds), pp 319–326. Heidelberg: Springer Berlin Heidelberg;
-
- Carmena M, Earnshaw WC (2003) The cellular geography of aurora kinases. Nat Rev Mol Cell Biol 4: 842–854 - PubMed
Publication types
MeSH terms
Substances
LinkOut - more resources
Full Text Sources
Other Literature Sources
Research Materials
