. 2018 Sep 26;373(1756):20170284.
doi: 10.1098/rstb.2017.0284.

A distributed brain network predicts general intelligence from resting-state human neuroimaging data

Affiliations

A distributed brain network predicts general intelligence from resting-state human neuroimaging data

Julien Dubois et al. Philos Trans R Soc Lond B Biol Sci. .

Abstract

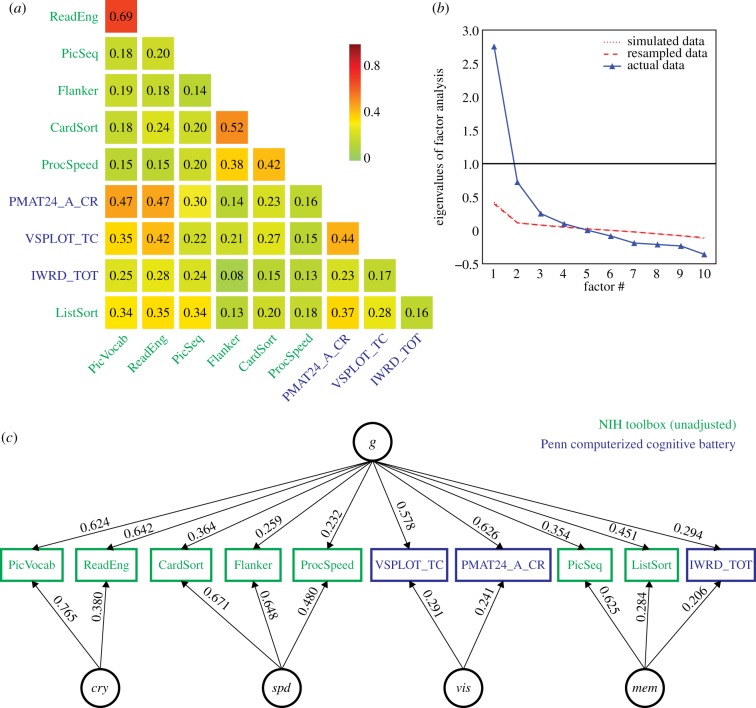
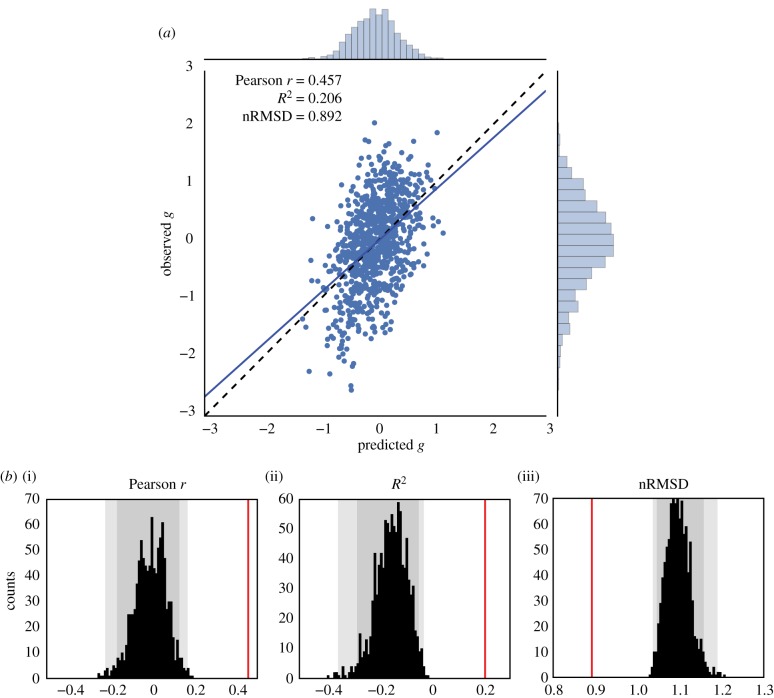
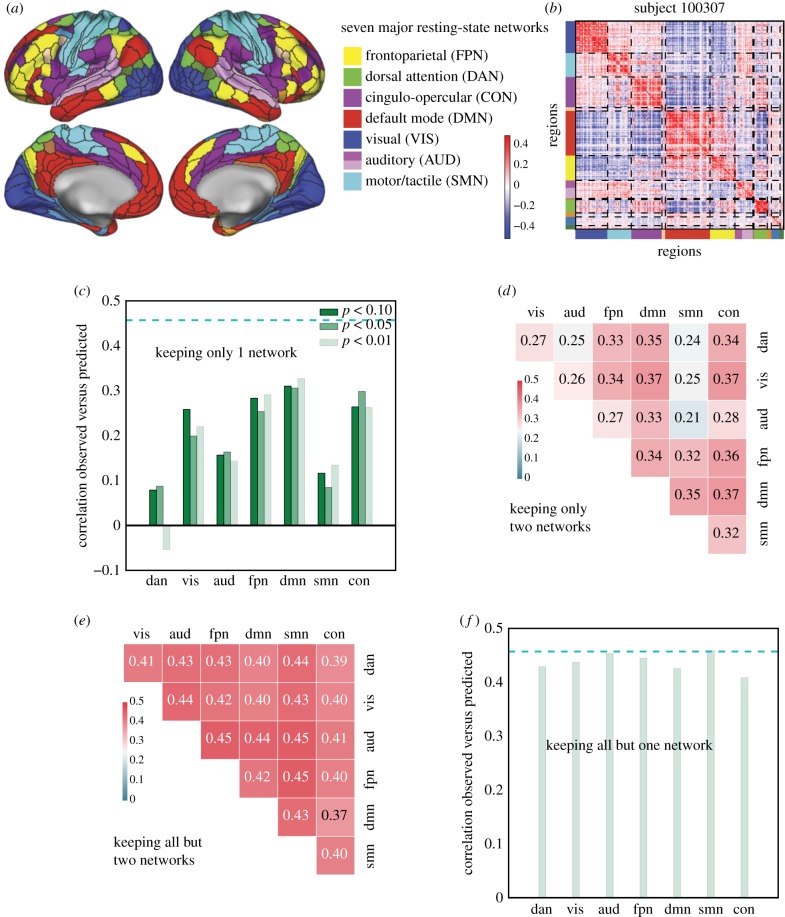
Individual people differ in their ability to reason, solve problems, think abstractly, plan and learn. A reliable measure of this general ability, also known as intelligence, can be derived from scores across a diverse set of cognitive tasks. There is great interest in understanding the neural underpinnings of individual differences in intelligence, because it is the single best predictor of long-term life success. The most replicated neural correlate of human intelligence to date is total brain volume; however, this coarse morphometric correlate says little about function. Here, we ask whether measurements of the activity of the resting brain (resting-state fMRI) might also carry information about intelligence. We used the final release of the Young Adult Human Connectome Project (N = 884 subjects after exclusions), providing a full hour of resting-state fMRI per subject; controlled for gender, age and brain volume; and derived a reliable estimate of general intelligence from scores on multiple cognitive tasks. Using a cross-validated predictive framework, we predicted 20% of the variance in general intelligence in the sampled population from their resting-state connectivity matrices. Interestingly, no single anatomical structure or network was responsible or necessary for this prediction, which instead relied on redundant information distributed across the brain.This article is part of the theme issue 'Causes and consequences of individual differences in cognitive abilities'.

Keywords: brain–behaviour relationship; functional connectivity; general intelligence; individual differences; prediction; resting-state fMRI.


Conflict of interest statement

The authors declare no conflict of interest.

Figures

Figure 1.
Figure 1.
Exploratory factor analysis of select cognitive tasks (electronic supplementary material, table S1) in the HCP dataset, using N = 1181 subjects. (a) All cognitive task scores correlated positively with one another, reflecting the well-established positive manifold (see also the electronic supplementary material, figure S2 for scatter plots). (b) A parallel analysis suggested the presence of four latent factors from the covariance structure of cognitive task scores. Note that the simulated and resampled data lines are nearly indistinguishable. (c) A bifactor analysis fit the data well (see fit statistics in text), and yielded a theoretically plausible solution with a general factor (g) and four group factors which can be interpreted as crystallized ability (cry), processing speed (spd), visuospatial ability (vis) and memory (mem). Loadings less than 0.2 are not displayed.
Figure 2.
Figure 2.
Prediction of the general factor of intelligence g from resting-state functional connectivity, averaging all resting-state runs for each subject (REST12, totalling almost 1 h of fMRI data). (a) Observed versus predicted values of the general factor of intelligence. The regression line had a slope close to 1, as expected theoretically [95]. The correlation coefficient was r = 0.457 (REST1 only, r = 0.419; REST2 only, r = 0.312). (b) Evaluation of prediction performance according to several statistics and their distributions under the null hypothesis, as simulated through permutation testing (with 1000 surrogate datasets). All fit statistics (red lines) fell far out of the confidence intervals under the null hypothesis. (i) The correlation between observed and predicted values; (ii) the coefficient of determination R2, interpretable as the proportion of explained variance; (iii) the nRMSD, which indicates the average difference between observed and predicted scores. Faint grey shade: p < 0.05; darker grey shade: p < 0.01, permutation tests.
Figure 3.
Figure 3.
A distributed neural basis for g. (a) Assignment of parcels to major resting-state networks, reproduced from Ito et al. [77]. (b) Example REST12 functional connectivity matrix ordered by network, for an individual subject (id = 100 307). (c) Prediction performance for REST12 matrices (as Pearson correlation between observed and predicted scores) using only within network edges, for the seven main resting-state networks listed in (a). DMN, FPN, CON and VIS carry the most information about g. The three shades of green correspond to three univariate thresholds for initial feature selection (we used p < 0.01 as in the main analysis; as well as p < 0.05 and p < 0.1 to make sure that the results were not limited by the inclusion of too few edges). The dashed cyan line shows for comparison the prediction performance for the whole-brain connectivity matrix (same data as in figure 2). (d) Prediction performance with two networks only (univariate feature selection with p < 0.01). (e) Prediction performance for REST12 matrices after ‘lesioning’ two networks (univariate feature selection with p < 0.01). (f) Prediction performance after lesioning one network (univariate feature selection with p < 0.01).

References

    1. Gottfredson LS. 1997. Mainstream science on intelligence: An editorial with 52 signatories, history, and bibliography. Intelligence 24, 13–23. ( 10.1016/S0160-2896(97)90011-8) - DOI
    1. Gottfredson LS. 1997. Why g matters: the complexity of everyday life. Intelligence 24, 79–132. ( 10.1016/S0160-2896(97)90014-3) - DOI
    1. Jensen AR. 1981. Straight talk about mental tests. New York, NY, USA: The Free Press.
    1. Burkart JM, Schubiger MN, van Schaik CP. 2016. The evolution of general intelligence. Behav. Brain Sci. 40, 1–65. - PubMed
    1. Plomin R, Deary IJ. 2015. Genetics and intelligence differences: five special findings. Mol. Psychiatry 20, 98–108. ( 10.1038/mp.2014.105) - DOI - PMC - PubMed

Publication types

LinkOut - more resources