. 2018 Aug 13;18(8):2647.
doi: 10.3390/s18082647.

ABE-VIEW: Android Interface for Wireless Data Acquisition and Control

Affiliations

ABE-VIEW: Android Interface for Wireless Data Acquisition and Control

Daniel M Jenkins et al. Sensors (Basel). .

Abstract

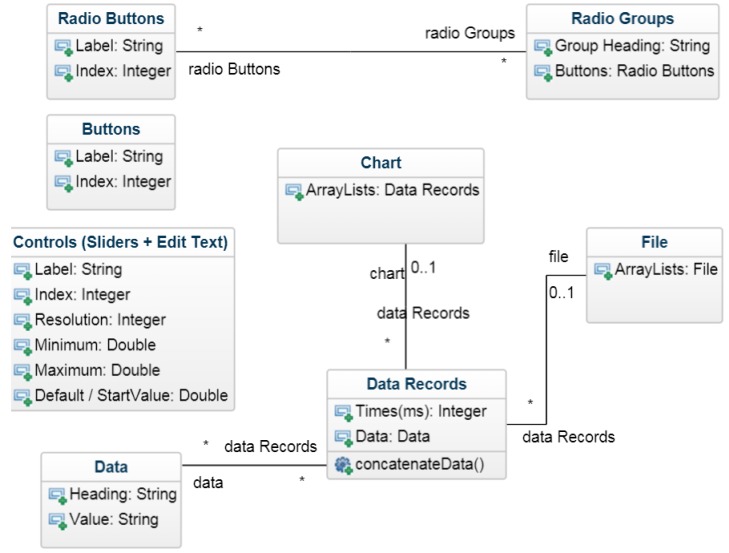
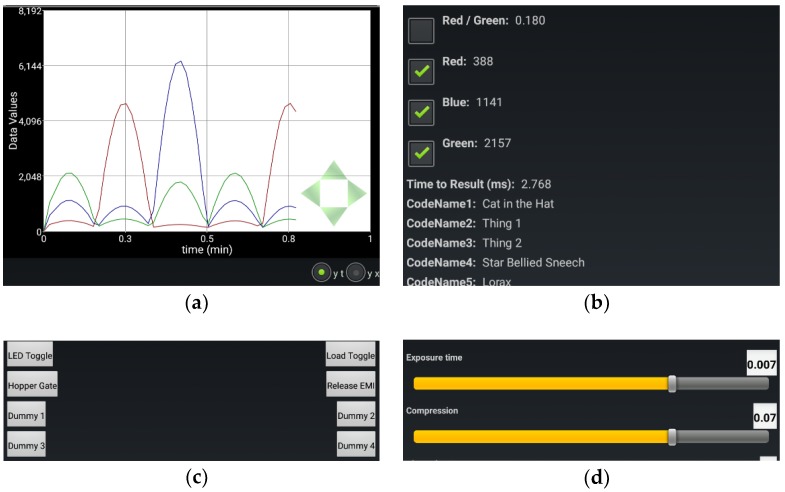
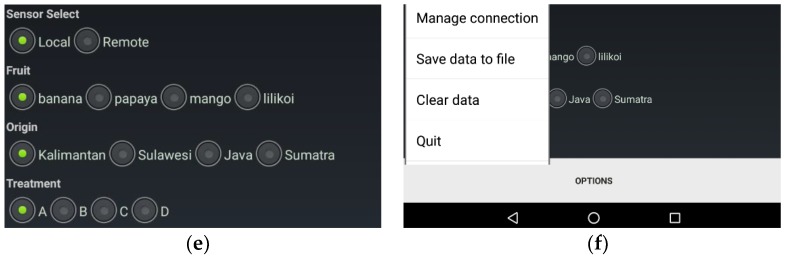
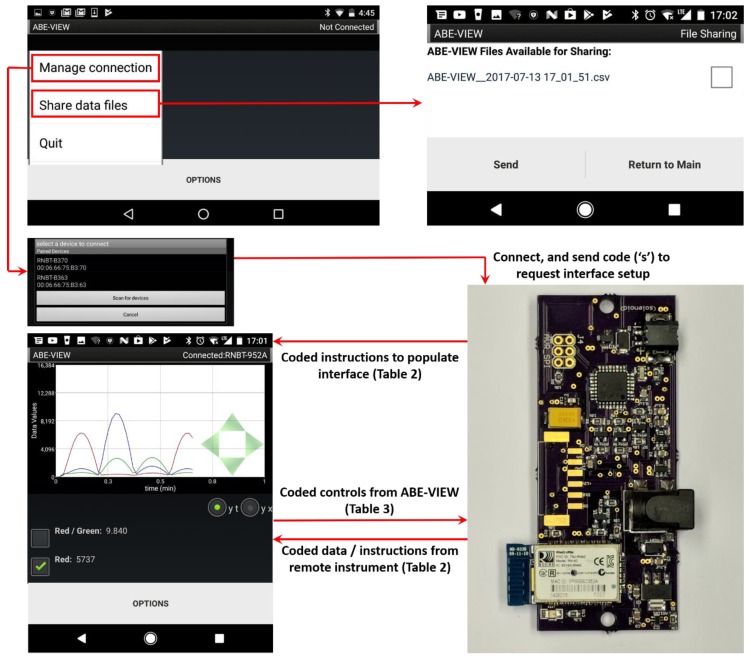
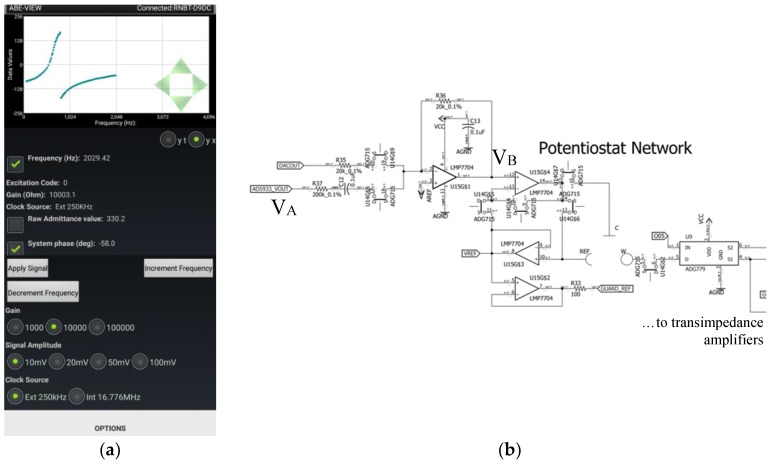
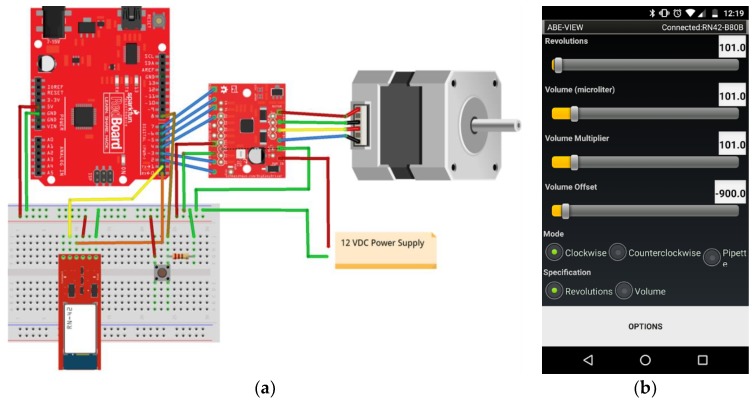
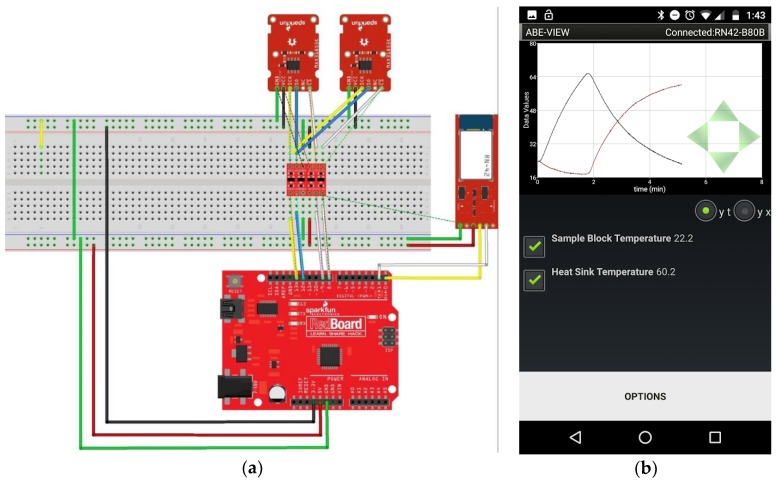
Advances in scientific knowledge are increasingly supported by a growing community of developers freely sharing new hardware and software tools. In this spirit we have developed a free Android app, ABE-VIEW, that provides a flexible graphical user interface (GUI) populated entirely from a remote instrument by ascii-coded instructions communicated wirelessly over Bluetooth. Options include an interactive chart for plotting data in real time, up to 16 data fields, and virtual controls including buttons, numerical controls with user-defined range and resolution, and radio buttons which the user can use to send coded instructions back to the instrument. Data can be recorded into comma delimited files interactively at the user's discretion. Our original objective of the project was to make data acquisition and control for undergraduate engineering labs more modular and affordable, but we have also found that the tool is highly useful for rapidly testing novel sensor systems for iterative improvement. Here we document the operation of the app and syntax for communicating with it. We also illustrate its application in undergraduate engineering labs on dynamic systems modeling, as well as for identifying the source of harmonic distortion affecting electrochemical impedance measurements at certain frequencies in a novel wireless potentiostat.

Keywords: Arduino; Bluetooth; graphical user interface; open-source design; potentiostat; rapid prototyping; test equipment; virtual instrumentation.


Conflict of interest statement

The authors declare no conflict of interest.

Figures

Figure 1
Figure 1
Class Diagram for ABE-VIEW app illustrating the attributes of various elements of the GUI, as well as the relationship between data communicated to the app and data records that are plotted on an optional chart or saved as a comma delimited file.
Figure 2
Figure 2
Illustration of ABE-VIEW graphical interface with customizable elements including: (a) interactive chart; (b) up to 16 data fields with text headings; (c) up to 8 buttons; (d) up to 8 numerical controls with customizable range and resolution; (e) up to 4 radio groups with up to 4 radio buttons each, and; (f) options menu while connected to remote instrument. All elements between the chart and options button are contained in a scrollview to ensure they are all accessible to the user.
Figure 2
Figure 2
Illustration of ABE-VIEW graphical interface with customizable elements including: (a) interactive chart; (b) up to 16 data fields with text headings; (c) up to 8 buttons; (d) up to 8 numerical controls with customizable range and resolution; (e) up to 4 radio groups with up to 4 radio buttons each, and; (f) options menu while connected to remote instrument. All elements between the chart and options button are contained in a scrollview to ensure they are all accessible to the user.
Figure 3
Figure 3
Flowchart for (Bluetooth) communications between ABE-VIEW and remote instrument/device. Upon making a Bluetooth connection with the remote device, ABE-VIEW sends a code ‘s’ that prompts the latter to return coded instructions to populate the interface. Thereafter, user interactions with the GUI result in coded instructions sent to the remote device, and coded data from the remote device are displayed by the app.
Figure 4
Figure 4
(a) Implementation of ABE-VIEW to set the frequency and amplitude of (b) the control signal to custom potentiostat network. The control voltage (VB) into the potentiostat network is composed of a weighted sum and inversion of the voltage from a digital synthesizer (VA) of a network analyzer chip (Analog Devices AD5933) with AC coupling, and a low pass filtered digital to analog converter voltage to apply arbitrary DC bias. This enables the device to perform any basic potentiometric or amperometric method in 2 or 3 electrode configuration, as well as electrochemical impedance analysis with arbitrary bias.
Figure 5
Figure 5
(a) Motion control system assembled by students using off-the-shelf components (Sparkfun RedBoard, BlueSMiRF Silver, Big Easy Motor Driver, and 12 V bipolar 200 steps/rev stepper motor), and (b) student populated ABE-VIEW interface to control the system to operate the motor to drive a custom pipette/syringe pump.
Figure 6
Figure 6
(a) Data acquisition system assembled by students using off the shelf components (Sparkfun RedBoard, BlueSMiRF Silver, 2 MAX31855 thermocouple breakout boards with type K thermocouple, and bi-directional logic level converter) to record the dynamic performance of a thermal cycler with a student designed heat sink, and; (b) student populated ABE-VIEW interface for data acquisition.
Figure 7
Figure 7
Recorded signals from digital synthesizer of network analyzer (VA) and output of summing junction (VB) for potentiostat operating to deliver 10 mVpeak at (a) 76.29 Hz; (b) 747.7 Hz, and; (c) 7507 Hz, with network analyzer running on 250 kHz external clock. The control signal VB consistently exhibits a few more mV of random noise, but large additional harmonic distortions near 750 Hz result in HH (d) very significant errors in admittance and system phase of a resistor as predicted by the network analyzer. Note that the synthesizer output VA is inverted and divided by 10 to scale with the predicted value of control signal VB, and the frequency at which the phase accumulator is updated for the synthesizer (62.5 kHz) is easily observable in the 7507 Hz signal (c).

Similar articles

References

    1. Dryden M.D.M., Fobel R., Fobel C., Wheeler A.R. Upon the Shoulders of Giants: Open-Source Hardware and Software in Analytical Chemistry. Anal. Chem. 2017;89:4330–4338. doi: 10.1021/acs.analchem.7b00485. - DOI - PubMed
    1. Rueden C.T., Schindelin J., Hiner M.C., DeZonia B.E., Walter A.E., Arena E.T., Eliceiri K.W. ImageJ2: ImageJ for the next generation of scientific image data. BMC Bioinform. 2017;18:529. doi: 10.1186/s12859-017-1934-z. - DOI - PMC - PubMed
    1. Zhu X., Wolfgruber T.K., Tasato A., Arisdakessian C., Garmire D.G., Garmire L.X. Granatum: A graphical single-cell RNA-Seq analysis pipeline for genomics scientists. Genome Med. 2017;9:108. doi: 10.1186/s13073-017-0492-3. - DOI - PMC - PubMed
    1. Zhang B., Dai J., Zhang T. NeoAnalysis: A Python-based toolbox for quick electrophysiological data processing and analysis. Biomed. Eng. Online. 2017;16:129. doi: 10.1186/s12938-017-0419-7. - DOI - PMC - PubMed
    1. Mejías A., Herrera R., Márquez M., Calderón A., González I., Andújar J. Easy Handling of Sensors and Actuators over TCP/IP Networks by Open Source Hardware/Software. Sensors. 2017;17:94. doi: 10.3390/s17010094. - DOI - PMC - PubMed

LinkOut - more resources