

Potent HIV-1-Specific CD8 T Cell Responses Induced in Mice after Priming with a Multiepitopic DNA-TMEP and Boosting with the HIV Vaccine MVA-B
- PMID: 30104537
- PMCID: PMC6116222
- DOI: 10.3390/v10080424
Potent HIV-1-Specific CD8 T Cell Responses Induced in Mice after Priming with a Multiepitopic DNA-TMEP and Boosting with the HIV Vaccine MVA-B
Abstract
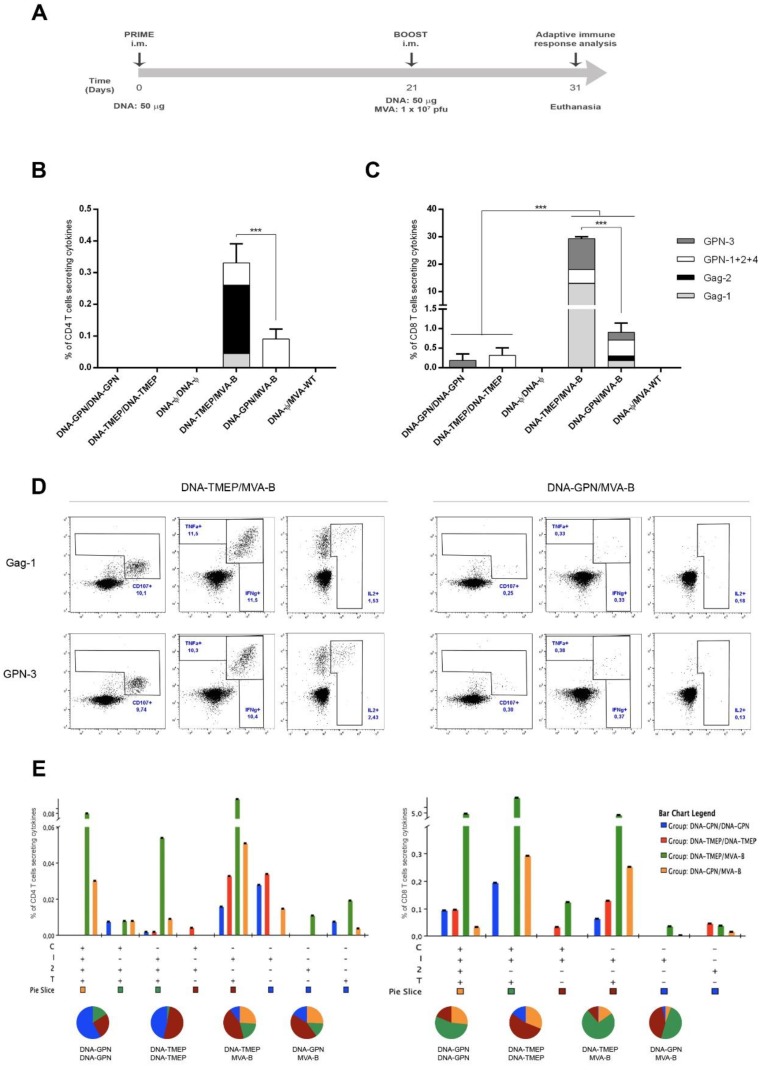
An effective vaccine against Human Immunodeficiency Virus (HIV) still remains the best solution to provide a sustainable control and/or eradication of the virus. We have previously generated the HIV-1 vaccine modified vaccinia virus Ankara (MVA)-B, which exhibited good immunogenicity profile in phase I prophylactic and therapeutic clinical trials, but was unable to prevent viral rebound after antiretroviral (ART) removal. To potentiate the immunogenicity of MVA-B, here we described the design and immune responses elicited in mice by a new T cell multi-epitopic B (TMEP-B) immunogen, vectored by DNA, when administered in homologous or heterologous prime/boost regimens in combination with MVA-B. The TMEP-B protein contained conserved regions from Gag, Pol, and Nef proteins including multiple CD4 and CD8 T cell epitopes functionally associated with HIV control. Heterologous DNA-TMEP/MVA-B regimen induced higher HIV-1-specific CD8 T cell responses with broader epitope recognition and higher polyfunctional profile than the homologous DNA-TMEP/DNA-TMEP or the heterologous DNA-GPN/MVA-B combinations. Moreover, higher HIV-1-specific CD4 and Tfh immune responses were also detected using this regimen. After MVA-B boost, the magnitude of the anti-VACV CD8 T cell response was significantly compromised in DNA-TMEP-primed animals. Our results revealed the immunological potential of DNA-TMEP prime/MVA-B boost regimen and supported the application of these combined vectors in HIV-1 prevention and/or therapy.
Keywords: HIV-1; MVA; immunogenicity; multiepitopic vaccine.
Conflict of interest statement
The authors declare no conflict of interest.
Figures


Similar articles
-
A Novel MVA-Based HIV Vaccine Candidate (MVA-gp145-GPN) Co-Expressing Clade C Membrane-Bound Trimeric gp145 Env and Gag-Induced Virus-Like Particles (VLPs) Triggered Broad and Multifunctional HIV-1-Specific T Cell and Antibody Responses.Viruses. 2019 Feb 16;11(2):160. doi: 10.3390/v11020160. Viruses. 2019. PMID: 30781504 Free PMC article.
-
Induction of Broad and Polyfunctional HIV-1-Specific T Cell Responses by the Multiepitopic Protein TMEP-B Vectored by MVA Virus.Vaccines (Basel). 2019 Jun 29;7(3):57. doi: 10.3390/vaccines7030057. Vaccines (Basel). 2019. PMID: 31261918 Free PMC article.
-
HIV-1 gp120 and Modified Vaccinia Virus Ankara (MVA) gp140 Boost Immunogens Increase Immunogenicity of a DNA/MVA HIV-1 Vaccine.J Virol. 2017 Nov 30;91(24):e01077-17. doi: 10.1128/JVI.01077-17. Print 2017 Dec 15. J Virol. 2017. PMID: 29021394 Free PMC article.
-
Multiple Approaches for Increasing the Immunogenicity of an Epitope-Based Anti-HIV Vaccine.AIDS Res Hum Retroviruses. 2015 Nov;31(11):1077-88. doi: 10.1089/AID.2015.0101. Epub 2015 Aug 13. AIDS Res Hum Retroviruses. 2015. PMID: 26149745 Review.
-
Immunogenicity and efficacy of DNA/MVA HIV vaccines in rhesus macaque models.Expert Rev Vaccines. 2017 Oct;16(10):973-985. doi: 10.1080/14760584.2017.1371594. Epub 2017 Sep 4. Expert Rev Vaccines. 2017. PMID: 28838267 Free PMC article. Review.
Cited by
-
A Novel MVA-Based HIV Vaccine Candidate (MVA-gp145-GPN) Co-Expressing Clade C Membrane-Bound Trimeric gp145 Env and Gag-Induced Virus-Like Particles (VLPs) Triggered Broad and Multifunctional HIV-1-Specific T Cell and Antibody Responses.Viruses. 2019 Feb 16;11(2):160. doi: 10.3390/v11020160. Viruses. 2019. PMID: 30781504 Free PMC article.
-
The combined vaccination protocol of DNA/MVA expressing Zika virus structural proteins as efficient inducer of T and B cell immune responses.Emerg Microbes Infect. 2021 Dec;10(1):1441-1456. doi: 10.1080/22221751.2021.1951624. Emerg Microbes Infect. 2021. PMID: 34213405 Free PMC article.
-
In the Era of mRNA Vaccines, Is There Any Hope for HIV Functional Cure?Viruses. 2021 Mar 18;13(3):501. doi: 10.3390/v13030501. Viruses. 2021. PMID: 33803790 Free PMC article. Review.
-
Induction of Broad and Polyfunctional HIV-1-Specific T Cell Responses by the Multiepitopic Protein TMEP-B Vectored by MVA Virus.Vaccines (Basel). 2019 Jun 29;7(3):57. doi: 10.3390/vaccines7030057. Vaccines (Basel). 2019. PMID: 31261918 Free PMC article.
-
Deletion of Vaccinia Virus A40R Gene Improves the Immunogenicity of the HIV-1 Vaccine Candidate MVA-B.Vaccines (Basel). 2020 Feb 6;8(1):70. doi: 10.3390/vaccines8010070. Vaccines (Basel). 2020. PMID: 32041218 Free PMC article.
References
-
- Garcia F., Bernaldo de Quiros J.C., Gomez C.E., Perdiguero B., Najera J.L., Jimenez V., Garcia-Arriaza J., Guardo A.C., Perez I., Diaz-Brito V., et al. Safety and immunogenicity of a modified pox vector-based HIV/AIDS vaccine candidate expressing Env, Gag, Pol and Nef proteins of HIV-1 subtype B (MVA-B) in healthy HIV-1-uninfected volunteers: A phase I clinical trial (RISVAC02) Vaccine. 2011;29:8309–8316. doi: 10.1016/j.vaccine.2011.08.098. - DOI - PubMed
-
- Gomez C.E., Najera J.L., Perdiguero B., Garcia-Arriaza J., Sorzano C.O., Jimenez V., Gonzalez-Sanz R., Jimenez J.L., Munoz-Fernandez M.A., Lopez Bernaldo de Quiros J.C., et al. The HIV/AIDS vaccine candidate MVA-B administered as a single immunogen in humans triggers robust, polyfunctional, and selective effector memory T cell responses to HIV-1 antigens. J. Virol. 2011;85:11468–11478. doi: 10.1128/JVI.05165-11. - DOI - PMC - PubMed
-
- Guardo A.C., Gomez C.E., Diaz-Brito V., Pich J., Arnaiz J.A., Perdiguero B., Garcia-Arriaza J., Gonzalez N., Sorzano C.O.S., Jimenez L., et al. Safety and vaccine-induced HIV-1 immune responses in healthy volunteers following a late MVA-B boost 4 years after the last immunization. PLoS ONE. 2017;12:e0186602. doi: 10.1371/journal.pone.0186602. - DOI - PMC - PubMed
-
- Gomez C.E., Perdiguero B., Garcia-Arriaza J., Cepeda V., Sanchez-Sorzano C.O., Mothe B., Jimenez J.L., Munoz-Fernandez M.A., Gatell J.M., Lopez Bernaldo de Quiros J.C., et al. A phase I randomized therapeutic MVA-B vaccination improves the magnitude and quality of the T cell immune responses in HIV-1-infected subjects on HAART. PLoS ONE. 2015;10:e0141456. doi: 10.1371/journal.pone.0141456. - DOI - PMC - PubMed
-
- Mothe B., Climent N., Plana M., Rosas M., Jimenez J.L., Munoz-Fernandez M.A., Puertas M.C., Carrillo J., Gonzalez N., Leon A., et al. Safety and immunogenicity of a modified vaccinia Ankara-based HIV-1 vaccine (MVA-B) in HIV-1-infected patients alone or in combination with a drug to reactivate latent HIV-1. J. Antimicrob. Chemother. 2015;70:1833–1842. doi: 10.1093/jac/dkv046. - DOI - PubMed
Publication types
MeSH terms
Substances
LinkOut - more resources
Full Text Sources
Other Literature Sources
Medical
Research Materials
