. 2018 Aug 13;9(1):3238.
doi: 10.1038/s41467-018-05733-0.

Visual and modular detection of pathogen nucleic acids with enzyme-DNA molecular complexes

Affiliations

Visual and modular detection of pathogen nucleic acids with enzyme-DNA molecular complexes

Nicholas R Y Ho et al. Nat Commun. .

Abstract

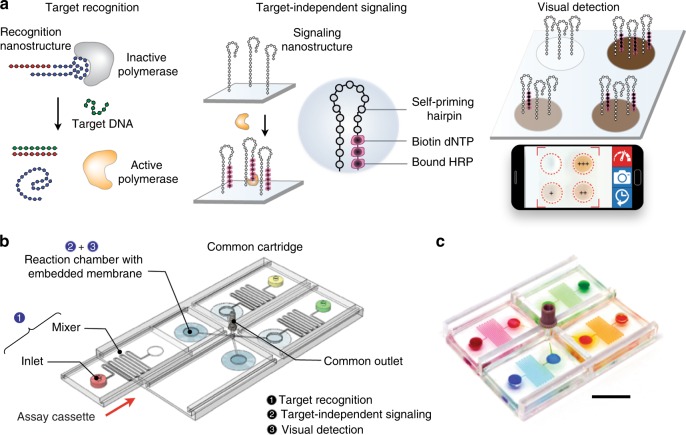
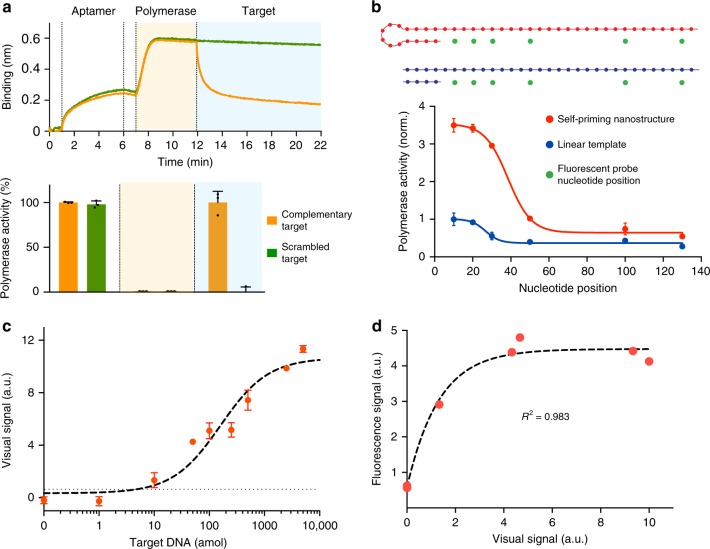
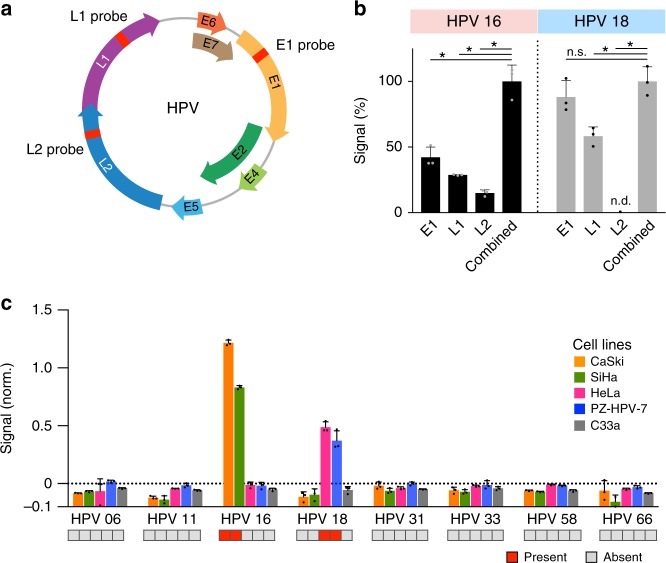
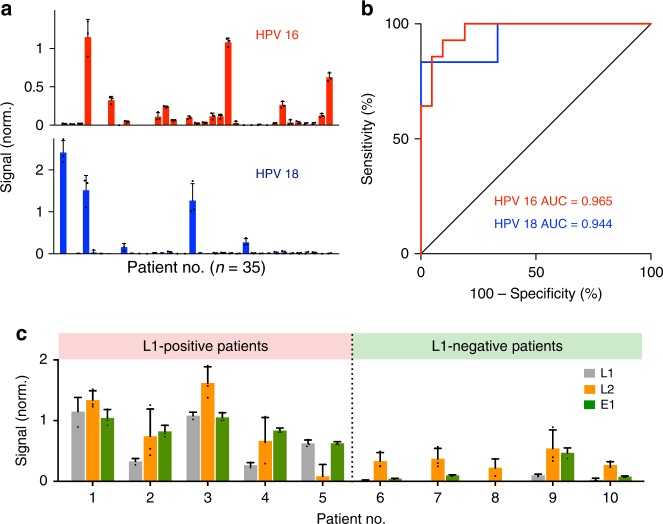
Rapid, visual detection of pathogen nucleic acids has broad applications in infection management. Here we present a modular detection platform, termed enzyme-assisted nanocomplexes for visual identification of nucleic acids (enVision). The system consists of an integrated circuit of enzyme-DNA nanostructures, which function as independent recognition and signaling elements, for direct and versatile detection of pathogen nucleic acids from infected cells. The built-in enzymatic cascades produce a rapid color readout for the naked eye; the assay is thus fast (<2 h), sensitive (<10 amol), and readily quantified with smartphones. When implemented on a configurable microfluidic platform, the technology demonstrates superior programmability to perform versatile computations, for detecting diverse pathogen targets and their virus-host genome integration loci. We further design the enVision platform for molecular-typing of infections in patient endocervical samples. The technology not only improves the clinical inter-subtype differentiation, but also expands the intra-subtype coverage to identify previously undetectable infections.


Conflict of interest statement

The authors declare no competing interests.

Figures

Fig. 1
Fig. 1
Visual and modular detection of pathogen nucleic acids. a The enVision system consists of a series of enzyme–DNA nanostructures to enable target recognition, target-independent signaling, and visual detection. The nanostructures are designed to decouple recognition from signaling. The recognition nanostructure is a hybrid complex, composed of an inactivating aptamer and a Taq DNA polymerase. In the presence of complementary target DNA, the complex dissociates to activate the polymerase activity. The active polymerase proceeds to elongate a universal, self-priming signaling nanostructure, in a target-independent manner. Modified deoxynucleotides (dNTPs) are incorporated to immobilize horseradish peroxidase (HRP) onto the signaling nanostructures. Upon the addition of optical substrate, visual signals can be enzymatically enhanced, detected by the naked eye and quantified with a smartphone camera. Photograph (inset) shows an example of the actual visual readouts in the presence of none (−) and varying (+) amounts of target DNA on a smartphone application. b Schematic of the enVision microfluidic system. The platform is designed to complement the modular enVision workflow. Independent assay cassettes, preloaded with specific recognition nanostructures at the inlets, can be mounted on-demand onto a common signaling cartridge. The common cartridge houses the universal signaling nanostructures, which are immobilized on embedded membranes, for target-independent signaling and visual detection. Direction of cassette sliding is indicated by a red arrow. c Photograph of the microfluidic enVision prototype, developed for versatile assay integration and parallel processing. Scale bar indicates 1 cm
Fig. 2
Fig. 2
Nucleic acid quantification with enVision. a Recognition nanostructure assembly and activity. The recognition nanostructure was assembled and incubated with complementary or scrambled target DNA sequences, to determine the resultant polymerase association and activity. (Top) Real-time sensorgram of molecular binding. We performed a series of operations, namely aptamer immobilization, addition of polymerase, and incubation with target DNA sequences. Molecular binding was monitored in situ through bio-layer interferometry to determine polymerase association. (Bottom) The corresponding polymerase activity was determined at the end of each operation via a parallel experiment using a Taqman assay (fluorescence measurement of 5′ exonuclease degradation of Taqman probes). Note the complete recovery of polymerase activity upon incubating with complementary target DNA. b Signaling nanostructure activity. In a comparative experiment, the self-priming signaling nanostructure and its similarly-sized linear template were treated with equal concentration of active DNA polymerase. The polymerase activity was determined at different nucleotide positions away from the starting primed sites, through 5′ exonuclease degradation of differentially placed Taqman probes (positions indicated as green dots). c Detection sensitivity of the enVision system. The detection limit (dotted line) was determined by titrating a known amount of target DNA and measuring their associated visual signals. All visual signals were acquired through a smartphone. d Correlation between the enVision and fluorescence measurements on varying quantities of target DNA. The visual signal matched well with the fluorescence signal (R2 = 0.9828) and demonstrated a wider dynamic range. All measurements were performed in triplicate, and the data are displayed as mean ± s.d. a.u. arbitrary unit
Fig. 3
Fig. 3
Programmability of enVision. a Schematic of the programmable recognition nanostructure. The hybrid structure consists of a conserved sequence region, that binds to inactivate DNA polymerase (pol), and a variable region (duplex and overhang segments) that can be made complementary to target DNA. Not drawn to scale. b Effects of target mismatches in the variable region. Synthetic DNA targets, designed to have varying numbers of mismatches against the variable region, were incubated with the recognition nanostructure. All signals were normalized against that of the complementary DNA target (0 mismatch). Mismatches against the duplex region produced significantly lower signals (*P < 0.05, ** P < 0.005, ***P < 0.0005, n.s. not significant, Student’s t test). c Pan-HPV recognition. Two pan-HPV recognition nanostructures were developed according to the HPV consensus genome, to harbor different numbers of mismatches against DNA targets obtained from six HPV subtypes. All mismatches were mapped to the duplex and overhang regions. Nanostructure 1, that accommodated more mismatches in the overhang region, demonstrated better pan-recognition capability. All signals were normalized against that of the complementary DNA target (positive). d Comparison of enVision and qPCR measurements for specific HPV subtyping. At a cutoff for 100% sensitivity, enVision had 100% specificity (56/56) while SYBR Green-based qPCR had 92.9% specificity (52/56). Specific nanostructures were designed according to a highly variable region of the HPV genome with sequence variations contained within the sensitive duplex region. DNA targets from different HPV subtypes were measured via color intensity through the enVision smartphone platform (left) and cycle counts through the SYBR-Green qPCR system (right). All signals were acquired relative to appropriate controls (i.e., water as a no-template control). Signals from respective detection systems were globally presented in the form of heat maps for comparisons of assay performance. All measurements were performed in triplicate, and the data are displayed as mean ± s.d. in b and c
Fig. 4
Fig. 4
Multiplexed enVision for multi-loci coverage. a New probe loci in HPV genome map. The HPV genome is made up of seven early expressed (E) genes and two capsid protein (L) genes. New nanostructure recognition probes were designed for each HPV subtype to identify the E1, L1, and L2 loci, respectively. b Multiplexed enVision assays for high-coverage, multi-loci detection. Genomic DNA obtained from CaSki cells (left, HPV 16-positive) and HeLa cells (right, HPV 18-positive) were incubated directly with individual recognition probes (E1, L1, and L2, respectively) or a pool of three probes (combined) to determine the cellular HPV infection status. The combined probes showed significantly higher signals as compared to any of the individualized assays (*P < 0.0005, n.s. not significant, Student’s t test; n.d. not detected). All signals were normalized as a percentage to their respective combined signals. c HPV subtyping in cell lines. Genomic DNA from cell lines were profiled directly using the multiplexed enVision assays for different HPV subtypes. The measurements correlated well with the known HPV infections of the cell lines, as reported by previous literatures (red: present, gray: absent). All measurements were performed in triplicate, and the data are displayed as mean ± s.d
Fig. 5
Fig. 5
Molecular profiling of patient samples. a HPV 16 and HPV 18 signals were measured from clinical endocervical brush samples (n = 35). The L1-specific signals are shown for comparison with the clinical gold standard. See Supplementary Fig. 14 for multi-loci measurements on all clinical specimens. b Receiver operator characteristic (ROC) curves of the HPV 16 and HPV 18 L1 locus assays were used to determine the detection accuracies. HPV 16 assay showed 92.9% sensitivity (13/14) and 90.5% specificity (19/21) and HPV 18 assay showed 83.3% sensitivity (5/6) and 100% specificity (29/29) at the Youden’s index cutoff. c Locus-specific HPV 16 enVision assays (L1, L2, and E1 locus assays) were performed in all patients. Representative examples from L1-positive (left) and L1-negative (right) patients are shown. Note that in the subset of L1-negative patients, the inclusion of L2 and E1 locus assays could improve the detection coverage to identify previously undetectable infections. This was further validated through independent Taqman fluorescence analysis, which showed a high concordance with the enVision results in all tested clinical specimens (see Supplementary Fig. 15). All measurements were performed in triplicate, and the data are displayed as mean ± s.d. AUC, area under the curve

Similar articles

Cited by

References

    1. Niemz A, Ferguson TM, Boyle DS. Point-of-care nucleic acid testing for infectious diseases. Trends Biotechnol. 2011;29:240–250. doi: 10.1016/j.tibtech.2011.01.007. - DOI - PMC - PubMed
    1. Nong RY, Gu J, Darmanis S, Kamali-Moghaddam M, Landegren U. DNA-assisted protein detection technologies. Expert. Rev. Proteom. 2012;9:21–32. doi: 10.1586/epr.11.78. - DOI - PubMed
    1. Zumla A, et al. Rapid point of care diagnostic tests for viral and bacterial respiratory tract infections–needs, advances, and future prospects. Lancet Infect. Dis. 2014;14:1123–1135. doi: 10.1016/S1473-3099(14)70827-8. - DOI - PMC - PubMed
    1. Crosbie EJ, Einstein MH, Franceschi S, Kitchener HC. Human papillomavirus and cervical cancer. Lancet. 2013;382:889–899. doi: 10.1016/S0140-6736(13)60022-7. - DOI - PubMed
    1. Bouvard V, et al. A review of human carcinogens–Part B: biological agents. Lancet Oncol. 2009;10:321–322. doi: 10.1016/S1470-2045(09)70096-8. - DOI - PubMed

Publication types