. 2018 Aug 13;8(1):12077.
doi: 10.1038/s41598-018-30544-0.

Determining Relative Dynamic Stability of Cell States Using Boolean Network Model

Affiliations

Determining Relative Dynamic Stability of Cell States Using Boolean Network Model

Jae Il Joo et al. Sci Rep. .

Abstract

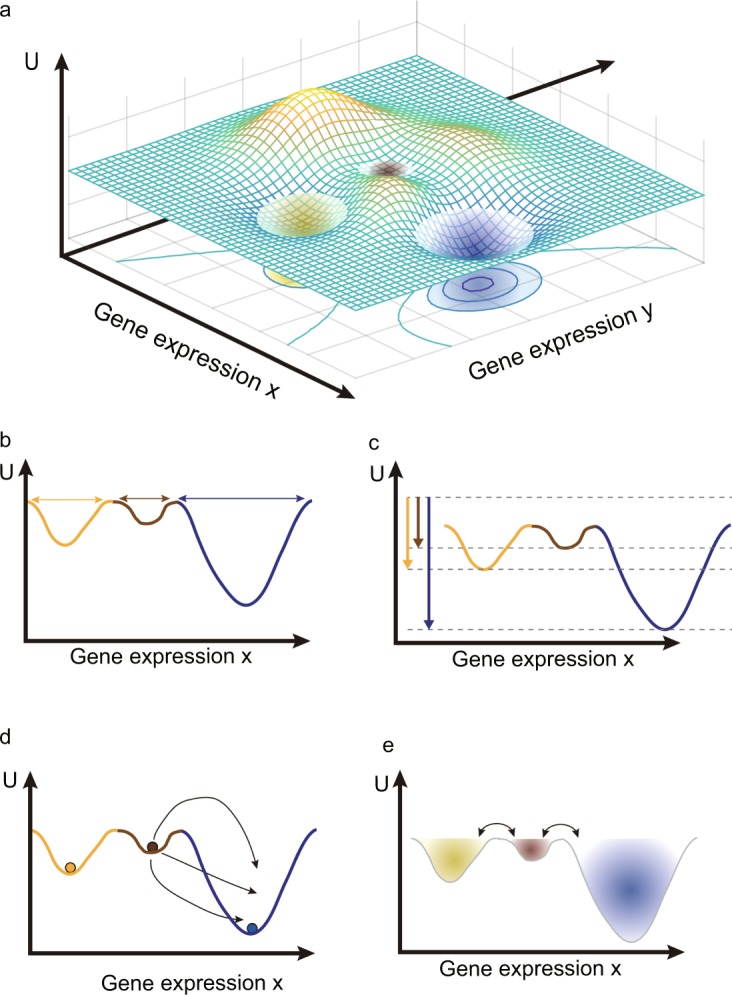
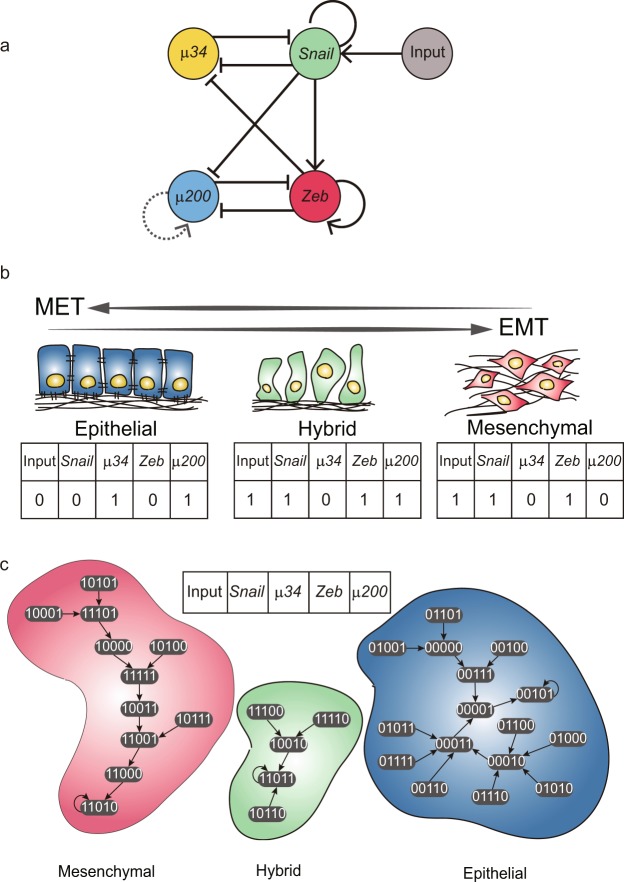
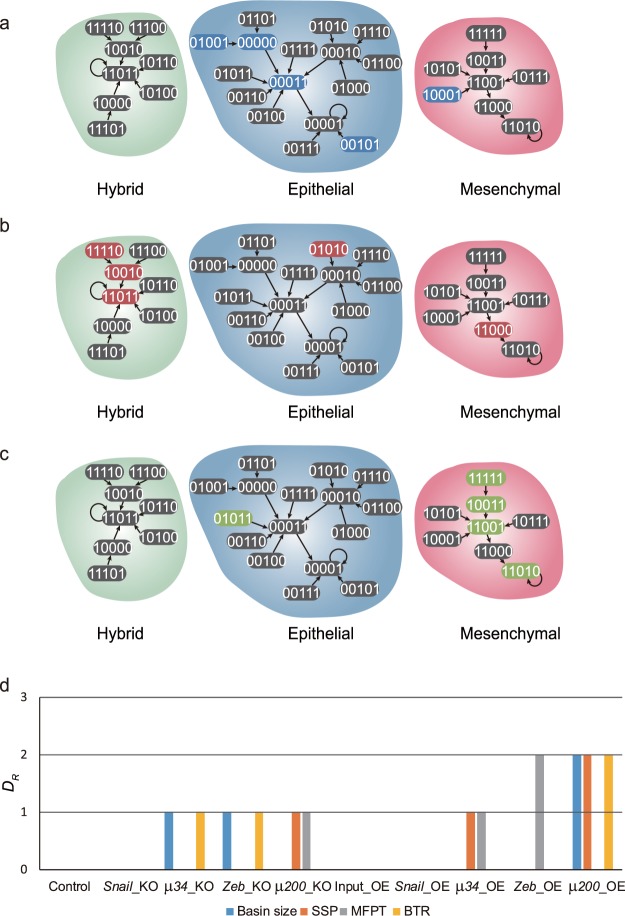
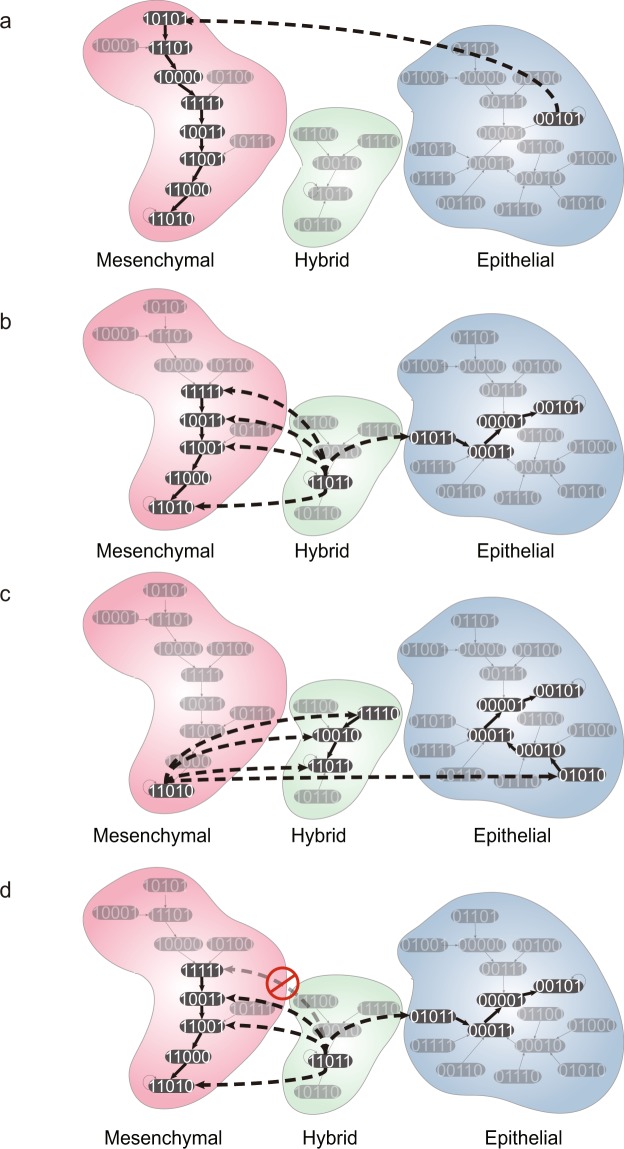
Cell state transition is at the core of biological processes in metazoan, which includes cell differentiation, epithelial-to-mesenchymal transition (EMT) and cell reprogramming. In these cases, it is important to understand the molecular mechanism of cellular stability and how the transitions happen between different cell states, which is controlled by a gene regulatory network (GRN) hard-wired in the genome. Here we use Boolean modeling of GRN to study the cell state transition of EMT and systematically compare four available methods to calculate the cellular stability of three cell states in EMT in both normal and genetically mutated cases. The results produced from four methods generally agree but do not totally agree with each other. We show that distribution of one-degree neighborhood of cell states, which are the nearest states by Hamming distance, causes the difference among the methods. From that, we propose a new method based on one-degree neighborhood, which is the simplest one and agrees with other methods to estimate the cellular stability in all scenarios of our EMT model. This new method will help the researchers in the field of cell differentiation and cell reprogramming to calculate cellular stability using Boolean model, and then rationally design their experimental protocols to manipulate the cell state transition.


Conflict of interest statement

The authors declare no competing interests.

Figures

Figure 1
Figure 1
The scheme of quasi-potential landscape and relative dynamic stability. (a) A three-dimensional quasi-potential landscape. A point of XY plane is corresponding to a gene expression state of cell and elevations of each point U(x, y) represent the quasi-potential. Three attractors are local minimums in the quasi-potential landscape. (be) are schematic descriptions of four different methods to calculate the relative dynamic stability of the attractors. For clarity, we used two-dimensional representation of the quasi-potential landscape. (b) The relative dynamic stability is defined by the basin size. (c) The dynamic stability is defined by the steady state probability distribution function. (d) The dynamic stability is defined by the mean first passage time. (e) The relative dynamic stability is defined by the basin transition rate.
Figure 2
Figure 2
The EMT Boolean network model and three cell attractors and attracting basins. (a) A network structure for the EMT model. The sharp arrows represent the activating regulations while the blunt arrows represent the repressing regulations between nodes. A dashed link is for a proposed regulation in this model. (b) The definitions of three cell attractors in Boolean state. (c) Transition map of the EMT Boolean model. Each ellipse represents one Boolean state of the model. Without internal and external perturbation, state changes of the EMT model follow arrows due to the Boolean functions. There are three cell attractors and each basin of them is distinguished by different colors: blue for epithelial cells, red for mesenchymal cells and green for hybrid cells.
Figure 3
Figure 3
The relative dynamic stability of the attractors in the EMT Boolean model computed by four different methods. (a) The basin size of three attracting basins. The basin size is a count of states (ellipses) having the same color with a cell attracting basin. Basin size of each attractor is represented by a ratio to the number of all possible states. (b) Steady state probability distribution functions Pss of three cell attractor states. The size of circle represents the steady state probability of each state. Non-attractor states have very small probabilities. (c) Mean first passage time between three cell attractor states. Width of an arrow is thicker as MFPT is shorter because the shorter is MFPT, the easier is the transition. (d) Basin transition rates between three cell attractor states. Contrary to MFPT, width of each arrow is thicker as BTR is higher.
Figure 4
Figure 4
The 1-degree neighbor distribution and the stability index for EMT Boolean network models with various mutations. (a–c) The 1-degree neighbor distribution graphs for three cell attractors of the μ34 KO model. 1-degree neighbors of each attractor A state are highlighted with the same color as the respective attractors A. (a) 1-degree neighbors of the epithelial cell attractor state (blue), (b) 1-degree neighbors of the mesenchymal cell attractor state (red), (c) 1-degree neighbors of the hybrid cell (green). (d) Differences between the stability index SA and other measures of relative dynamic stability. The value 0 of DR indicates that the stability index produces the same result with other measure R.
Figure 5
Figure 5
The Analysis of major transition trajectories between the three cell attractors of EMT Boolean model. The major transition trajectories from (a) epithelial cells, (b) hybrid cells and (c) mesenchymal cells to other cell state attractors. The dashed bold arrows represent the escaping transition driven by noise and the solid bold arrows represent the following sequential transitions due to execution of Boolean functions. (d) This example demonstrates that inhibition of one single node µ34 (third position in the state vector) is not sufficient to block the transition from hybrid to mesenchymal attractor.

Similar articles

Cited by

References

    1. Buganim Y, Faddah DA, Jaenisch R. Mechanisms and models of somatic cell reprogramming. Nat Rev Genet. 2013;14:427–439. doi: 10.1038/nrg3473. - DOI - PMC - PubMed
    1. Lamouille S, Xu J, Derynck R. Molecular mechanisms of epithelial-mesenchymal transition. Nat Rev Mol Cell Biol. 2014;15:178–196. doi: 10.1038/nrm3758. - DOI - PMC - PubMed
    1. Ladewig J, Koch P, Brustle O. Leveling Waddington: the emergence of direct programming and the loss of cell fate hierarchies. Nat Rev Mol Cell Biol. 2013;14:225–236. doi: 10.1038/nrm3543. - DOI - PubMed
    1. Brzezinski JA, Reh TA. Photoreceptor cell fate specification in vertebrates. Development. 2015;142:3263–3273. doi: 10.1242/dev.127043. - DOI - PMC - PubMed
    1. Osakada F, et al. Toward the generation of rod and cone photoreceptors from mouse, monkey and human embryonic stem cells. Nat Biotechnol. 2008;26:215–224. doi: 10.1038/nbt1384. - DOI - PubMed

Publication types

MeSH terms

LinkOut - more resources