. 2018 Aug 13;9(1):3220.
doi: 10.1038/s41467-018-05570-1.

Pan-cancer deconvolution of tumour composition using DNA methylation

Affiliations

Pan-cancer deconvolution of tumour composition using DNA methylation

Ankur Chakravarthy et al. Nat Commun. .

Erratum in

Abstract

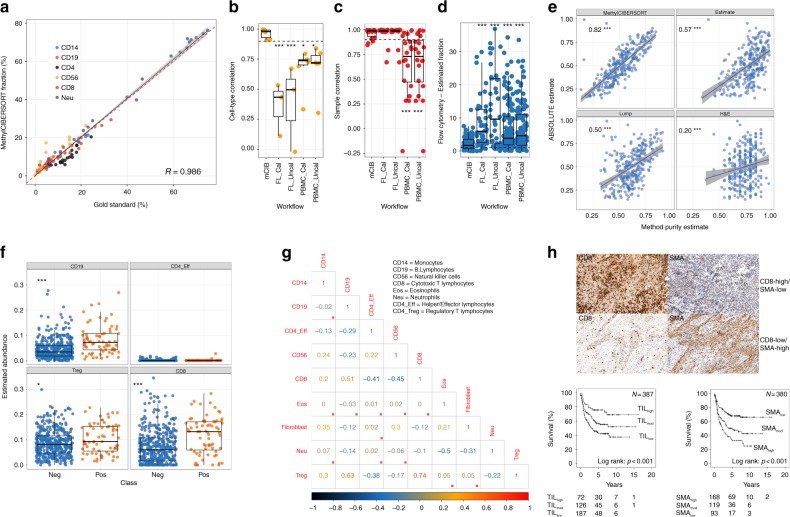
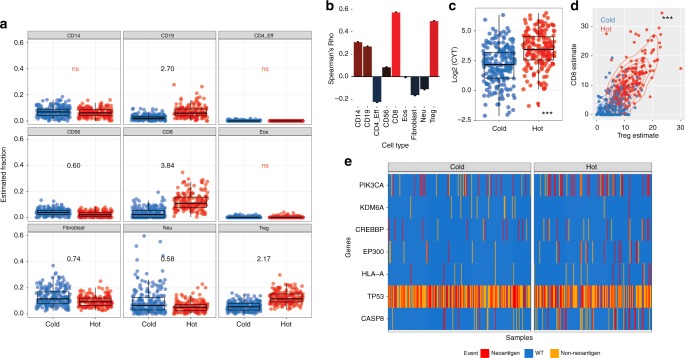
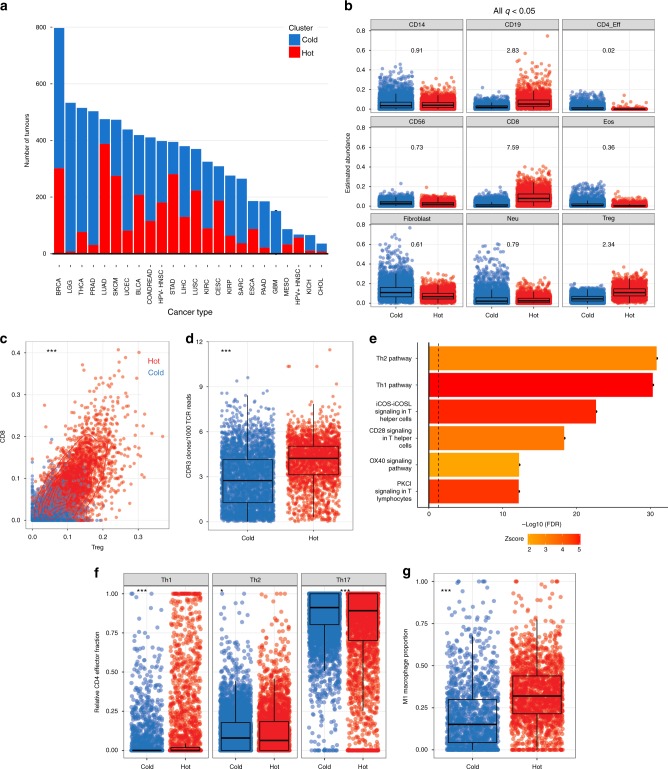
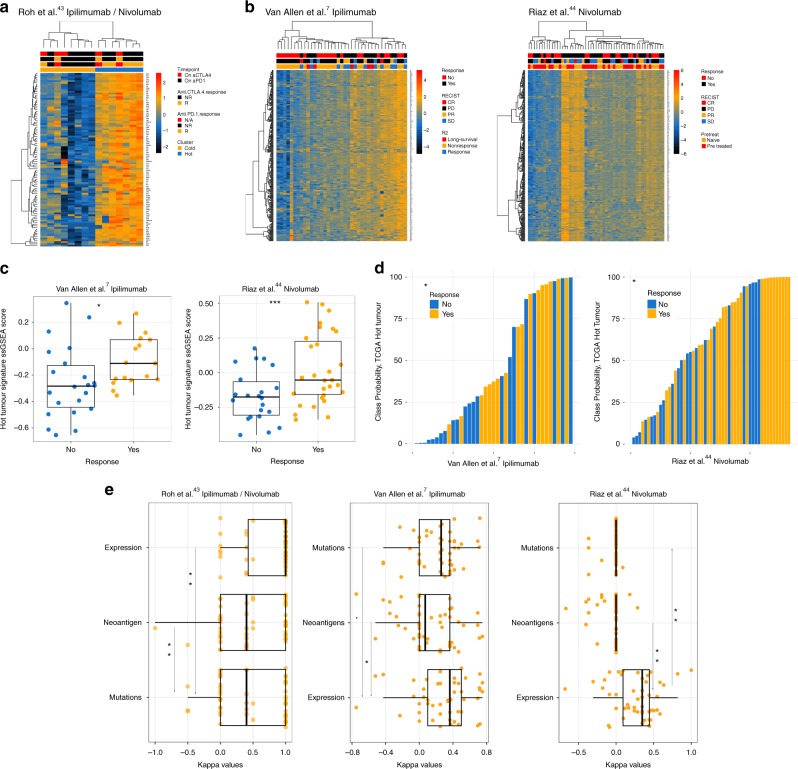
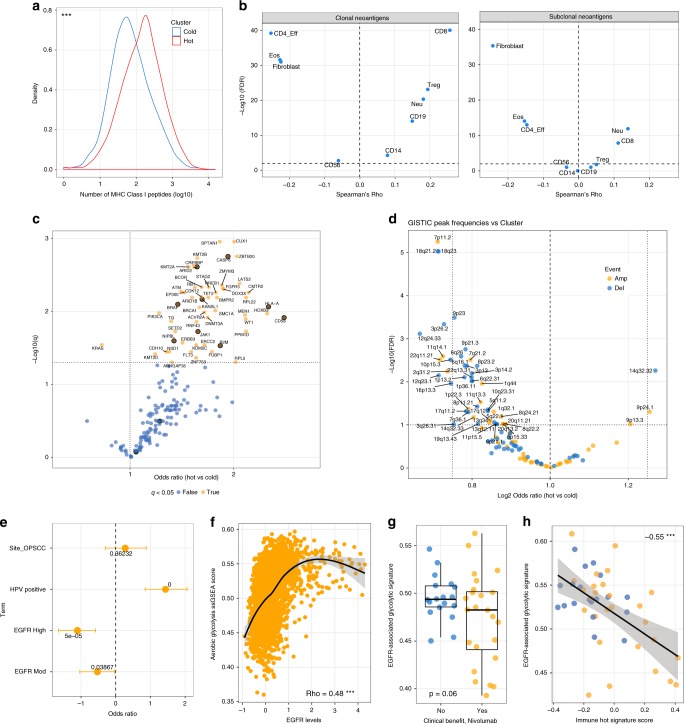
The nature and extent of immune cell infiltration into solid tumours are key determinants of therapeutic response. Here, using a DNA methylation-based approach to tumour cell fraction deconvolution, we report the integrated analysis of tumour composition and genomics across a wide spectrum of solid cancers. Initially studying head and neck squamous cell carcinoma, we identify two distinct tumour subgroups: 'immune hot' and 'immune cold', which display differing prognosis, mutation burden, cytokine signalling, cytolytic activity and oncogenic driver events. We demonstrate the existence of such tumour subgroups pan-cancer, link clonal-neoantigen burden to cytotoxic T-lymphocyte infiltration, and show that transcriptional signatures of hot tumours are selectively engaged in immunotherapy responders. We also find that treatment-naive hot tumours are markedly enriched for known immune-resistance genomic alterations, potentially explaining the heterogeneity of immunotherapy response and prognosis seen within this group. Finally, we define a catalogue of mediators of active antitumour immunity, deriving candidate biomarkers and potential targets for precision immunotherapy.


Conflict of interest statement

The authors declare no competing interests.

Figures

Fig. 1
Fig. 1
Validation of DNA methylation-based deconvolution for the analysis of tumour composition. a Correlation between MethylCIBERSORT fractions and flow cytometry for PBMC mixtures in independent data. bd Boxplots showing comparisons between MethylCIBERSORT and flow cytometry versus Expression-CIBERSORT and flow cytometry in mixtures of similar complexity for correlations by cell type, correlations within samples, and finally absolute error. e Spearman’s correlations between ABSOLUTE and MethylCIBERSORT versus other previously published purity estimation methods. f Validation of previously reported associations between CD8 T-cells and B-cells and HPV status by HPV status. g Correlation plot showing Spearman’s Rho between cell-types in HPV− HNSCC, red boxes indicate nonsignificance at q < 0.1. h IHC showing a representative image of CD8 and SMA and Kaplan–Meier curves confirming the prognostic impact of TILs and fibroblasts in HPV-negative HNSCC. In boxplots, the ends of the boxes and the middle line represent the lower and upper quartiles, and medians, respectively. Whiskers represent 1.5 times the interquartile range (IQR)
Fig. 2
Fig. 2
Classification of HNSCC into hot and cold subgroups on the basis of immune cell infiltration patterns. a Boxplot of cell-types based on clustering HNSCC. Relative abundance of each cell type in hot versus cold tumours is indicated as a fold-change on each plot for all significant differences (q > 0.05, Wilcoxon’s Rank Sum Test with BH correction for multiple testing) except where indicated (ns). b Bar-graph showing associations between cytolytic activity and cell types. c Cytolytic activity is elevated in immune-hot HNSCC. d CD8/Treg ratios by HNSCC immune cluster. e Mutations significantly associated with HNSCC immune cluster. In boxplots, the ends of the boxes and the middle line represent the lower and upper quartiles, and medians, respectively. Whiskers represent 1.5 times the interquartile range (IQR)
Fig. 3
Fig. 3
Identification and characterisation of hot and cold tumours pan-cancer. a Barplot of distribution of immune-hot and cold tumours across TCGA. Cancers known to respond favourably to checkpoint blockade, such as lung cancer and melanomas, show high fractions of hot tumours. b Boxplot of cell-type estimates by immune cluster. All at q < 0.05. Numbers represent mean fold changes. c CD8:Treg ratio is elevated in hot tumours pan-cancer. d Increased breadth of TCR sequences in immune hot tumours (Wilcoxon’s Rank Sum Tests). e Results of IPA canonical pathway analysis comparing hot and cold tumours pan-cancer after adjusting for tumour type. f Transcriptional deconvolution by expression-based CIBERSORT shows immune cluster (x-axis) is associated with distinct CD4 polarisation and g macrophage polarisation (CIBERSORT fractions on y-axis). p Values are from Wilcoxon’s Rank Sum Tests. In boxplots, the ends of the boxes and the middle line represent the lower and upper quartiles, and medians, respectively. Whiskers represent 1.5 times the interquartile range (IQR)
Fig. 4
Fig. 4
The immune-hot signature is associated with but not predictive of response to ICB in melanoma. a Heatmap showing expression of the hot-tumour transcriptional signature in Nanostring data from posttreatment biopsies of immunotherapy patients. b Heatmaps showing the same signature in RNAseq data of aCTLA4 (pre-treatment) and aPD1 (post-treatment), respectively. c Boxplots highlighting significant differences in ssGSEA scores for the hot-tumour transcriptional signature in the datasets featured in b (p values from logistic regression). d Barplots display similarity to TCGA hot and cold tumours based on logistic regression class probabilities from a model fit to TCGA data, which are associated with response. e Boxplots showing Kappa values from cross-validation for models examining the performance of the Immune-hot signature, Class I neoepitope burden, and finally mutational load on immunotherapy response classification (p values from Wilcoxon’s Rank Sum Test). In boxplots, the ends of the boxes and the middle line represent the lower and upper quartiles, and medians, respectively. Whiskers represent 1.5 times the interquartile range (IQR)
Fig. 5
Fig. 5
Genomic features of hot and cold tumours. a Density plots showing differences in neoantigen burden by immune cluster pan-cancer. p Value from negative binomial regression that accounts for tumour type. b Clonal neoantigens and subclonal neoantigens are correlated with different infiltration profiles. Volcanoplot shows Spearman’s Rho on the x-axis and −log10(FDR) on the y-axis. c Volcanoplot showing results of binomial regression testing for associations between immune-hot cancers and mutation frequencies in candidate cancer driver genes. Those genes implicated in resistance to T-cell-mediated killing (OR = 11.75, p < 0.0004, Fisher’s Exact Test, see Results text for details) are highlighted in orange. d Volcanoplot showing associations between GISTIC candidate driver copy number peaks and immune cluster. e Plot showing results of logistic regression in a cohort of HNSCCs where the probability of being classified TIL-high was regressed against anatomic subsite, EGFR IHC (low/moderate/high) and HPV status. f Correlation between glycolytic coexpression signature ssGSEA scores and EGFR levels by RPPA. g Association of glycolytic signature post-Nivolumab with response and h inverse correlation between the glycolytic signature and the immune-hot expression signature, Spearman’s correlation has been plotted. In boxplots, the ends of the boxes and the middle line represent the lower and upper quartiles, and medians, respectively. Whiskers represent 1.5 times the interquartile range (IQR)

References

    1. Fridman WH, Zitvogel L, Sautès–Fridman C, Kroemer G. The immune contexture in cancer prognosis and treatment. Nat. Rev. Clin. Oncol. 2017;14:717. doi: 10.1038/nrclinonc.2017.101. - DOI - PubMed
    1. Furness AJ, Vargas FA, Peggs KS, Quezada SA. Impact of tumour microenvironment and Fc receptors on the activity of immunomodulatory antibodies. Trends Immunol. 2014;35:290–298. doi: 10.1016/j.it.2014.05.002. - DOI - PubMed
    1. Patel SP, Kurzrock R. PD-L1 expression as a predictive biomarker in cancer immunotherapy. Mol. Cancer Ther. 2015;14:847–856. doi: 10.1158/1535-7163.MCT-14-0983. - DOI - PubMed
    1. Le DT, et al. PD-1 blockade in tumors with mismatch-repair deficiency. N. Engl. J. Med. 2015;372:2509–2520. doi: 10.1056/NEJMoa1500596. - DOI - PMC - PubMed
    1. McGranahan N, et al. Clonal neoantigens elicit T cell immunoreactivity and sensitivity to immune checkpoint blockade. Science. 2016;351:1463–1469. doi: 10.1126/science.aaf1490. - DOI - PMC - PubMed

Publication types

MeSH terms