. 2018 Sep;20(9):1064-1073.
doi: 10.1038/s41556-018-0169-1. Epub 2018 Aug 13.

RAS nucleotide cycling underlies the SHP2 phosphatase dependence of mutant BRAF-, NF1- and RAS-driven cancers

Affiliations

RAS nucleotide cycling underlies the SHP2 phosphatase dependence of mutant BRAF-, NF1- and RAS-driven cancers

Robert J Nichols et al. Nat Cell Biol. 2018 Sep.

Abstract

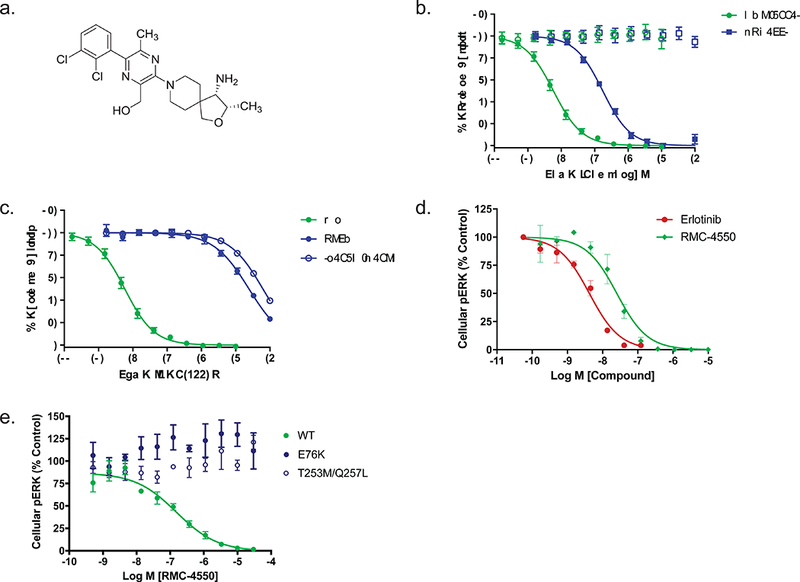
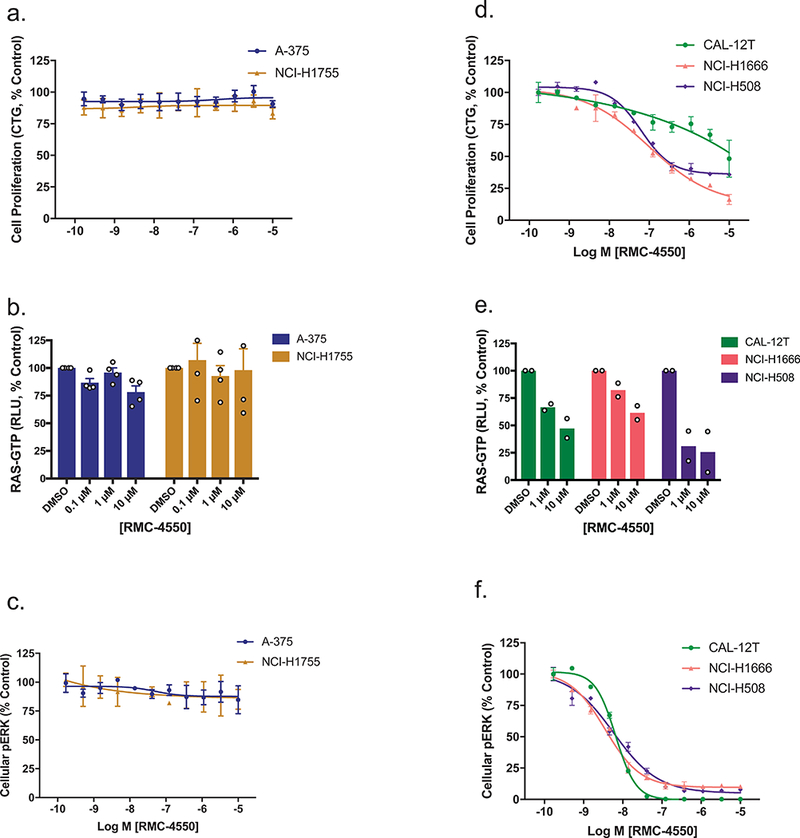
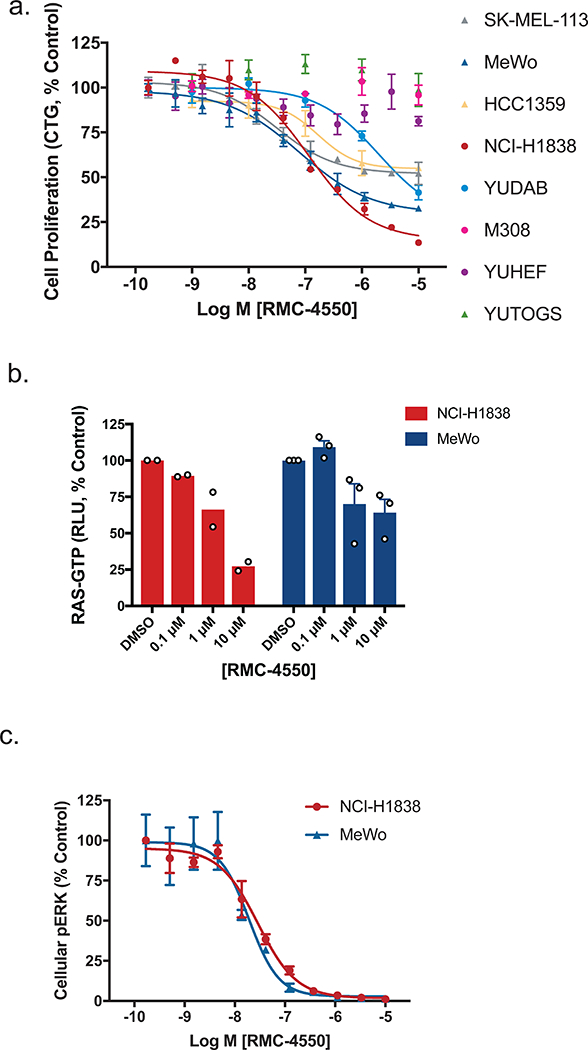
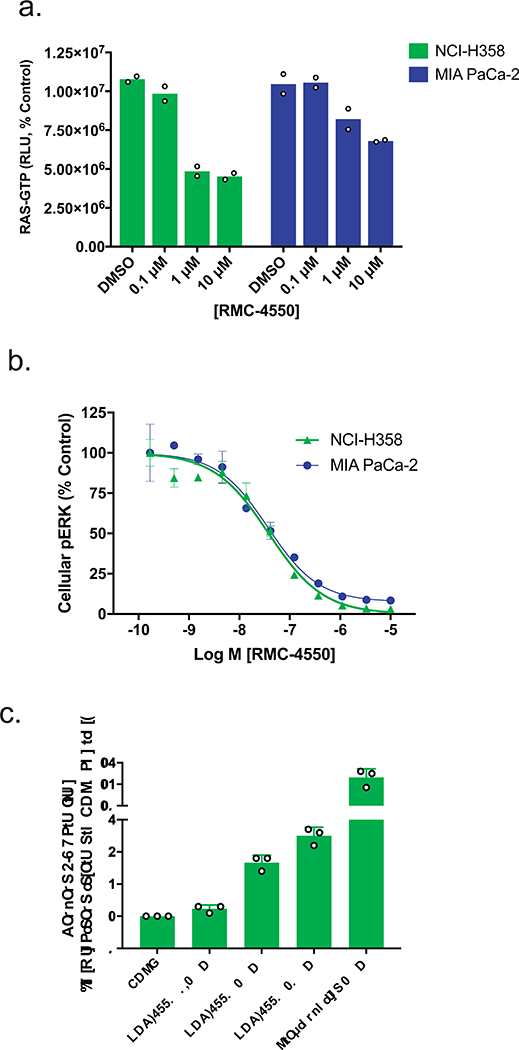
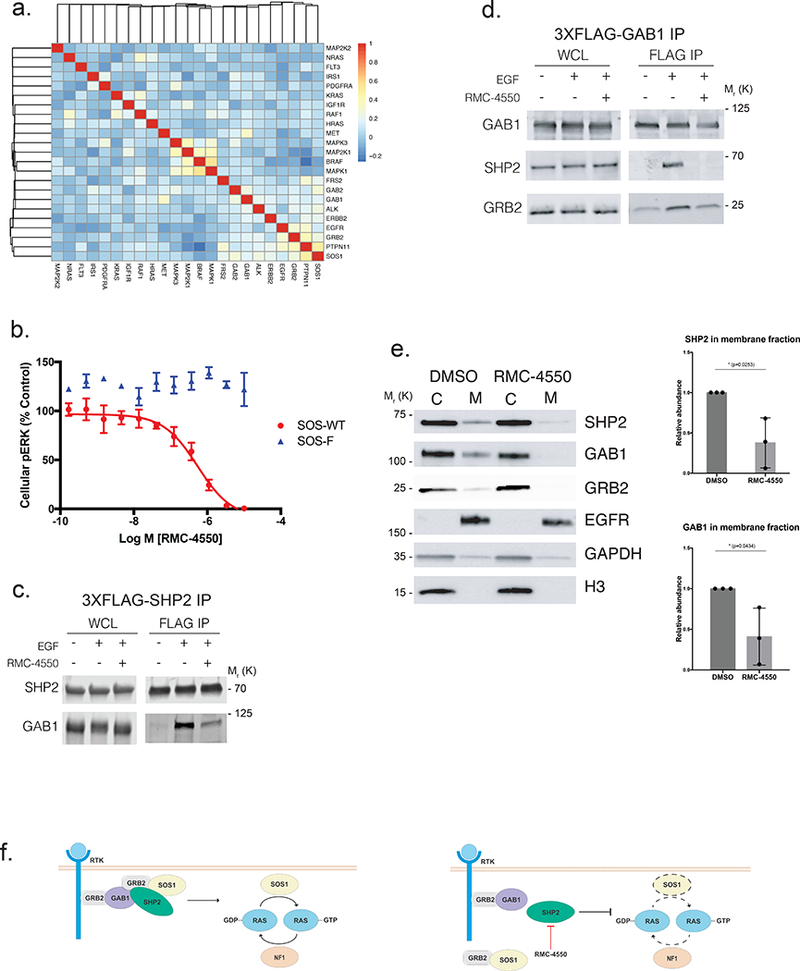
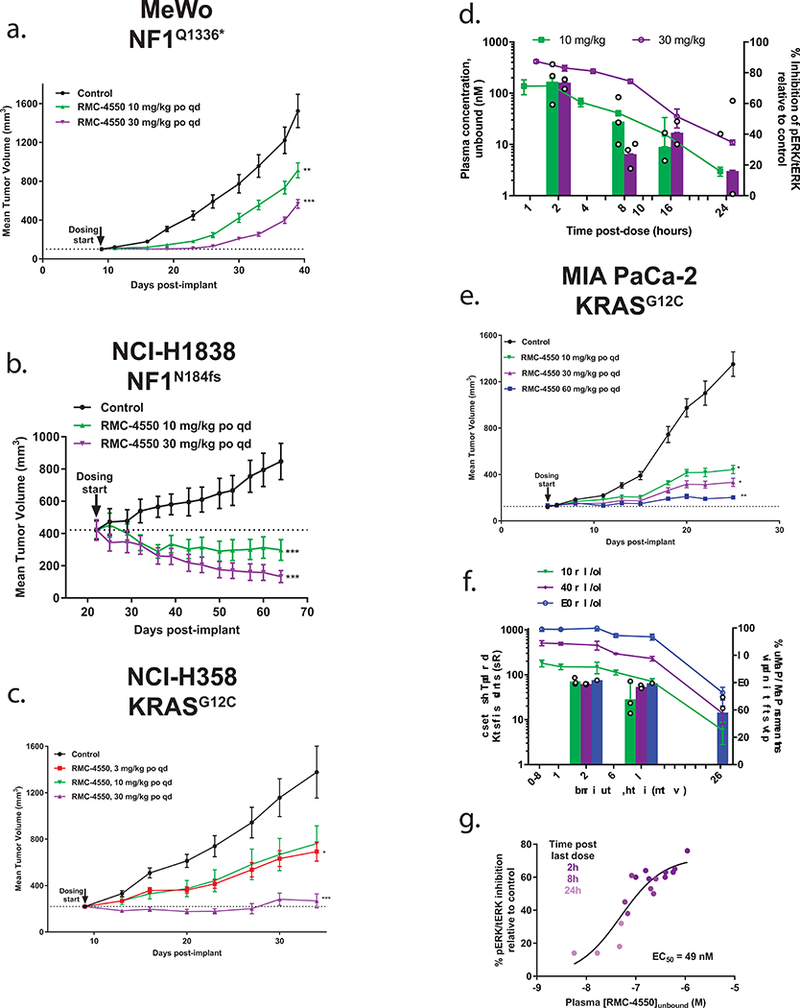
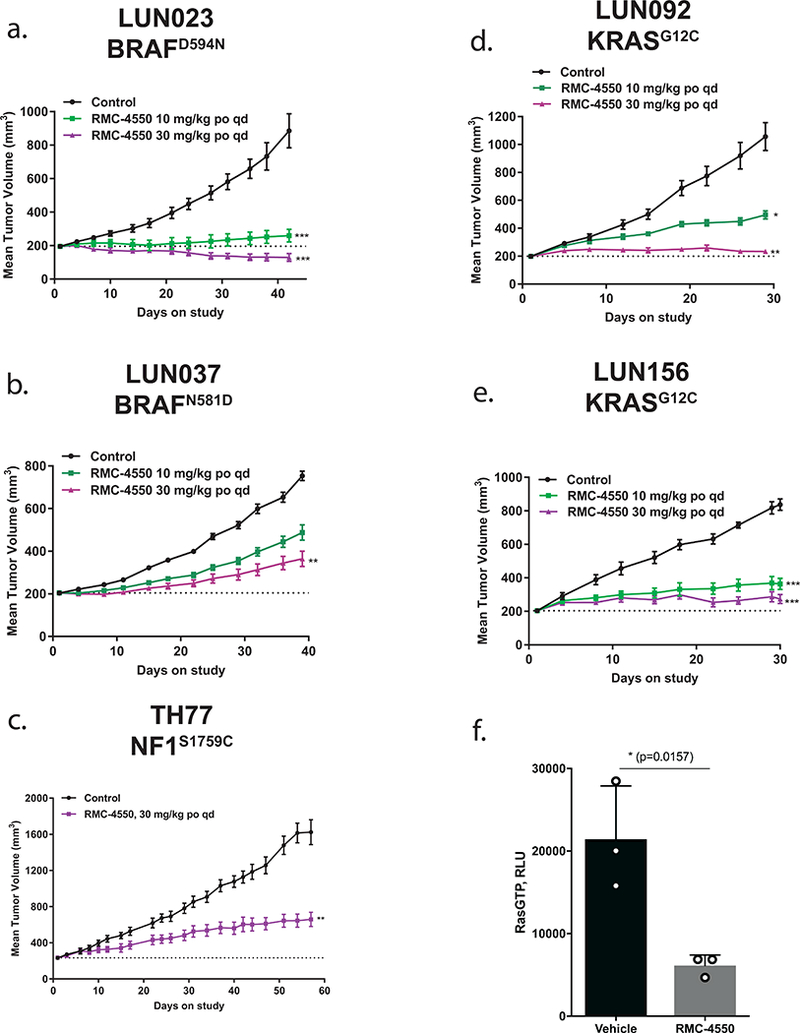
Oncogenic alterations in the RAS/RAF/MEK/ERK pathway drive the growth of a wide spectrum of cancers. While BRAF and MEK inhibitors are efficacious against BRAFV600E-driven cancers, effective targeted therapies are lacking for most cancers driven by other pathway alterations, including non-V600E oncogenic BRAF, RAS GTPase-activating protein (GAP) NF1 (neurofibromin 1) loss and oncogenic KRAS. Here, we show that targeting the SHP2 phosphatase (encoded by PTPN11) with RMC-4550, a small-molecule allosteric inhibitor, is effective in human cancer models bearing RAS-GTP-dependent oncogenic BRAF (for example, class 3 BRAF mutants), NF1 loss or nucleotide-cycling oncogenic RAS (for example, KRASG12C). SHP2 inhibitor treatment decreases oncogenic RAS/RAF/MEK/ERK signalling and cancer growth by disrupting SOS1-mediated RAS-GTP loading. Our findings illuminate a critical function for SHP2 in promoting oncogenic RAS/MAPK pathway activation in cancers with RAS-GTP-dependent oncogenic BRAF, NF1 loss and nucleotide-cycling oncogenic KRAS. SHP2 inhibition is a promising molecular therapeutic strategy for patients with cancers bearing these oncogenic drivers.


Conflict of interest statement

COMPETING FINANCIAL INTERESTS

T.G.B. is a consultant to Novartis, AstraZeneca, Array Biopharma (Scientific Advisory Board), Inventiva, and is the recipient of research grants from Ignyta and Revolution Medicines. T.G.B. is a member of the Revolution Medicines Scientific Advisory Board. All Revolution Medicines authors are employees of Revolution Medicines, Inc. The other authors declare no competing financial interests.

Figures

Figure 1.
Figure 1.. RMC-4550 is a potent, selective, allosteric inhibitor of SHP2.
(a) Structure of RMC-4550. (b) Effect of RMC-4550 and SHP099 on enzyme activity of SHP2 full length or SHP2 catalytic domain. Purified full-length SHP2 was incubated with di-phosphotyrosine peptide and inhibitor for 30 min prior to determining the initial rate of substrate (DiFMUP) hydrolysis. Assay conditions for SHP2 catalytic domain were identical but omitted peptide. RMC-4550 and SHP099 produced a concentration-dependent reduction in activity of full-length SHP2 but had no effect on the catalytic domain up to the maximum test concentrations of 3 μM (RMC-4550) and 10 μM (SHP099). Geometric mean IC50 values for RMC-4550 and SHP099 were 0.583 nM and 53.7 nM (RMC-4550 n = 8 independent experiments SHP099 n = 6 independent experiments; figures show mean +/− S.D.) (c) Effect of RMC-4550 on wild-type, full-length SHP2, SHP2E76K, or SHP2T253M/Q257L. The phosphatase activity of all enzymes was assayed as described in (b). RMC-4550 produced a concentration-dependent reduction in activity of wild type SHP2 but had greatly reduced effect in E76K or T253M/Q257L mutants (SHP2WT n = 8, SHP2E76K n = 3, SHP2T253M/Q257L n = 3; figures show mean +/− S.D.) independent experiments (d) PC9 cells were grown in 2D culture and incubated with increasing concentrations of RMC-4550 or erlotinib for one hour prior to determining pERK levels. RMC-4550 produced a concentration-dependent reduction in pERK with a geometric mean IC50 value of 31 nM (n = 4 independent experiments; figures show mean +/− S.D.) e) Effect of RMC-4550 on HEK293 cells expressing wild type SHP2, SHP2E76K, or SHP2T253M/Q257L. Isogenic HEK293 cell lines expressing each SHP2 variant were incubated with RMC-4550 for 1 hour, stimulated with EGF for 5 minutes, lysed, and the levels of pERK were determined. RMC-4550 produced a concentration-dependent reduction in the level of pERK in cells expressing wild-type SHP2 with a geometric mean IC50 value of 49.2 nM (n = 4 independent experiments; figures show mean +/− S.D.) No inhibitory activity was observed in cells expressing E76K or T253M/Q257L mutants up to the maximum test concentration of 10 μM. Source data is provided in Supplementary Table 9.
Figure 2.
Figure 2.. SHP2 inhibition suppresses growth and RAS/MAPK signaling in cancer cell lines with class 3 BRAF mutations.
(a) Effect of RMC-4550 on proliferation of class 1 (A-375, BRAFV600E) and class 2 (NCI-H1755, BRAFG469A) BRAF mutant cell lines in 3D culture. Data represent 4 independent experiments each performed in technical duplicate. Figure shows mean +/− S.D. b) and c) A-375 and NCI-H1755 cells were grown in 2D culture and incubated with increasing concentrations of RMC-4550 for one hour. Cellular lysates were prepared and levels of RAS-GTP (b) and pERK (c) determined. RMC-4550 had no effect on cellular RAS-GTP or pERK levels in either cell line up to the maximal test concentration of 10 μM. RAS-GTP data show mean +/− S.E.M. of n = 4 independent biological experiments. pERK data are representative of n = 4 independent biological experiments each performed in duplicate; figures show mean +/− S.D. d) Effect of RMC-4550 on proliferation of three class 3 BRAF mutant cell lines (CAL-12T, BRAFG466V/+; NCI-H1666, BRAFG466V/+, NCI-H508, BRAFG596R/+) in 3D culture. RMC-4550 exhibited geometric mean IC50 values of >10 μM, 304 nM, and 19 nM, respectively, for growth inhibition in CAL-12T, NCI-H1666, and NCI-H508 cells (data are representative of n=4 independent biological experiments each performed in duplicate; figures show mean +/− S.D.) e) and f) CAL-12T, NCI-H1666, and NCI-H508 cells were grown in 2D culture and incubated with increasing concentrations of RMC-4550 for one hour. Cellular lysates were prepared and levels of RAS-GTP (e) and pERK (f) determined. RAS-GTP levels in CAL-12T, NCI-H1666, and NCI-H508 cells were inhibited in a concentration-dependent manner by RMC-4550. RMC-4550 produced a concentration-dependent reduction in pERK levels in CAL-12T, NCI-H1666, and H508 cells with geometric mean IC50 values of 7 nM, 6 nM, and 4 nM respectively (n = 2 biologically independent observations for RAS-GTP, and n = 4 biologically independent experiments for pERK, in duplicate; figures show mean +/− S.E.M. for RAS-GTP and mean +/− S.D. for pERK.) Source data is provided in Supplementary Table 9.
Figure 3.
Figure 3.. SHP2 inhibition suppresses growth and RAS/MAPK signaling in cancer cell lines driven by NF1LOF mutation.
(a) Effect of RMC-4550 on proliferation of NF1LOF cells in 3D culture. One day after seeding cells were treated with RMC-4550 and cell viability measured on Day 7 using CTG. Figure shows mean +/− S.D.; n = 3 independent experiments performed in technical duplicate. (b) and (c) NCI-H1838 and MeWo NF1LOF cells were grown in 2D culture and incubated with increasing concentrations of RMC-4550 for one hour. Cellular lysates were prepared and levels of RAS-GTP (b) and pERK (c) determined. RAS-GTP levels in NCI-H1838 and MeWo cells were inhibited in a concentration-dependent manner by RMC-4550 (n = 2 independent experiments for MeWo and n = 3 independent experiments for NCI-H1838; figures show mean +/− S.E.M.) The geometric mean IC50 value for reduction in pERK was 29 nM in NCI-H1838 cells, and 24 nM in MeWo cells (data representative of n = 4 biologically independent observations, each performed in technical duplicate; figures show mean +/− S.D.) Source data is provided in Supplementary Table 9.
Figure 4.
Figure 4.. SHP2 Inhibition suppresses growth and RAS/MAPK signaling in a range of cancer cell lines driven by KRASG12 mutations.
(a) and (b) Representative KRASG12C lines, NCI-H358 and MIA PaCa-2, were grown in 2D culture and incubated with increasing concentrations of RMC-4550 for one hour. Cellular lysates were prepared and levels of RAS-GTP (a) and pERK (b) determined. RMC-4550 produced a concentration-dependent reduction in both cellular RAS-GTP and pERK levels. Geometric mean IC50 values for reduction in pERK in NCI-H358 and MIA PaCa-2 cells were 28 nM and 63 nM respectively (n = 4 independent experiments performed in technical duplicate; figures show mean +/− S.D. for pERK and mean +/− S.E.M. for RAS-GTP). (c) NCI-H358 cells were grown on ULA plates as spheroids. After 5 days in culture, spheroids were treated with RMC-4550 or staurosporine, as a positive control, and assayed for caspase 3/7 activity after 20 hours (n = 3 independent observations; figure shows mean +/− S.D.) Source data is provided in Supplementary Table 9.
Figure 5.
Figure 5.. Mechanism of action of SHP2 inhibition is dependent on SOS1.
(a) Pearson correlation analysis of the cellular effects of genetic knockdown of signaling molecules in the RTK/RAS/MAPK pathway across 370 cell lines in Project DRIVE. Knockdown of PTPN11 (SHP2) is most closely correlated with SOS1 (correlation coefficient 0.51) and GRB2 (correlation coefficient 0.4). b) Effect of RMC-4550 on cellular pERK in HEK293 expressing SOS-WT (wild type) or SOS-F, a SOS1 mutant that targets SOS protein constitutively to the plasma membrane. Expression of SOS-WT and SOS-F was induced with doxycycline for 24 hours. Cells were incubated for 1 hour with RMC-4550 and stimulated with EGF (50 ng/mL) for the final five minutes of drug treatment. Cellular lysates were prepared for determination of pERK. RMC-4550 produced a concentration-dependent reduction in pERK levels in cells expressing SOS-WT but not SOS-F, geometric mean IC50 = 1.0 μM (n = 3 biologically independent experiments, performed in technical duplicate; figures show mean +/− S.D.) In SOS-F expressing cells, no inhibition was observed up to maximal test concentration of 10 μM. (c), (d) Effect of RMC-4550 (10 μM) on the physical association of SHP2 and GAB1 in HEK293 cells. Cells were incubated for 1 hour with RMC-4550 and stimulated with EGF (50 ng/mL) for the final minute of drug treatment prior to immunoprecipitation of (c) 3XFLAG-SHP2 or (d) 3XFLAG-GAB1 with anti-FLAG beads. Figure shows representative results of n = 3 biologically independent experiments. (e) Effect of RMC-4550 on membrane localization of SHP2, GAB1, and GRB2 in HEK293 cells. Cells were incubated for 1 hour with RMC-4550 and stimulated with EGF (50 ng/mL) five minutes prior to harvest. Membrane fractionation was performed by differential lysis and centrifugation of cellular components (C, cytosol and M, membrane Signal intensity was quantified for SHP2 and GAB1 in the membrane fraction, (n = 3 independent biological experiments depicted as normalized intensity for RMC-4550 over DMSO treated control, mean +/− S.D.) (f) Schematic model of the function of SHP2 as a transducer of signals from upstream RTKs to SOS1 for RAS activation. Source data is provided in Supplementary Table 9.
Figure 6.
Figure 6.. SHP2 inhibition suppresses tumor growth and RAS/MAPK signaling in xenograft models of NF1LOF and KRASG12C-driven cancer.
(a) MeWo (n = 10 animals/group) showed tumor growth inhibition (TGI) at 10 mg/kg (43%) and 30 mg/kg (67%) (** p = 0.00955; *** p = 2.1e−4) and b) NCI-H1838 (n = 10 animals/group) showed tumor regression at 10 mg/kg (−29%) and 30 mg/kg (−69%) (*** p = 1.12e−7 for 10 mg/kg; *** p = 2.0e−10 for 30 mg/kg). Dose-dependent efficacy following daily oral administration of RMC-4550 in two KRASG12C tumor xenograft models. (c) NCI-H358 (n = 10 animals/group) showed TGI at 3, 10, and 30 mg/kg (59, 53, 96% respectively) (* p = 0.0416; *** p = 5.2e−5). (d) Pharmacokinetic (left-y-axis) and pharmacodynamic (right y-axis) profile of RMC-4550 in plasma and tumors, respectively, following a single oral dose of 10 and 30 mg/kg in the NCI-H358 model. The plasma profile of RMC-4550 shows dose proportional maximal concentrations and exposure (Table S6) over a period of 24 hours; n = 3 independent samples/time point, figure shows mean +/− S.D. pERK/total ERK ratio in RMC-4550-treated tumors normalized to mean ratio in vehicle-treated tumors (n = 3 independent samples/group). (e) MIA PaCa-2 (n = 12 animals/group) exhibited dose-proportional and significant TGI at 10, 30 and 60 mg/kg (74, 83, 93% respectively) (* p = 0.0436 for 10 mg/kg; * p = 0.0120 for 30 mg/kg; *** p = 0.003). (f) Pharmacokinetic (left-y-axis) and pharmacodynamic (right y-axis) profile of RMC-4550 in plasma and tumors, respectively, following the last dose in MIA PaCa-2 study shown in (e) over a period of 24 hours. pERK/total ERK ratio in RMC-4550-treated tumors normalized to mean ratio in vehicle-treated tumors (n = 3 independent samples/group). Figure shows mean +/− S.D. (g) Concentration-response relationship from individual animals summarized in data shown in (f) indicates a time- and plasma concentration-dependent suppression of tumor pERK in vivo. Statistical test: ordinary one-way ANOVA with post-hoc Tukey’s test. Figures a-c, and e show mean +/− S.E.M. Source data is provided in Supplementary Table 9.
Figure 7.
Figure 7.. SHP2 inhibition suppresses tumor growth in patient derived xenograft models of class 3 BRAF, NF1LOF and KRASG12C-driven cancer.
Daily oral administration of RMC-4550 resulted in a dose dependent inhibition of tumor growth in the following PDX models (a) LUN023 (BRAFD594N) at 10 and 30 mg/kg, TGI = 91% and regression = −34%, respectively (*** p = 0.00223 for 10mg/kg; *** p = 3.76e−5 for 30 mg/kg), (b) LUN037 (BRAFN581D) at 10 and 30 mg/kg, TGI = 48% and 71%, respectively (** p = 0.00575), (c) TH77 (NF1S1759C) at 30 mg/kg, TGI = 69% (** p = 0.0050), (d) LUN092 (KRASG12C) at 10 and 30 mg/kg, TGI = 65% and 96%, respectively (* p = 0.0386; ** p = 2.33e−4), and (e) LUN156 (KRASG12C) at 10 and 30 mg/kg, TGI = 75% and 89%, respectively (*** p = 1.03e−3 for 10mg/kg; *** p = 3.75e−6 for 30 mg/kg). Statistical test: ordinary one-way ANOVA with post-hoc Tukey’s test. Figures show mean +/− S.E.M. (f) RAS-GTP levels were assessed by RAS-GTP ELISA in tumor lysates derived from vehicle and RMC-4550 treated animals (n = 3 independent samples each). Durable suppression of RAS-GTP was observed in RMC-4550 treated tumors harvested at endpoint. Data shows mean +/− SD for each individual animal measured across two technical replicates, * p = 0.0157 by unpaired t-test (two-tailed). Source data is provided in Supplementary Table 9.

Similar articles

Cited by

References

    1. Dhillon AS, Hagan S, Rath O & Kolch W MAP kinase signalling pathways in cancer. Oncogene 26, 3279–3290 (2007). - PubMed
    1. Bos JL, Rehmann H & Wittinghofer A GEFs and GAPs: Critical Elements in the Control of Small G Proteins. Cell 130, 385 (2007). - PubMed
    1. Network, T.C.G.A.R. Comprehensive molecular profiling of lung adenocarcinoma. Nature, 1–9 (2014). - PMC - PubMed
    1. Krauthammer M et al. Exome sequencing identifies recurrent mutations in NF1 and RASopathy genes in sun-exposed melanomas. Nature genetics 47, 996–1002 (2015). - PMC - PubMed
    1. Redig AJ et al. Clinical and Molecular Characteristics of NF1-Mutant Lung Cancer. Clinical cancer research : an official journal of the American Association for Cancer Research 22, 3148–3156 (2016). - PMC - PubMed

Publication types

MeSH terms