. 2018 Aug 13;8(1):12021.
doi: 10.1038/s41598-018-30529-z.

Turn-off colorimetric sensor for sequence-specific recognition of single-stranded DNA based upon Y-shaped DNA structure

Affiliations

Turn-off colorimetric sensor for sequence-specific recognition of single-stranded DNA based upon Y-shaped DNA structure

Hong Zhang et al. Sci Rep. .

Abstract

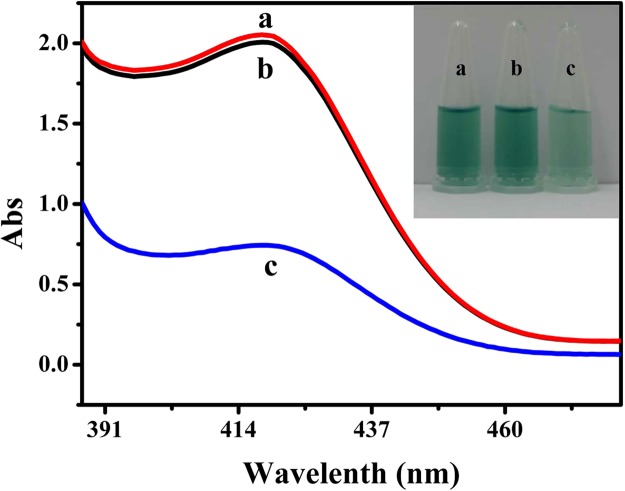
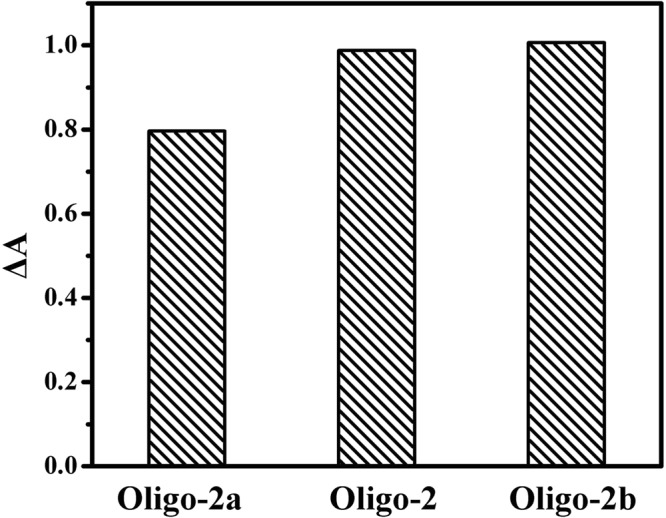
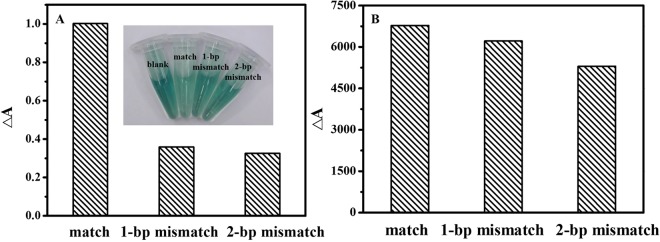
A novel turn-off colorimetric sensor for sequence-specific recognition of single-stranded DNA (ssDNA) was established by combining Y-shaped DNA duplex and G-quadruplex-hemin DNAzyme. A G-rich single-stranded DNA (Oligo-1) displays peroxidase mimicking catalytic activity due to the specific binding with hemin in the presence of K+, which was able to catalyze the oxidation of colorless 2,2'-azinobis(3-ethylbenzothiazoline)-6-sulfonic acid (ABTS2-) by H2O2 to generate green ABTS•- radical for colorimetric assay. Oligonucleotide 2 (Oligo-2) was partly complementary with Oligo-1 and the target DNA. Upon addition of target DNA, Oligo-1, Oligo-2 and target DNA can hybridize with each other to form Y-shaped DNA duplex. The DNAzyme sequence of Oligo-1 was partly caged into Y-shaped DNA duplex, resulting in the inactivation of the DNAzyme and a sharp decrease of the absorbance of the oxidation product of ABTS2-. Under the optimum condition, the absorbance decreased linearly with the concentration of target DNA over the range of 1.0-250 nM and the detection limit was 0.95 nM (3σ/slope) Moreover, satisfied result was obtained for the discrimination of single-base or two-base mismatched DNA.


Conflict of interest statement

The authors declare no competing interests.

Figures

Figure 1
Figure 1
Schematic illustration for sequence-specific recognition of single-stranded DNA based upon Y-shaped DNA duplex and G-quadruplex-hemin DNAzyme.
Figure 2
Figure 2
Typical photograph and absorption spectra of ABTS2− and H2O2 mixture catalytically oxidized by G-quadruplex-hemin DNAzyme under different conditions. (a) Oligo-1; (b) a + Oligo-2; (c) b + 500 nM target DNA. Experimental conditions: 1.5 μM Oligo-1, 1.5 μM Oligo-2, 15 μM hemin, 40 mM ABTS2− and 25 mM H2O2. 10 mM Tris-HCl buffer (pH 7.0, 150 mM KCl) was used.
Figure 3
Figure 3
(A) CD spectroscopy of DNA molecule under different conditions. (a) Oligo-1; (b) a + Oligo-2; (c) b + target DNA. (B) Fluorescent validation of the formation of G-quadruplex through ThT fluorescence. (a) ThT; (b) a + Oligo-1; (c) b + Oligo-2; (d) c + target DNA.
Figure 4
Figure 4
Effect of the sconcentration of (A) Oligo-1, (B) Oligo-2, (C) KCl, (D) hemin, (E) ABTS2− and (F) H2O2 on ΔA.
Figure 5
Figure 5
Effect of different sequence of assistant probe on ΔA. Experimental conditions: 1.5 μM signal probe, 150 mM KCl, 15 μM hemin, 40 mM ABTS2−, 25 mM H2O2 and1.5 μM assistant probe. The concentration of Oligo-3 was 200 nM. 10 mM Tris-HCl buffer (pH 7.0, 150 mM KCl) was used.
Figure 6
Figure 6
Calibration curve of the assay. Experimental conditions: 1.5 μM signal probe, 1.5 μM assisstant probe, 15 μM hemin, 40 mM ABTS2− and 25 mM H2O2. 10 mM Tris-HCl buffer (pH 7.0, 150 mM KCl) was used in the experiment.
Figure 7
Figure 7
Sequence selectivity of the assay toward (A) Y-shaped DNA duplex and (B) linear DNA duplex. Experimental conditions: 1.5 μM Oligo-1, 1.5 μM Oligo-2, 15 μM hemin, 40 mM ABTS2− and 25 mM H2O2. The concentration of Oligo-3, Oligo-4, Oligo-5 and block DNA was 200 nM. 10 mM Tris-HCl buffer (pH 7.0, 150 mM KCl) was used.

References

    1. Syvänen AC. Accessing genetic variation: genotyping single nucleotide polymorphisms. Nat. Rev. Genet. 2001;2:930–942. doi: 10.1038/35103535. - DOI - PubMed
    1. Ye M, et al. A novel method for the detection of point mutation in DNA using single-base-coded CdS nanoprobes. Biosens. Bioelectron. 2009;24:2339–2345. doi: 10.1016/j.bios.2008.12.002. - DOI - PubMed
    1. Taton TA, Mirkin CA, Letsinger RL. Scanometric DNA array detection with nanoparticle probes. Science. 2000;289:1757–1760. doi: 10.1126/science.289.5485.1757. - DOI - PubMed
    1. Cao YWC, Jin RC, Mirkin CA. Nanoparticles with Raman spectroscopic fingerprints for DNA and RNA detection. Science. 2002;297:1536–1540. doi: 10.1126/science.297.5586.1536. - DOI - PubMed
    1. Brückner K, Schwarz K, Beck S, Linscheid MW. DNA quantification via ICP-MS using lanthanide-labeled probes and ligation-mediated amplification. Anal. Chem. 2014;86:585–591. doi: 10.1021/ac402668p. - DOI - PubMed

Publication types

MeSH terms

LinkOut - more resources