Observational Study
. 2018 Aug 13;8(1):12054.
doi: 10.1038/s41598-018-30535-1.

Automated Gleason grading of prostate cancer tissue microarrays via deep learning

Affiliations
Observational Study

Automated Gleason grading of prostate cancer tissue microarrays via deep learning

Eirini Arvaniti et al. Sci Rep. .

Erratum in

Abstract

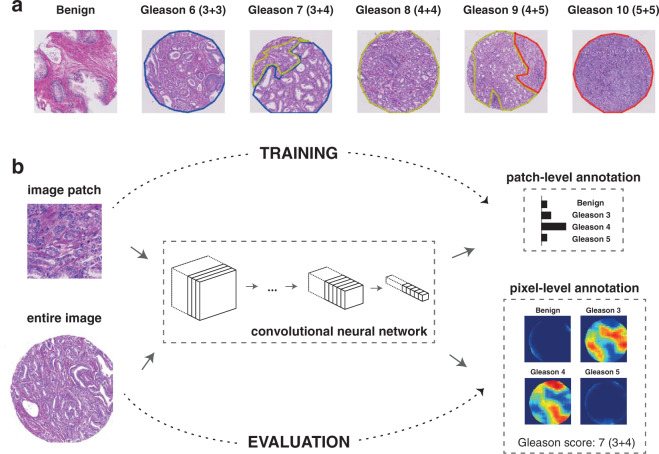
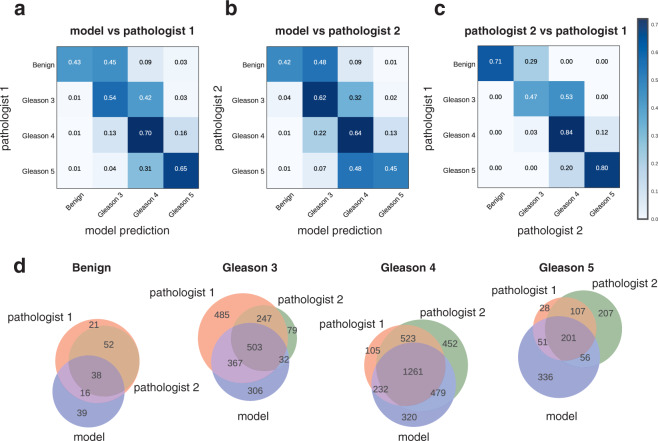
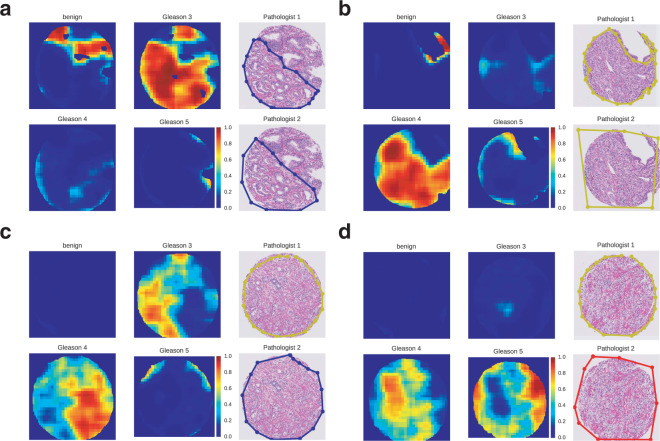
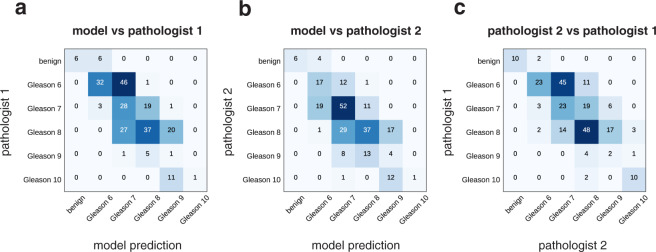
The Gleason grading system remains the most powerful prognostic predictor for patients with prostate cancer since the 1960s. Its application requires highly-trained pathologists, is tedious and yet suffers from limited inter-pathologist reproducibility, especially for the intermediate Gleason score 7. Automated annotation procedures constitute a viable solution to remedy these limitations. In this study, we present a deep learning approach for automated Gleason grading of prostate cancer tissue microarrays with Hematoxylin and Eosin (H&E) staining. Our system was trained using detailed Gleason annotations on a discovery cohort of 641 patients and was then evaluated on an independent test cohort of 245 patients annotated by two pathologists. On the test cohort, the inter-annotator agreements between the model and each pathologist, quantified via Cohen's quadratic kappa statistic, were 0.75 and 0.71 respectively, comparable with the inter-pathologist agreement (kappa = 0.71). Furthermore, the model's Gleason score assignments achieved pathology expert-level stratification of patients into prognostically distinct groups, on the basis of disease-specific survival data available for the test cohort. Overall, our study shows promising results regarding the applicability of deep learning-based solutions towards more objective and reproducible prostate cancer grading, especially for cases with heterogeneous Gleason patterns.


Conflict of interest statement

The authors declare no competing interests.

Figures

Figure 1
Figure 1
Overall annotation procedure. (a) Examples of TMA spot Gleason annotations provided by the pathologists (blue: Gleason pattern 3 region, yellow: Gleason pattern 4 region, red: Gleason pattern 5 region). (b) During the training phase (top row), a deep neural network was trained as a patch-level classifier. We used the MobileNet architecture, whose main building blocks are “depthwise separable” convolutions: a special type of convolution block with considerably fewer parameters than normal convolutions. Convolution blocks are used to extract increasingly complex features from the input image. Following the convolution blocks, a global average pooling layer computes the spatial average of each feature map at the last convolution layer, effectively summarizing the locally-detected patterns across the entire image. Finally, the output layer produced the final classification decision for each input image patch by computing a probability distribution over the four Gleason classes considered in this study. During the evaluation phase (bottom row), the trained patch-level convolutional neural network was applied to entire TMA spot images in a sliding window fashion and generated pixel-level probability maps for each class. A Gleason score was assigned to a TMA spot as the sum of the primary and secondary Gleason patterns detected (above a threshold) in the corresponding output pixel-level maps.
Figure 2
Figure 2
Model evaluation on test cohort (image patch level) and inter-pathologist variability. All confusion matrices were normalized per row (ground truth label) reflecting the recall metric for each class. (a) Patch-based model annotations compared with annotations by 1st pathologist. (b) Patch-based model annotations compared with annotations by 2nd pathologist. (c) Annotations by 2nd pathologist compared with annotations by 1st pathologist. (d) Venn diagrams illustrating the overlap in patch-level Gleason annotations produced by the deep learning model and the two pathologists.
Figure 3
Figure 3
Representative examples of model predictions as pixel-level probability maps and visual comparison with pathologist annotations. Each subfigure (ad) corresponds to a different TMA spot. Within each subfigure (a–d), the subplots in the right-most column show the Gleason patterns assigned by the two pathologists (blue: Gleason 3 region, yellow: Gleason 4 region, red: Gleason 5 region). The other four subplots show the model’s Gleason annotations. (a) The annotation of the model agrees overall with the two pathologists, except for a small tissue region in the upper part which is marked as Gleason pattern 3 exclusively by the model. Retrospective assessment of this part by the pathologists confirmed the presence of a small focus of atypical glands. (b) The model and pathologist annotations agree on Gleason pattern 4. (c) Disagreement in annotations (Gleason pattern 3 versus 4) by the model and the two pathologists. A third uropathologist indepentently evaluated this case and his opinion coincided with the model’s annotations. (d) Disagreement in annotations (Gleason pattern 4 versus 5) by the model and the two pathologists. A third uropathologist indepentently evaluated this case and assigned a Gleason pattern 4, noting however the presence of diffuse single cells which could be interpreted as Gleason pattern 5.
Figure 4
Figure 4
Model evaluation on test cohort (TMA spot level) and inter-pathologist variability. Each TMA spot is annotated with detected Gleason patterns (Gleason 3, 4 or 5) by the model and two pathologists. Then, a final Gleason score is assigned as the sum of the two most predominant Gleason patterns. If no cancer is detected, the TMA spot is classified as benign. We show confusion matrices for the comparison of Gleason score assignments by (a) the model and the first pathologist, (b) the model and the second pathologist, (c) the two pathologists.
Figure 5
Figure 5
Model interpretation via class activation mapping (CAM). For each class, we show two examples of image patches that were confidently and correctly classified by the deep learning model. In addition, the regions where the model is focusing on in order to make predictions are highlighted. In each example, the first column shows the image patch. In the second column, a heatmap generated by the class activation mapping technique is overlaid, highlighting the most important regions for the model predictions. In the third column, only the highlighted part of the image is shown. Class activation maps are generated by projecting the class-specific weights of the output classification layer back to the feature maps of the last convolutional layer, thus highlighting important regions for predicting a particular class. The final CAM heatmap is computed as the sum of the resulting augmented feature maps, followed by clipping negative values and subsequent scaling to the [0, 1] interval. Red color indicates regions where the CAM heatmap values are close to 1, i.e. the most class-specific discriminative parts of the image.
Figure 6
Figure 6
Disease-specific survival analysis results. (a) Kaplan-Meier curves for patients who were split into three risk groups according to Gleason score annotations by the model and two pathologists. The shaded regions indicate 95% confidence bands. P-values for pairwise two-tailed logrank tests with Benjamini-Hochberg correction are reported. (b) Venn diagrams illustrating overlap in model-based and pathologist annotation-based assignment of patients into Gleason score groups.

Similar articles

Cited by

References

    1. WHO Classification of Tumours of the Urinary System and Male Genital Organs. International Agency for Research on Cancer (IARC) (2016).
    1. Gleason, D. F. & Mellinger, G. T. Prediction of prognosis for prostatic adenocarcinoma by combined histological grading and clinical staging. J. Urol. 111, 58–64 (1974). - PubMed
    1. Faraj SF, et al. Clinical Validation of the 2005 ISUP Gleason Grading System in a Cohort of Intermediate and High Risk Men Undergoing Radical Prostatectomy. PLoS One. 2016;11:e0146189. doi: 10.1371/journal.pone.0146189. - DOI - PMC - PubMed
    1. Gordetsky J, Epstein J. Grading of prostatic adenocarcinoma: current state and prognostic implications. Diagn. Pathol. 2016;11:25. doi: 10.1186/s13000-016-0478-2. - DOI - PMC - PubMed
    1. Epstein JI. Prostate cancer grading: a decade after the 2005 modified system. Mod. Pathol. 2018;31:S47–63. doi: 10.1038/modpathol.2017.133. - DOI - PubMed

Publication types