

Efficiently controlling for case-control imbalance and sample relatedness in large-scale genetic association studies
- PMID: 30104761
- PMCID: PMC6119127
- DOI: 10.1038/s41588-018-0184-y
Efficiently controlling for case-control imbalance and sample relatedness in large-scale genetic association studies
Abstract
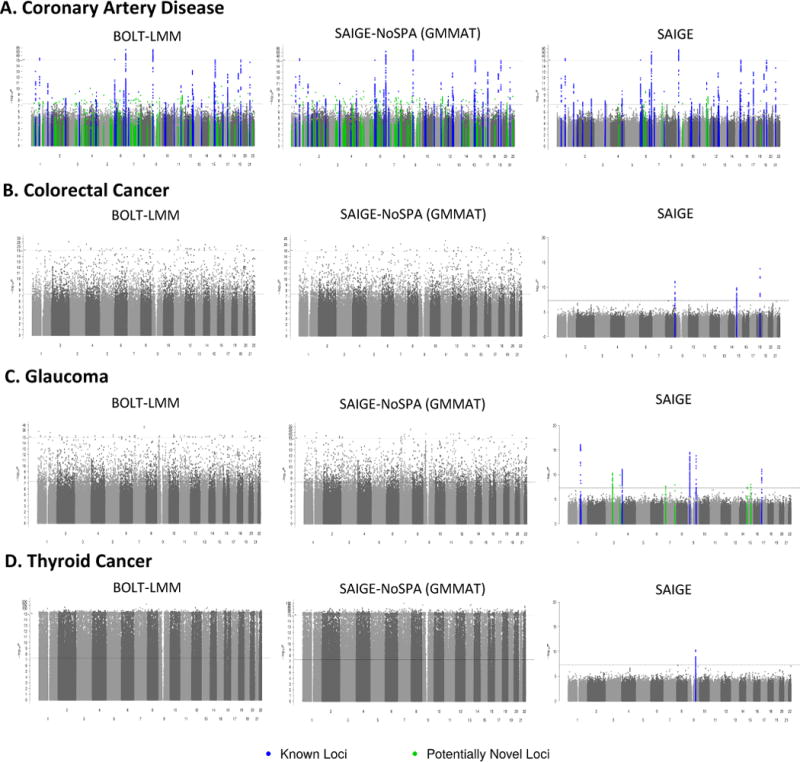
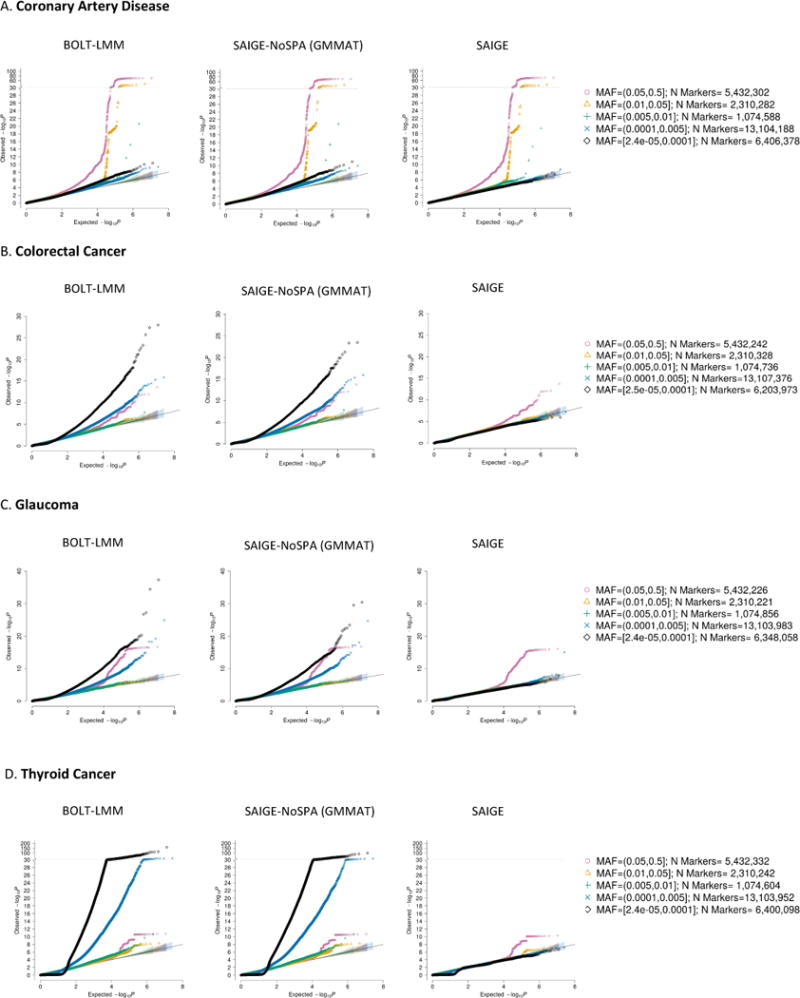
In genome-wide association studies (GWAS) for thousands of phenotypes in large biobanks, most binary traits have substantially fewer cases than controls. Both of the widely used approaches, the linear mixed model and the recently proposed logistic mixed model, perform poorly; they produce large type I error rates when used to analyze unbalanced case-control phenotypes. Here we propose a scalable and accurate generalized mixed model association test that uses the saddlepoint approximation to calibrate the distribution of score test statistics. This method, SAIGE (Scalable and Accurate Implementation of GEneralized mixed model), provides accurate P values even when case-control ratios are extremely unbalanced. SAIGE uses state-of-art optimization strategies to reduce computational costs; hence, it is applicable to GWAS for thousands of phenotypes by large biobanks. Through the analysis of UK Biobank data of 408,961 samples from white British participants with European ancestry for > 1,400 binary phenotypes, we show that SAIGE can efficiently analyze large sample data, controlling for unbalanced case-control ratios and sample relatedness.
Conflict of interest statement
The authors declare no competing financial interests.
Figures
References
-
- Bush WS, Oetjens MT, Crawford DC. Unravelling the human genome-phenome relationship using phenome-wide association studies. Nat Rev Genet. 2016;17:129–145. - PubMed
METHODS-ONLY REFERENCES
-
- Breslow NE, Clayton DG. Approximate Inference in Generalized Linear Mixed Models. J Am Stat Assoc. 1993;88:9.
-
- Gilmour AR, Thompson R, Cullis BR. Average Information REML: An Efficient Algorithm for Variance Parameter Estimation in Linear Mixed Models. Biometrics. 1995;51:1440.
-
- Kaasschieter EF. Preconditioned conjugate gradients for solving singular systems. J Comput Appl Math. 1988;24:265–275.
-
- Hestenes MR, Eduard S. Methods of conjugate gradients for solving linear systems. Vol. 49. NBS; 1952.
Publication types
MeSH terms
Grants and funding
LinkOut - more resources
Full Text Sources
Other Literature Sources
