. 2018 Sep;24(9):1459-1468.
doi: 10.1038/s41591-018-0135-2. Epub 2018 Aug 13.

Sequestration of T cells in bone marrow in the setting of glioblastoma and other intracranial tumors

Affiliations

Sequestration of T cells in bone marrow in the setting of glioblastoma and other intracranial tumors

Pakawat Chongsathidkiet et al. Nat Med. 2018 Sep.

Erratum in

Abstract

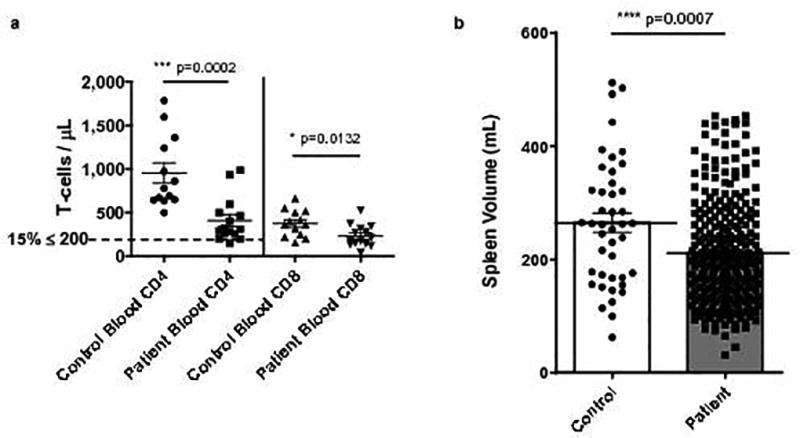
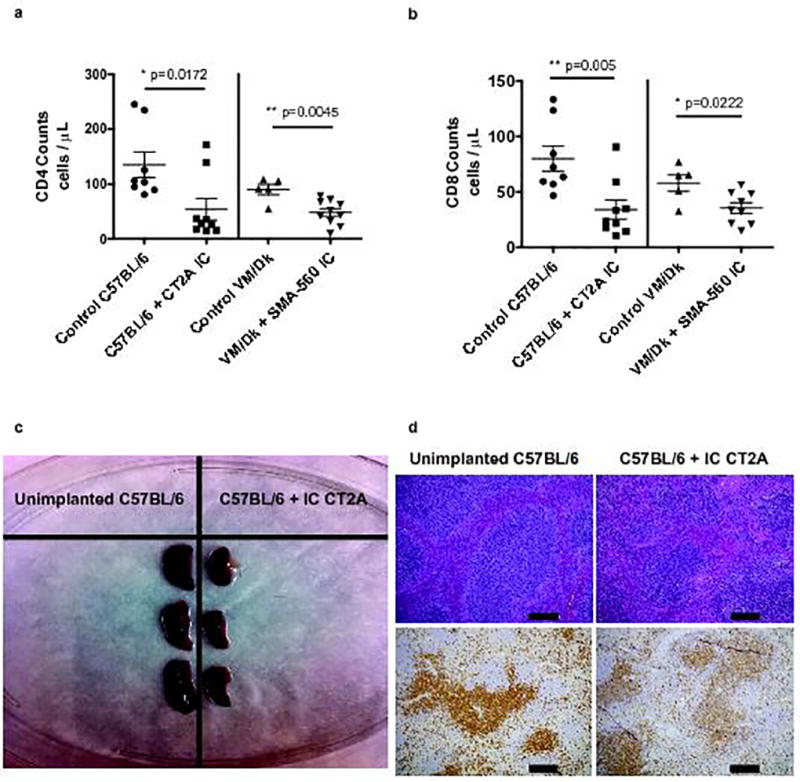
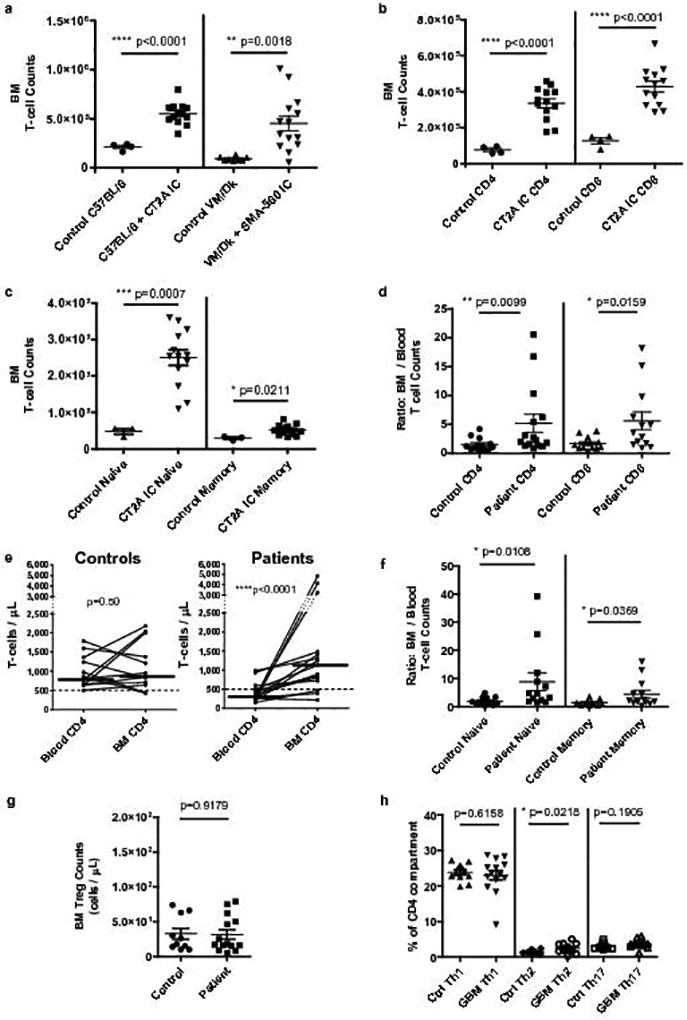
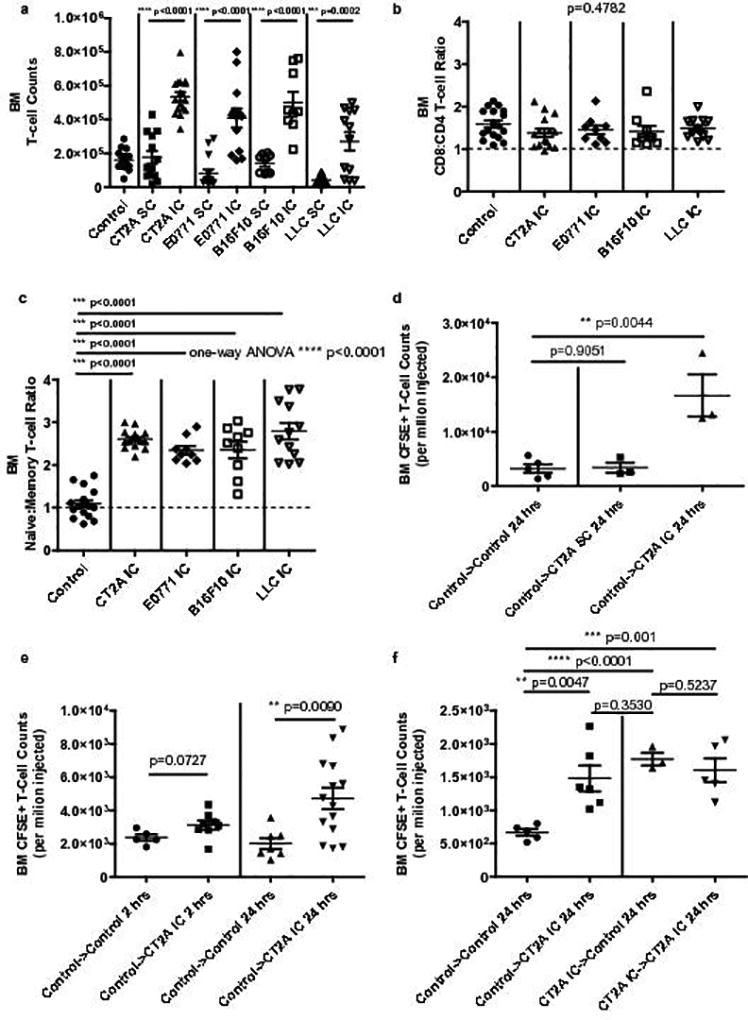
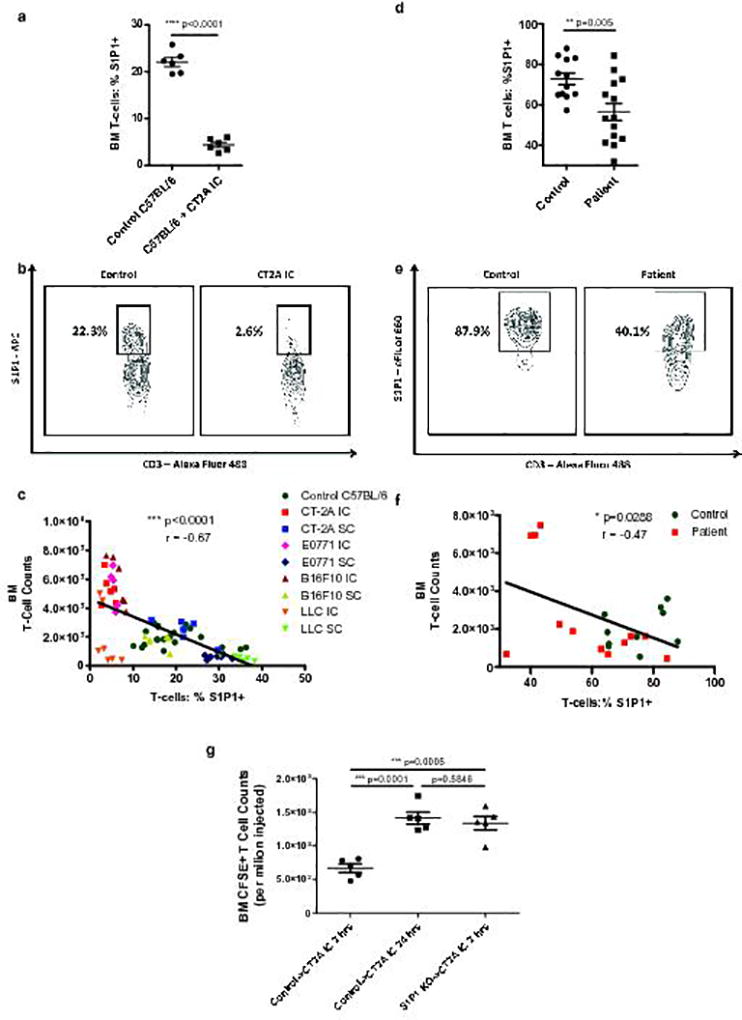
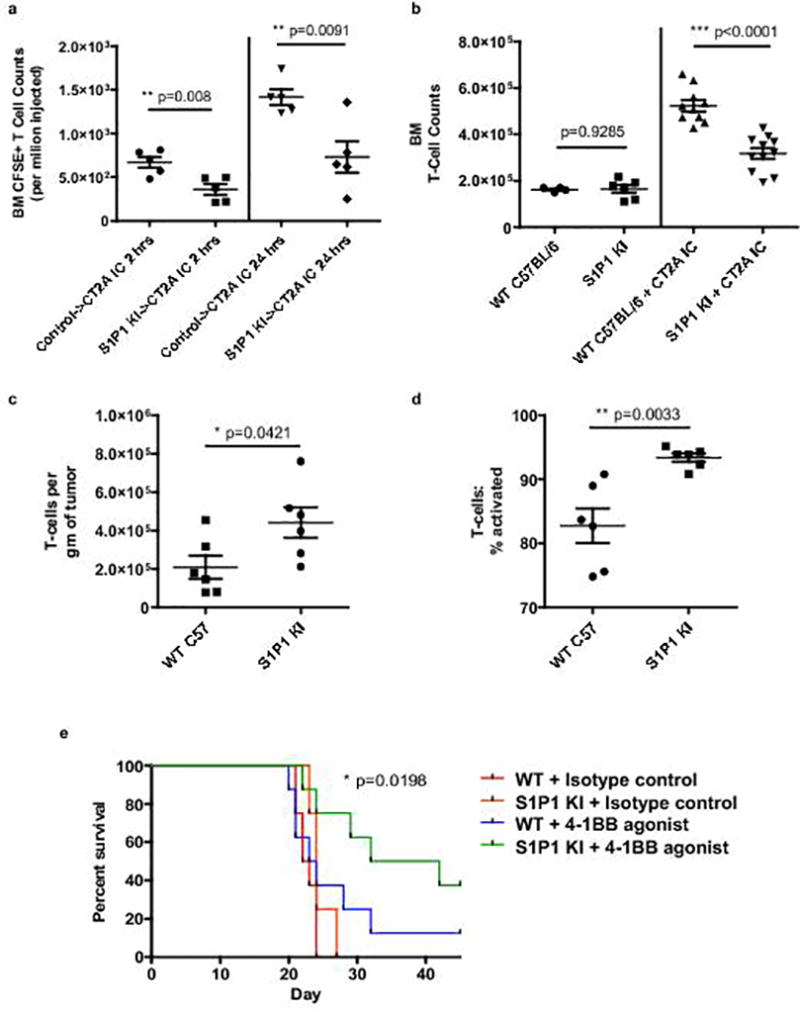
T cell dysfunction contributes to tumor immune escape in patients with cancer and is particularly severe amidst glioblastoma (GBM). Among other defects, T cell lymphopenia is characteristic, yet often attributed to treatment. We reveal that even treatment-naïve subjects and mice with GBM can harbor AIDS-level CD4 counts, as well as contracted, T cell-deficient lymphoid organs. Missing naïve T cells are instead found sequestered in large numbers in the bone marrow. This phenomenon characterizes not only GBM but a variety of other cancers, although only when tumors are introduced into the intracranial compartment. T cell sequestration is accompanied by tumor-imposed loss of S1P1 from the T cell surface and is reversible upon precluding S1P1 internalization. In murine models of GBM, hindering S1P1 internalization and reversing sequestration licenses T cell-activating therapies that were previously ineffective. Sequestration of T cells in bone marrow is therefore a tumor-adaptive mode of T cell dysfunction, whose reversal may constitute a promising immunotherapeutic adjunct.


Conflict of interest statement

COMPETING FINANCIAL INTERESTS

The authors declare no competing financial interests.

Figures

Fig. 1
Fig. 1. T-cell lymphopenia and splenic contraction in treatment-naïve patients with GBM
a, Blood CD4+ and CD8+ T-cell counts measured prospectively in n=15 newly diagnosed patients with GBM (prior to therapy) and n=13 age-matched controls. b, Spleen volume on abdominal CT scans performed on n=278 newly diagnosed treatment-naïve patients with GBM and n=43 age-matched controls. All data in a–b are shown as mean ± s.e.m. P values were determined by two-tailed, unpaired Student’s t-test.
Fig. 2
Fig. 2. Recapitulated T-cell lymphopenia and lymphoid organ contraction in murine glioma
a, Blood CD4 T-cell counts in n=8 control C57BL/6 and n=5 control VM/Dk mice, or n=9 IC CT2A glioma-bearing C57BL/6 mice and n=10 SMA-560 glioma-bearing VM/Dk mice. b, Blood CD8 T-cell counts in n=8 control C57BL/6 and n=5 control VM/Dk mice, or n=9 intracranial (IC) CT2A glioma-bearing C57BL/6 mice and n=9 SMA-560 glioma-bearing VM/Dk mice. Data in a–b are shown as mean ± s.e.m. P values were determined by two-tailed, unpaired Student’s t-test. c, Gross image depicting spleens taken from unimplanted or IC CT2A glioma-bearing C57BL/6 mice. d, Hematoxylin & eosin (H&E) staining (upper panel) or immuno-histochemistry (IHC) for CD3 (lower panel) of formalin-fixed paraffin-embedded (FFPE) spleen taken from unimplanted or IC CT2A glioma-bearing C57BL/6 mice. Histopathologic examination of spleens from IC CT2A mice showed diminution in T-dependent lymphoid areas. These findings accompanied marked organ lymphopenia and lymphoid necrosis. IHC confirmed spleens of IC CT2A mice had marked T-cell lymphopenia, scale bar = 200 µm. All data in a–d are representative findings from one of at least three independently repeated experiments with similar results. Blood (a–b) was drawn and spleens (c–d) were harvested at 18 days following tumor implantation.
Fig. 3
Fig. 3. Naïve T-cells accumulate in the bone marrow of mice and patients with GBM
a, Bone marrow T-cell counts from a single hind leg femur and tibia in n=4 control C57BL/6 and n=8 control VM/Dk mice, or n=13 IC CT2A glioma-bearing C57BL/6 mice and n=14 SMA-560 glioma-bearing VM/Dk mice. b, Bone marrow CD4+ and CD8+ T-cell counts in n=4 control C57BL/6 or n=13 IC CT2A mice. c, Bone marrow naïve and memory CD4+ T-cell counts in n=3 control C57BL/6 or n=13 IC CT2A mice. Cumulative data from three experiments are depicted in a–c. d, The ratio of bone marrow to blood CD4 and CD8 counts were calculated for n=15 treatment-naïve GBM patients and n=13 spinal fusion controls. e, For the same n=13 controls and n=15 GBM patients, paired absolute CD4+ T-cell counts in blood and bone marrow are depicted. Median counts in each compartment are identified by horizontal lines. Dashed line demarcates low cut-off of normal CD4 range. Similar results were obtained for CD8+ T-cells. f, For the same n=13 controls and n=15 GBM patients, the ratio of bone marrow to blood naïve and memory T-cells was calculated. g, Regulatory T-cells (Treg) counts in the bone marrow of n=11 controls compared to n=15 GBM patients. h, Relative frequencies of CD4+ T-helper cell subsets: Th1 (CXCR3+CCR6), Th2 (CXCR3CCR6), Th17 (CXCR3CCR6+) in bone marrow of n=13 controls and n=15 GBM patients. Data in a–d, f–h are shown as mean ± s.e.m. P values were determined by two-tailed, unpaired Student’s t-test (a–c,g–h) and two-tailed, Mann Whitney test with Gaussian approximation (d, f). Blood and bone marrow CD4+ T-cell counts in e were compared using Wilcoxon matched-pairs signed rank tests, P values are depicted.
Fig. 4
Fig. 4. T-cell accumulation in bone marrow reflects intracranial tumor location rather than tumor histologic type
a, Bone marrow T-cell counts in n=13 SC and n=17 IC CT2A glioma-bearing C57BL/6 mice, or n=15 SC and n=13 IC E0771 breast carcinoma-bearing mice, or n=9 SC and n=9 IC B16F10 melanoma-bearing mice, or n=13 SC and n=12 IC Lewis Lung carcinomas (LLC)-bearing mice. b, CD8:CD4 ratios in the bone marrow of n=15 IC CT2A, n=9 IC E0771, n=9 IC B16F10, or n=12 IC LLC-bearing mice. c, Naïve:Memory T-cells ratios in the bone marrow of the same tumor-bearing mice as in b. Counts and ratios in a–c were compared to those in the bone marrow of n=17 control C57BL/6 mice. Data in a–c are cumulative results from a minimum of two experiments with each tumor type. d, Accumulation of adoptively transferred CFSE-labeled T-cells in the bone marrow of n=5 recipient control C57BL/6 or CT2A glioma-bearing C57BL/6 mice. Glioma bearing mice harbored tumor in either the IC or SC compartment (n=3 tumor-bearing mice per group). T-cell counts were assessed 24 hours following adoptive transfer. Transferred cells were splenocytes from naïve C57BL/6 (control) donors. e. Accumulation of adoptively transferred CFSE-labeled T-cells in the bone marrow of n=5 control recipient mice and n= 8 IC CT2A-bearing (CT2A IC) recipient mice at 2 hours (left) post-transfer, or n=7 control recipient mice and n=14 IC CT2A-bearing (CT2A IC) recipient mice at 24 hours (right) post-transfer. Transferred cells were splenocytes from naïve C57BL/6 (control) donors. f. Accumulation of adoptively transferred CFSE-labeled T-cells in the bone marrow of n=5 control recipient mice and n=6 CT2A IC recipient mice 24 hours after transfer (left). Transferred cells were splenocytes from naïve C57BL/6 (control) donors. Accumulation of adoptively transferred CFSE-labeled T-cells in the bone marrow of n=3 control recipient mice and n=5 CT2A IC recipient mice 24 hours after transfer (right). Transferred cells were bone marrow cells from CT2A IC mice. Data in d–f are representative findings from one of a minimum of two independently repeated experiments with similar results. All data in a–f are shown as mean ± s.e.m. P values in a, d–f were determined by two-tailed, unpaired Student’s t-test. Ratios in b, c were compared using one-way ANOVA, with post hoc Tukey’s test when applicable. P values are depicted.
Fig. 5
Fig. 5. Loss of surface S1P1 on T-cells directs their sequestration in bone marrow in the setting of intracranial tumor
a, The percentage of nascent T-cells expressing surface S1P1 was assessed by flow cytometry in the bone marrow of n=6 control C57BL/6 mice or n=6 mice bearing IC CT2A on Day 18 following tumor implantation. b, Representative flow cytometry plot of data depicted in a. c, Negative correlation between bone marrow T-cell counts and S1P1 levels on bone marrow T-cells across IC and SC murine tumor models. Data in c were obtained from n=6 IC CT2A, n=5 IC E0771, n=6 IC B16F10, n=7 IC LLC, n=6 SC CT2A, n=7 SC E0771, n=6 SC B16F10, and n=7 SC LLC tumor-bearing mice. N=21 control C57BL/6 were also included. Data in c are cumulative results from a minimum of two experiments with each tumor type. d, The percentage of nascent T-cells expressing surface S1P1 was assessed by flow cytometry in the bone marrow of n=14 GBM patients or n=12 age-matched controls. e, Representative flow cytometry plot of data depicted in d. f, Negative correlation between bone marrow T-cell counts and surface S1P1 levels on bone marrow T-cells in n=12 GBM patients and n=10 age-matched controls. g, Relative sequestration of adoptively transferred CFSE-labeled T-cells within the bone marrow of IC CT2A recipient mice either 2 or 24 hours after transfer (n=5 mice per group). As indicated, transferred cells were splenocytes from either control C57BL/6 donors (control) or from S1P1 conditional knockout (S1P1 KO) donors. Data in g are representative findings from one of a minimum of two independently repeated experiments with similar results. All data in a, d, and g are shown as mean ± s.e.m. P values in a, d, and g were determined by two-tailed, unpaired Student’s t-test. Two-tailed, p values and Pearson coefficients for c, f are depicted.
Fig. 6
Fig. 6. Hindering S1P1 internalization abrogates T-cell sequestration in bone marrow
a, Relative sequestration of adoptively transferred CFSE-labeled T-cells within the bone marrow of CT2A IC recipient mice at 2 hours (left) or 24 hours (right) after transfer. As indicated, transferred cells were splenocytes from either control C57BL/6 donors (control) or from S1P1 stabilized “knock-in” (S1P1 KI) donors (n=5 recipient mice per group). Data in a are representative findings from one of a minimum of two independently repeated experiments with similar results. b, T-cell counts in the bone marrow of n=10 IC CT2A-bearing wild type (WT) C57BL/6 or n=11 S1P1 KI mice. Counts were assessed 18 days following tumor implantation and are shown relative to baseline counts in n=6 tumor-naïve control WT or n=6 tumor-naïve S1P1 KI mice. Cumulative data from three experiments are depicted in b. c, IC CT2A tumors were harvested from n=6 WT C57BL/6 (WT) or n=6 S1P1 KI mice 18 days following tumor implantation. TIL were assessed by flow cytometry and the number of total T-cells per gram of tumor quantified. d, The frequency of activated effector (CD44hiCD62Llo) T-cells in IC CT2A tumors from the same n=6 WT C57BL/6 (WT) or n=6 S1P1 KI mice in c was also quantified. Data in c, d are representative findings from one of a minimum of three independently repeated experiments with similar results. e, C57BL/6 (WT) or S1P1 KI mice were implanted with IC CT2A tumors and treated with a 4-1BB agonist antibody or isotype control (n=8 per group). All data in a–d are shown as mean ± s.e.m. P values in a–d were determined by two-tailed, unpaired Student’s t-test. Survival in e was assessed by two-tailed generalized Wilcoxon test. P value for overall comparison is depicted.

Comment in

References

    1. Dunn GP, Bruce AT, Ikeda H, Old LJ, Schreiber RD. Cancer immunoediting: from immunosurveillance to tumor escape. Nat. Immunol. 2002;3:991–998. - PubMed
    1. Dunn GP, Old LJ, Schreiber RD. The three Es of cancer immunoediting. Annu Rev Immunol. 2004;22:329–360. - PubMed
    1. Dix AR, Brooks WH, Roszman TL, Morford LA. Immune defects observed in patients with primary malignant brain tumors. J. Neuroimmunol. 1999;100:216–232. - PubMed
    1. Dunn GP, Fecci PE, Curry WT. Cancer immunoediting in malignant glioma. Neurosurgery. 2012;71:201–222. discussion 222-203. - PubMed
    1. Fecci PE, Heimberger AB, Sampson JH. Immunotherapy for primary brain tumors: no longer a matter of privilege. Clin Cancer Res. 2014;20:5620–5629. - PMC - PubMed

Publication types