

Retinal imaging with optical coherence tomography: a biomarker in multiple sclerosis?
- PMID: 30104912
- PMCID: PMC6074809
- DOI: 10.2147/EB.S139417
Retinal imaging with optical coherence tomography: a biomarker in multiple sclerosis?
Abstract
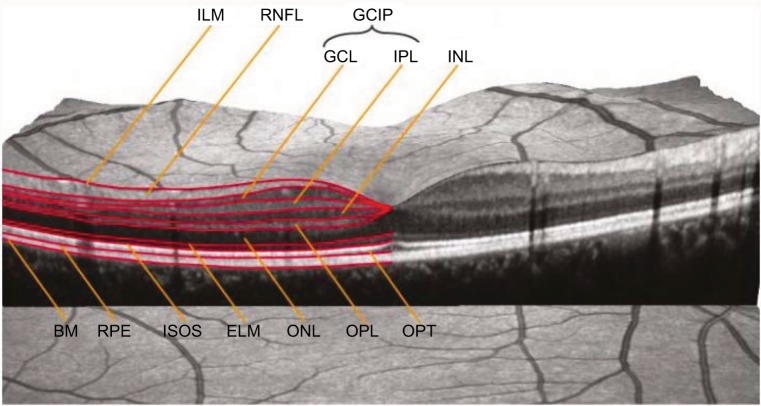
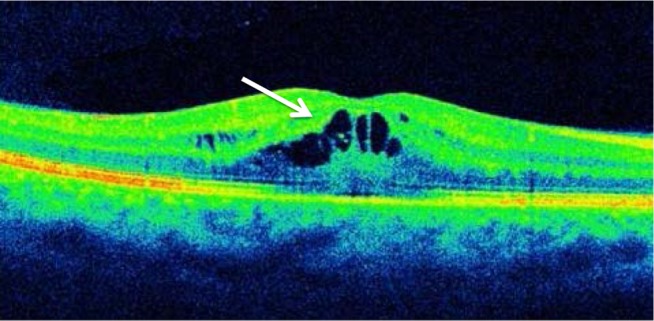
Multiple sclerosis (MS) is a progressive neurological disorder characterized by both inflammatory and degenerative components that affect genetically susceptible individuals. Currently, the cause of MS remains unclear, and there is no known cure. Commonly used therapies tend to target inflammatory aspects of MS, but may not halt disease progression, which may be governed by the slow, subclinical accumulation of injury to neuroaxonal structures in the central nervous system (CNS). A recognized challenge in the field of MS relates to the need for better methods of detecting, quantifying, and ameliorating the effects of subclinical disease. Simply stated, better biomarkers are required. To this end, optical coherence tomography (OCT) provides highly reliable, reproducible measures of axonal damage and neuronal loss in MS patients. OCT-detected decrements in retinal nerve fiber layer thickness and ganglion-cell layer-inner plexiform layer thickness, which represent markers of axonal damage and neuronal injury, respectively, have been shown to correlate with worse visual outcomes, increased clinical disability, and magnetic resonance imaging-measured burden of disease in MS patients. Recent reports have also suggested that OCT-measured microcystic macular edema and associated thickening of the retinal inner nuclear layer represent markers of active CNS inflammatory activity. Using the visual system as a putative clinical model in MS, OCT measures of neuroaxonal structure can be correlated with functional outcomes to help us elucidate mechanisms of CNS injury and repair. In this review, we evaluate evidence from the published literature and ongoing clinical trials that support the emerging role of OCT in diagnosing, staging, and determining response to therapy in MS patients.
Keywords: axonal degeneration; biomarker; central nervous system inflammation; multiple sclerosis; neuronal loss; optical coherence tomography.
Conflict of interest statement
Disclosure FC has received consultancy fees from EMD Serono, Clene Nanomedicine, and PRIME. JMB has received unrestricted educational support and honoraria from Novartis, Genzyme, and EMD Serono. The authors report no other conflicts of interest in this work.
Figures
References
-
- Compston A, Coles A. Multiple sclerosis. Lancet. 2008;372:1502–1517. - PubMed
-
- Costello F, Burton J. Multiple sclerosis: eyes on the future. J Neuroophthalmol. 2018;38:81–84. - PubMed
-
- Thompson AJ, Banwell BL, Barkof F, et al. Diagnosis of multiple sclerosis: 2017 revisions of the McDonald criteria. Lancet Neurol. 2018;17:162–173. - PubMed
Publication types
LinkOut - more resources
Full Text Sources
Other Literature Sources
