. 2018 Jul 30:9:1686.
doi: 10.3389/fimmu.2018.01686. eCollection 2018.

ASAP - A Webserver for Immunoglobulin-Sequencing Analysis Pipeline

Affiliations

ASAP - A Webserver for Immunoglobulin-Sequencing Analysis Pipeline

Oren Avram et al. Front Immunol. .

Abstract

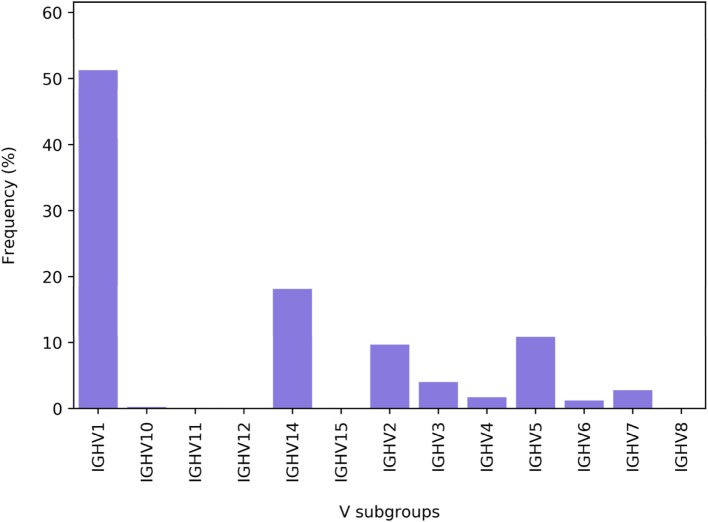
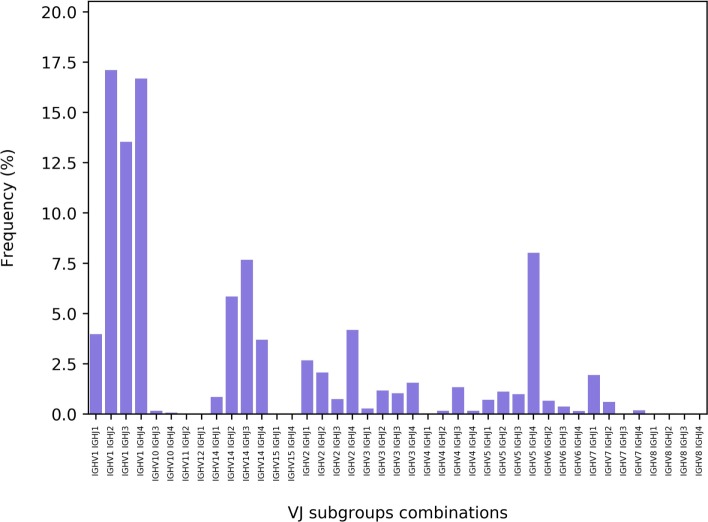
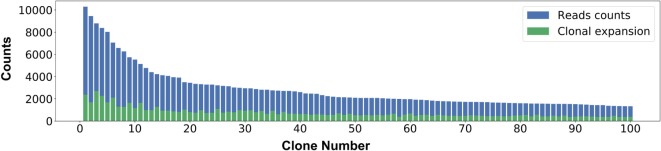
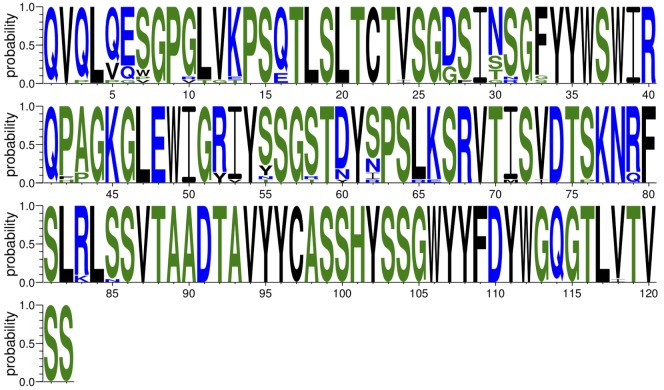
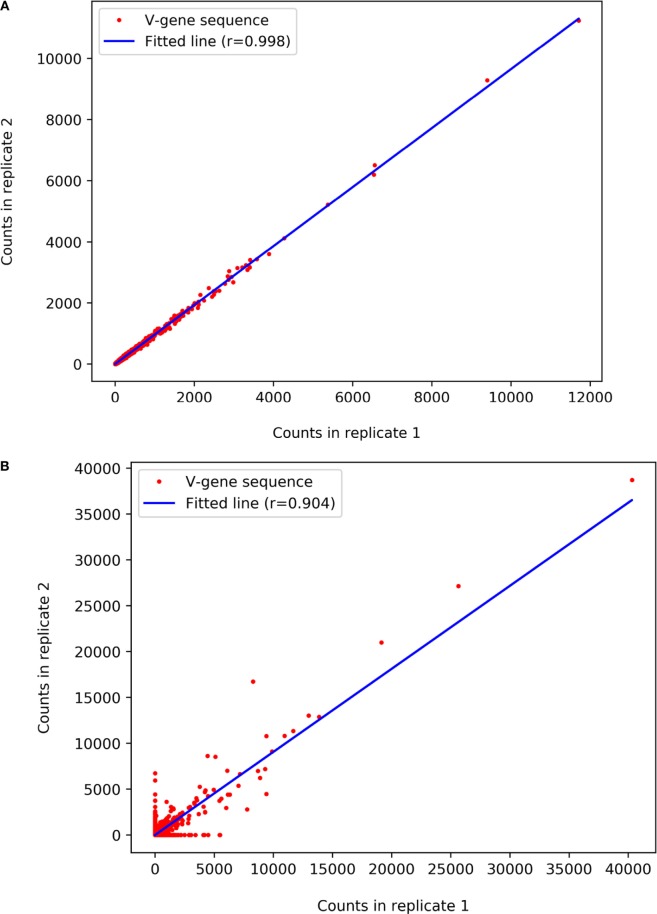
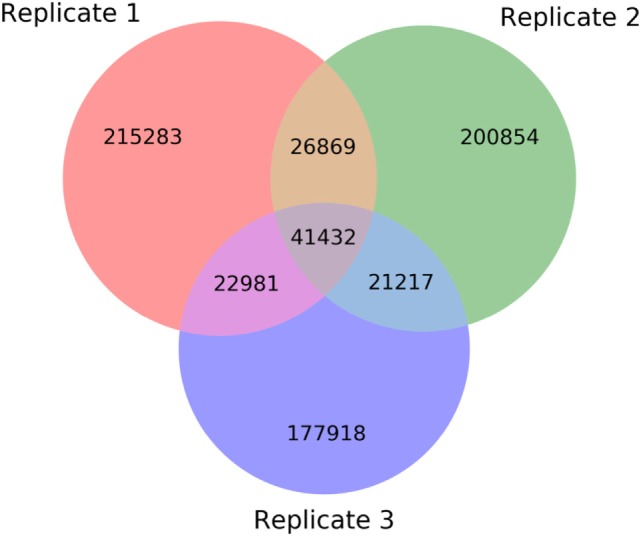
Reproducible and robust data on antibody repertoires are invaluable for basic and applied immunology. Next-generation sequencing (NGS) of antibody variable regions has emerged as a powerful tool in systems immunology, providing quantitative molecular information on antibody polyclonal composition. However, major computational challenges exist when analyzing antibody sequences, from error handling to hypermutation profiles and clonal expansion analyses. In this work, we developed the ASAP (A webserver for Immunoglobulin-Seq Analysis Pipeline) webserver (https://asap.tau.ac.il). The input to ASAP is a paired-end sequence dataset from one or more replicates, with or without unique molecular identifiers. These datasets can be derived from NGS of human or murine antibody variable regions. ASAP first filters and annotates the sequence reads using public or user-provided germline sequence information. The ASAP webserver next performs various calculations, including somatic hypermutation level, CDR3 lengths, V(D)J family assignments, and V(D)J combination distribution. These analyses are repeated for each replicate. ASAP provides additional information by analyzing the commonalities and differences between the repeats ("joint" analysis). For example, ASAP examines the shared variable regions and their frequency in each replicate to determine which sequences are less likely to be a result of a sample preparation derived and/or sequencing errors. Moreover, ASAP clusters the data to clones and reports the identity and prevalence of top ranking clones (clonal expansion analysis). ASAP further provides the distribution of synonymous and non-synonymous mutations within the V genes somatic hypermutations. Finally, ASAP provides means to process the data for proteomic analysis of serum/secreted antibodies by generating a variable region database for liquid chromatography high resolution tandem mass spectrometry (LC-MS/MS) interpretation. ASAP is user-friendly, free, and open to all users, with no login requirement. ASAP is applicable for researchers interested in basic questions related to B cell development and differentiation, as well as applied researchers who are interested in vaccine development and monoclonal antibody engineering. By virtue of its user-friendliness, ASAP opens the antibody analysis field to non-expert users who seek to boost their research with immune repertoire analysis.

Keywords: AIRR-Seq; B cell receptor; Ig-Seq; antibodies; antibody repertoire analysis; high throughput sequencing; immune repertoire; next generation sequencing.


Figures

Figure 1
Figure 1
The diversity of antibody sequences and structures and molecular methodologies for next-generation sequencing. (A) Antibodies are comprised of two identical heavy chains and two identical light chains, each encoded on a different chromosome, both in human and in mouse. Diversity is achieved by chromosomal rearrangement, where different V, D, and J (V and J) genes are combined to construct the variable region of the heavy (light) chain of the antibody. In yellow are random nucleotides introduced during the chromosomal rearrangement process. (B) A detailed view of the variable region. Shown are the forward and reverse primers used for amplification. Several alternative primers, both forward and reverse, are used in order to capture the diversity of the variable region and its associated isotypes. The forward primers anneal to the framework 1 (FR1) region. Red regions within the primers represent adaptor sequences.
Figure 2
Figure 2
Schematic flowchart for the analysis of each next-generation sequencing replicate (individual) as well as the analyses of the entire set of replicates (joint).
Figure 3
Figure 3
A pie chart showing the distribution of isotypes in a specific next-generation sequencing (NGS) replicate. Note, this chart was generated using unpublished human NGS data.
Figure 4
Figure 4
Somatic hypermutation analysis. (A) A histogram showing the frequency of the number of base pair mutations in a next-generation sequencing replicate. The X axis represents the number of mutations (both synonymous and non-synonymous) defined by comparison to the germline genes. (B) The number of non-synonymous (Ka) and synonymous (Ks) mutations and their ratios (Ka/Ks), based on comparison to the germline genes. The Y axis is the number of mutations per codon. Each dot represents a unique variable region nucleotide sequence.
Figure 5
Figure 5
The distribution of CDR3 length (number of amino acids) in a next-generation sequencing replicate.
Figure 6
Figure 6
The distribution of V subgroups in a replicate. Shown is the distribution of the subgroup families for the heavy chain of IgG.
Figure 7
Figure 7
The distribution of the V(D)J combinations in a next-generation sequencing replicate. Shown are the frequencies of the various combinations between the V and J subgroups.
Figure 8
Figure 8
Clonal expansion. The X axis shows the most prevalent 100 clones. For each clone, the Y axis represents the number of variable region amino acid reads supporting each clone (in blue) and the number of contributing unique variable region amino acid sequences (in green).
Figure 9
Figure 9
Sequence logo of one of the top clones.
Figure 10
Figure 10
Pearson correlation between two next-generation sequencing replicates. Each dot represents a unique amino acid variable region. The X and Y axes indicate the number of times each such read appears in the first and the second replicate, respectively. (A) Replicates with high reproducibility and (B) with lower reproducibility between replicates.
Figure 11
Figure 11
Venn diagram showing the number of variable region amino acid sequences that are shared among next-generation sequencing replicates.

References

    1. Tonegawa S. Somatic generation of antibody diversity. Nature (1983) 302(5909):575–81.10.1038/302575a0 - DOI - PubMed
    1. Miho E, Yermanos A, Weber CR, Berger CT, Reddy ST, Greiff V. Computational strategies for dissecting the high-dimensional complexity of adaptive immune repertoires. Front Immunol (2018) 9:224.10.3389/fimmu.2018.00224 - DOI - PMC - PubMed
    1. Weinstein JA, Weinstein JA, Jiang N, Jiang N, White RA, White RA, et al. High-throughput sequencing of the zebrafish antibody repertoire. Science (2009) 324(5928):807–10.10.1126/science.1170020 - DOI - PMC - PubMed
    1. D’Angelo S, Ferrara F, Naranjo L, Erasmus MF, Hraber P, Bradbury ARM. Many routes to an antibody heavy-chain CDR3: necessary, yet insufficient, for specific binding. Front Immunol (2018) 9:395.10.3389/fimmu.2018.00395 - DOI - PMC - PubMed
    1. Reddy ST, Ge X, Miklos AE, Hughes RA, Kang SH, Hoi KH, et al. Monoclonal antibodies isolated without screening by analyzing the variable-gene repertoire of plasma cells. Nat Biotechnol (2010) 28(9):965–U20.10.1038/nbt.1673 - DOI - PubMed

Publication types

Substances

LinkOut - more resources