. 2018 Nov;42(5):2650-2664.
doi: 10.3892/ijmm.2018.3826. Epub 2018 Aug 14.

Upregulation of HOXA11 during the progression of lung adenocarcinoma detected via multiple approaches

Affiliations

Upregulation of HOXA11 during the progression of lung adenocarcinoma detected via multiple approaches

Xia Yang et al. Int J Mol Med. 2018 Nov.

Abstract

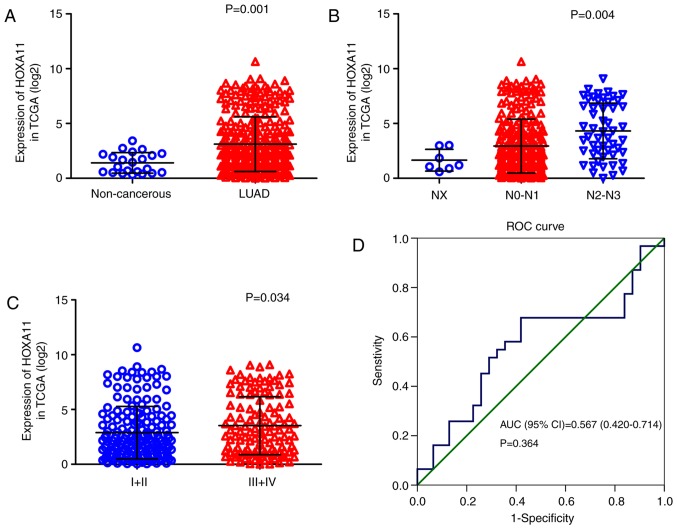
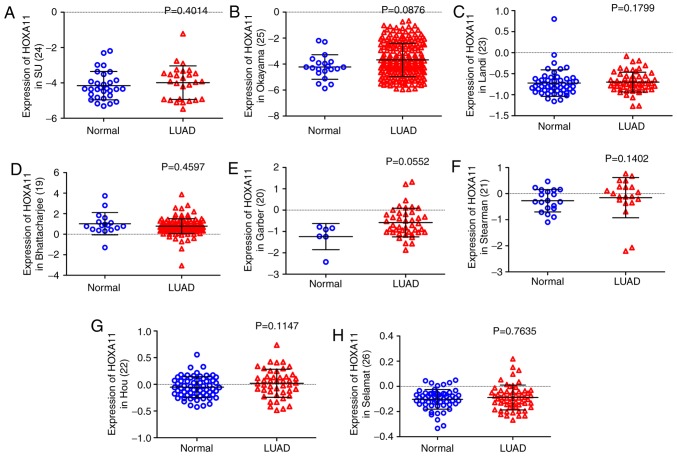
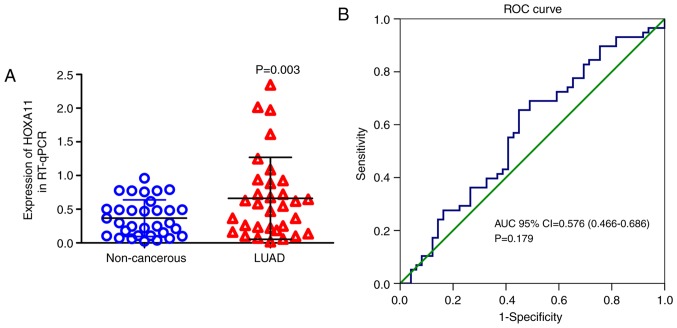
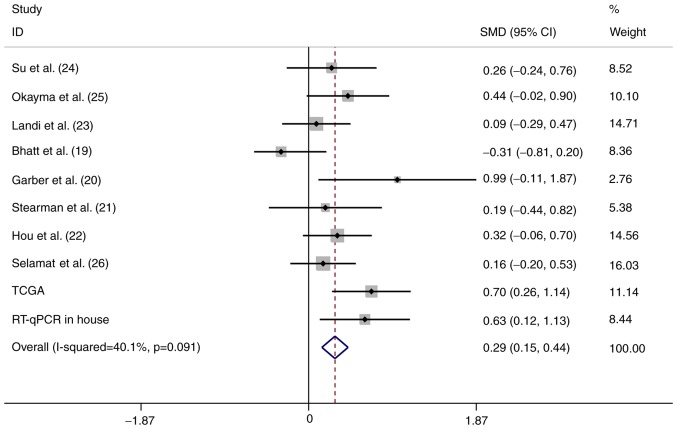
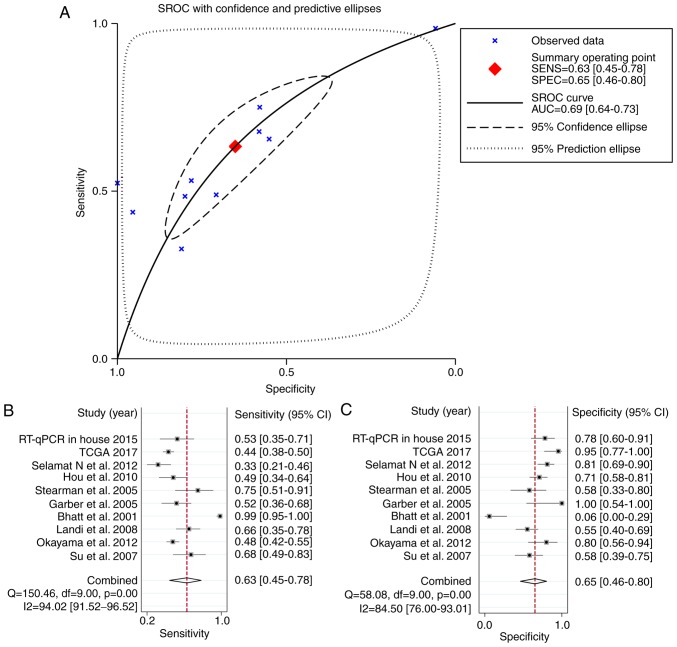
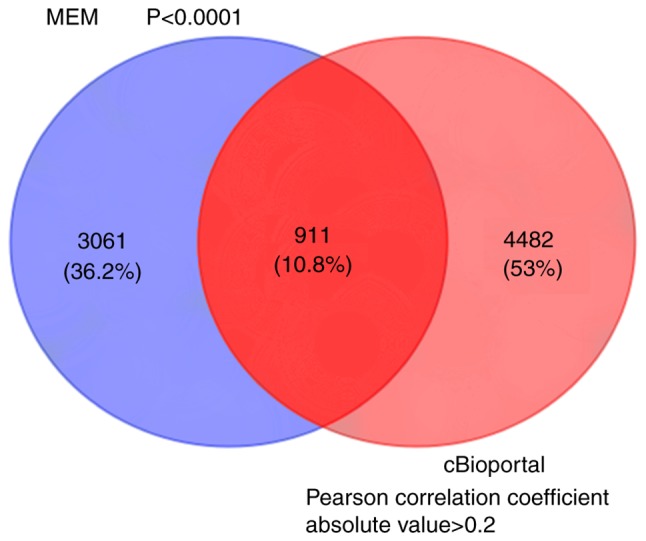
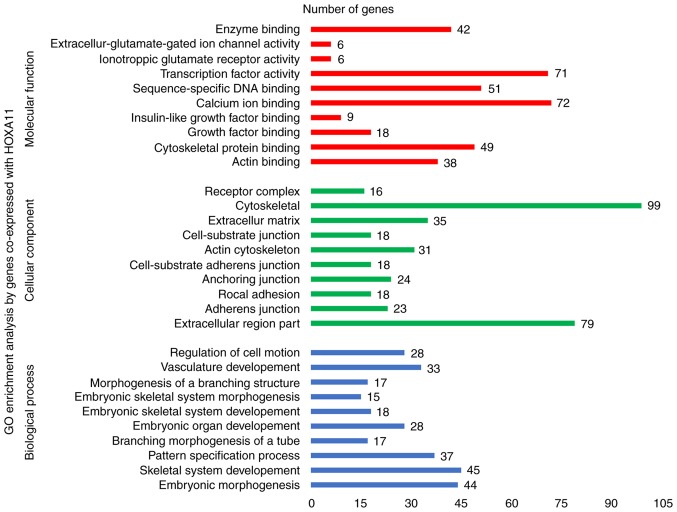
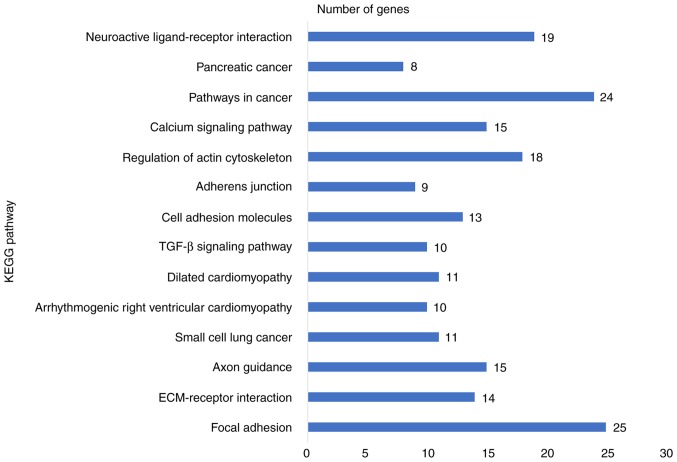
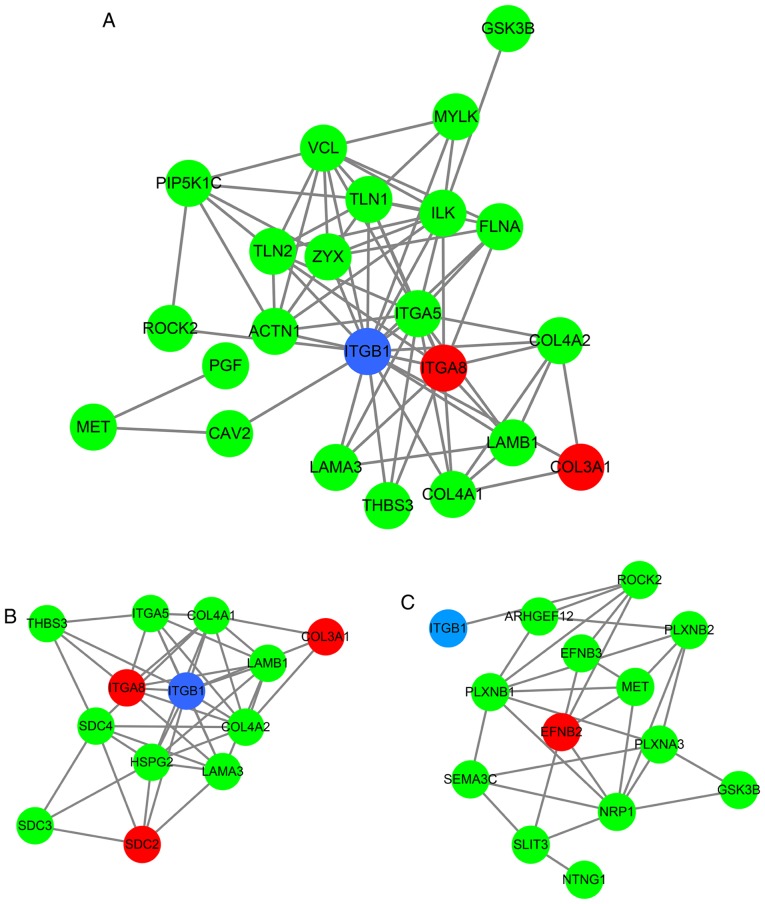
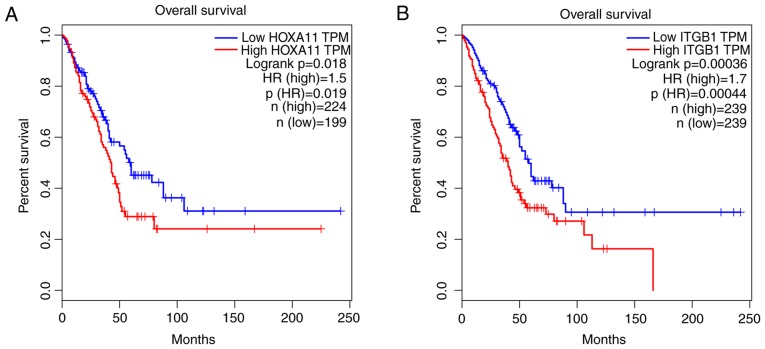
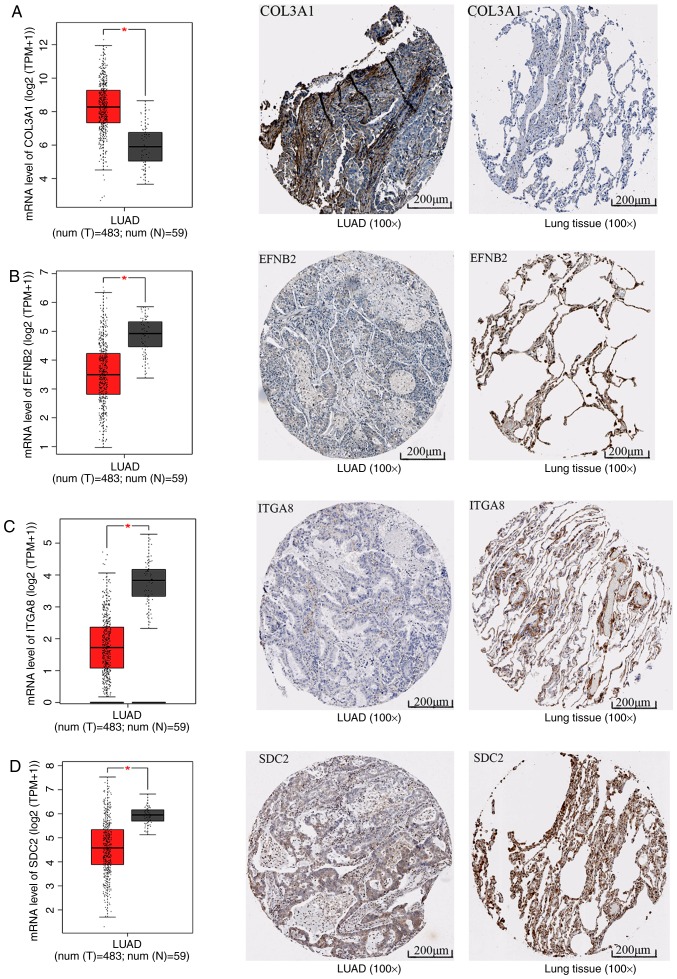
The altered expression of homeobox (HOX)A11 has been observed in various malignant tumor types, but it has remained to be determined in human lung adenocarcinoma (LUAD). In the present study, the expression of HOXA11 in LUAD and the potential associated mechanisms were assessed. Data from The Cancer Genome Atlas and Oncomine microarrays were gathered and in‑house polymerase chain reaction data were produced to investigate the altered expression of HOXA11 in LUAD and its association with various clinicopathological characteristics. Genes co‑expressed with HOXA11 were also identified by searching the cBioPortal and Multi Experiment Matrix databases, and performing a bioinformatics analysis, through which the potential molecular mechanisms of HOXA11 in LUAD were explored. The data analyses indicated that HOXA11 was overexpressed in the LUAD samples, and together with its co‑expressed genes, it was indicated to participate in various key signaling pathways, including the focal adhesion, extracellular matrix‑receptor interaction, axon guidance and small cell lung cancer signaling pathways. Furthermore, collagen type III α 1 chain (COL3A1), ephrin B2 (EFNB2), integrin subunit α 8 (ITGA8) and syndecan 2 (SDC2) were confirmed to be differentially expressed in LUAD vs. normal controls at the mRNA and protein level. Of note, LUAD patients with low expression of HOXA11 and ITGB1 had better overall survival rates. The present study indicated that HOXA11 may function as an oncogene in LUAD, and HOXA11 protein probably combines with ITGB1, COL3A1, EFNB2, ITGA8 and SDC2 to have a role in the focal adhesion pathway.


Figures

Figure 1
Figure 1
HOXA11 expression in LUAD tissues and adjacent non-cancerous lung tissues from TCGA. (A) Relative levels of HOXA11 in LUAD tissues and adjacent non-cancerous lung tissues. (B) Nodal stage. (C) Tumor-nodes-metastasis stage. (D) ROC curve. TCGA, The Cancer Genome Atlas; HOX, homeobox; AUC, area under curve; CI, confidence interval; ROC, receiver operating characteristic; LUAD, lung adenocarcinoma.
Figure 2
Figure 2
HOXA11 expression in Oncomine database microarrays. (A) Su et al (24), (B) Okayamal et al (25), (C) Landi et al (23), (D) Bhattacharjee et al (19), (E) Garber et al (20), (F) Stearman et al (21), (G) Hou et al (22) and (H) Selamat et al (26). HOX, homeobox.
Figure 3
Figure 3
HOXA11 expression determined in LUAD tissues and adjacent non-cancerous tissues obtained at our hospital by using reverse transcription- quantitative polymerase chain reaction. (A) Relative levels of HOXA11 in LUAD tissues and adjacent non-cancerous lung tissues; (B) ROC curve. HOX, homeobox; AUC, area under curve; CI, confidence interval; ROC, receiver operating characteristic; LUAD, lung adenocarcinoma.
Figure 4
Figure 4
Forest plot of the meta-analysis for HOXA11 expression in patients with lung adenocarcinoma within the 10 datasets included. The fixed-effects model was applied when combining the SMD. The grey squares represent the SMD value of each dataset; the different size of the squares reflect the weight of each study in the meta-analysis. The horizontal lines indicate the 95% confidence intervals of each study. The diamond represents the effect size (pooled SMD). SMD, standardized mean difference; CI, confidence interval; PCR, polymerase chain reaction; TCGA, The Cancer Genome Atlas; HOX, homeobox.
Figure 5
Figure 5
Diagnostic meta-analysis. (A) SROC of HOXA11 on the early diagnosis of LUAD within the 10 datasets included. (B) Sensitivity and (C) specificity analysis of the early diagnostic value of HOXA11 for LUAD with 10 datasets included. The black squares represent the sensitivity/specificity value of each dataset. The horizontal lines indicate the 95% confidence intervals of each study. The diamonds represent the effect size (pooled sensitivity/specificity). HOX, homeobox; CI, confidence interval; PCR, polymerase chain reaction; TCGA, The Cancer Genome Atlas; LUAD, lung adenocarcinoma; df, degrees of freedom; SENS, sensitivity; SPEC, specificity; SROC, summary receiver operating characteristic.
Figure 6
Figure 6
Publication bias.
Figure 7
Figure 7
Venn diagram for the integration between MEM and cBioPortal co-expression genes. MEM, Multi Expression Matrix.
Figure 8
Figure 8
GO enrichment analysis (top 10 entries) by genes co-expressed with HOXA11. GO, gene ontology; HOX, homeobox.
Figure 9
Figure 9
KEGG pathways enriched by genes co-expressed with HOXA11. KEGG, Kyoto Encyclopedia of Genes and Genomes; HOX, homeobox; TGF, transforming growth factor.
Figure 10
Figure 10
Protein-protein interaction network of the genes co-expressed with HOXA11 enriched in the top three KEGG pathways. (A) Focal adhesion, (B) extracellular matrix-receptor interaction and (C) axon guidance. Blue circle, survival associated gene in lung adenocarcinoma; red circle, gene differentially expressed between lung adenocarcinoma and normal controls; green circle, gene clustered in top three KEGG pathways; HOX, homeobox.
Figure 11
Figure 11
Overall survival analysis of lung adenocarcinoma patients stratified according to low or high HOXA11 or ITGB1 expression. (A) HOXA11 and (B) ITGB1. HOX, homeobox; HR, hazard ratio; ITGB1, integrin subunit β1; TPM, transcript per kilobase million. The median value was selected for splitting the high-expression and low-expression cohorts.
Figure 12
Figure 12
mRNA and protein levels of molecules in the top three Kyoto Encyclopedia of Genes and Genomes pathways. The box plots represent the mRNA levels of the molecules; the red boxes represent the LUAD group and the gray boxes the normal controls. The five horizontal lines in the box plots from top to bottom represent the upper limit, upper quartile, median value, lower quartile and lower limit, respectively. Each black dot represents a tissue sample. In the immunohistochemical staining images, the left panel represents LUAD and the right panel represents the normal control. (A) COL3A1, (B) EFNB2, (C) ITGA8 and (D) SDC2. *P<0.05. LUAD, lung adenocarcinoma; COL3A1, collagen type III α1 chain; EFNB2, ephrin B2; ITGA8, integrin subunit α8; SDC, syndecan.

References

    1. Hwang JA, Lee BB, Kim Y, Park SE, Heo K, Hong SH, Kim YH, Han J, Shim YM, Lee YS, Kim DH. HOXA11 hypermethylation is associated with progression of non-small cell lung cancer. Oncotarget. 2013;4:2317–2325. doi: 10.18632/oncotarget.1464. - DOI - PMC - PubMed
    1. Calvayrac O, Pradines A, Pons E, Mazières J, Guibert N. Molecular biomarkers for lung adenocarcinoma. Eur Respir J. 2017;49:1601734. doi: 10.1183/13993003.01734-2016. - DOI - PubMed
    1. Sholl LM. Biomarkers in lung adenocarcinoma: A decade of progress. Arch Pathol Lab Med. 2015;139:469–480. doi: 10.5858/arpa.2014-0128-RA. - DOI - PubMed
    1. Wallerek S, Sørensen JB. Biomarkers for efficacy of adjuvant chemotherapy following complete resection in NSCLC stages I-IIIA. Eur Respir Rev. 2015;24:340–355. doi: 10.1183/16000617.00005814. - DOI - PMC - PubMed
    1. Qi L, Li Y, Qin Y, Shi G, Li T, Wang J, Chen L, Gu Y, Zhao W, Guo Z. An individualised signature for predicting response with concordant survival benefit for lung adenocarcinoma patients receiving platinum-based chemotherapy. Br J Cancer. 2016;115:1513–1519. doi: 10.1038/bjc.2016.370. - DOI - PMC - PubMed

MeSH terms