Novel prognostic biomarkers of gastric cancer based on gene expression microarray: COL12A1, GSTA3, FGA and FGG
- PMID: 30106150
- PMCID: PMC6131538
- DOI: 10.3892/mmr.2018.9368
Novel prognostic biomarkers of gastric cancer based on gene expression microarray: COL12A1, GSTA3, FGA and FGG
Abstract
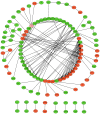
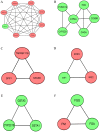
Gastric cancer (GC) is the fifth most common malignancy and the third leading cause of cancer‑associated mortality in the world. However, its mechanisms of occurrence and development have not been clearly elucidated. Furthermore, there is no effective tumor marker for GC. Using DNA microarray analysis, the present study revealed genetic alterations, screened out core genes as novel markers and discovered pathways for potential therapeutic targets. Differentially expressed genes (DEGs) between GC and adjacent normal tissues were identified, followed by pathway enrichment analysis of DEGs. Next, the protein‑protein interaction (PPI) network of DEGs was built and visualized. Analyses of modules in the PPI network were then performed to identify the functional core genes. Finally, survival analysis of core genes was conducted. A total of 256 genes were identified as DEGs between the GC samples and normal samples, including 169 downregulated and 87 upregulated genes. Through Gene Ontology (GO) and Kyoto Encyclopedia of Genes and Genomes pathway enrichment analysis, the present study identified a total of 143 GO terms and 21 pathways. Six clusters of functional modules were identified, and the genes associated with these modules were screened out as the functional core genes. Certain core genes, including collagen type 12 α1 chain (COL12A1), glutathione S‑transferase α3 (GSTA3), fibrinogen α chain (FGA) and fibrinogen γ chain (FGG), were the first reported to be associated with GC. Survival analysis suggested that these four genes, COL12A1 (P=0.002), GSTA3 (P=3.4x10‑6), FGA (P=0.00075) and FGG (P=1.4x10‑5), were significant poor prognostic factors and therefore, potential targets to improve diagnosis, optimize chemotherapy and predict prognostic outcomes.
Figures


Similar articles
-
Bioinformatics analyses of significant genes, related pathways and candidate prognostic biomarkers in glioblastoma.Mol Med Rep. 2018 Nov;18(5):4185-4196. doi: 10.3892/mmr.2018.9411. Epub 2018 Aug 21. Mol Med Rep. 2018. PMID: 30132538 Free PMC article.
-
Identification of the collagen family as prognostic biomarkers and immune-associated targets in gastric cancer.Int Immunopharmacol. 2020 Oct;87:106798. doi: 10.1016/j.intimp.2020.106798. Epub 2020 Jul 18. Int Immunopharmacol. 2020. PMID: 32693357
-
Identification of novel biomarkers, MUC5AC, MUC1, KRT7, GAPDH, CD44 for gastric cancer.Med Oncol. 2020 Mar 27;37(5):34. doi: 10.1007/s12032-020-01362-0. Med Oncol. 2020. PMID: 32219571
-
Identification of candidate biomarkers and pathways associated with SCLC by bioinformatics analysis.Mol Med Rep. 2018 Aug;18(2):1538-1550. doi: 10.3892/mmr.2018.9095. Epub 2018 May 29. Mol Med Rep. 2018. PMID: 29845250 Free PMC article.
-
Identification of Core Prognosis-Related Candidate Genes in Chinese Gastric Cancer Population Based on Integrated Bioinformatics.Biomed Res Int. 2020 Dec 11;2020:8859826. doi: 10.1155/2020/8859826. eCollection 2020. Biomed Res Int. 2020. PMID: 33381592 Free PMC article.
Cited by
-
Spatial transcriptomics reveals the heterogeneity and FGG+CRP+ inflammatory cancer-associated fibroblasts replace islets in pancreatic ductal adenocarcinoma.Front Oncol. 2023 Apr 14;13:1112576. doi: 10.3389/fonc.2023.1112576. eCollection 2023. Front Oncol. 2023. PMID: 37124494 Free PMC article.
-
Type XII collagen is elevated in serum from patients with solid tumors: a non-invasive biomarker of activated fibroblasts.Clin Exp Med. 2024 Jul 24;24(1):166. doi: 10.1007/s10238-024-01431-y. Clin Exp Med. 2024. PMID: 39048763 Free PMC article.
-
Bioinformatic analysis of potential hub genes in gastric adenocarcinoma.Sci Prog. 2021 Jan-Mar;104(1):368504211004260. doi: 10.1177/00368504211004260. Sci Prog. 2021. PMID: 33788653 Free PMC article.
-
Pan-Cancer Analysis and Validation Reveals that D-Dimer-Related Genes are Prognostic and Downregulate CD8+ T Cells via TGF-Beta Signaling in Gastric Cancer.Front Mol Biosci. 2022 Feb 22;9:790706. doi: 10.3389/fmolb.2022.790706. eCollection 2022. Front Mol Biosci. 2022. PMID: 35274004 Free PMC article.
-
Oxidative Modification Status of Human Serum Albumin Caused by Chronic Low-Dose Radiation Exposure in Mamuju, Sulawesi, Indonesia.Antioxidants (Basel). 2022 Dec 1;11(12):2384. doi: 10.3390/antiox11122384. Antioxidants (Basel). 2022. PMID: 36552593 Free PMC article.
References
-
- Allemani C, Weir HK, Carreira H, Harewood R, Spika D, Wang XS, Bannon F, Ahn JV, Johnson CJ, Bonaventure A, et al. Global surveillance of cancer survival 1995–2009: Analysis of individual data for 25,676,887 patients from 279 population-based registries in 67 countries (CONCORD-2) Lancet. 2015;385:977–1010. doi: 10.1016/S0140-6736(14)62038-9. - DOI - PMC - PubMed
MeSH terms
Substances
LinkOut - more resources
Full Text Sources
Other Literature Sources
Medical
Molecular Biology Databases
Miscellaneous

