. 2018 Aug 14:7:e36173.
doi: 10.7554/eLife.36173.

Prognostication of chronic disorders of consciousness using brain functional networks and clinical characteristics

Affiliations

Prognostication of chronic disorders of consciousness using brain functional networks and clinical characteristics

Ming Song et al. Elife. .

Abstract

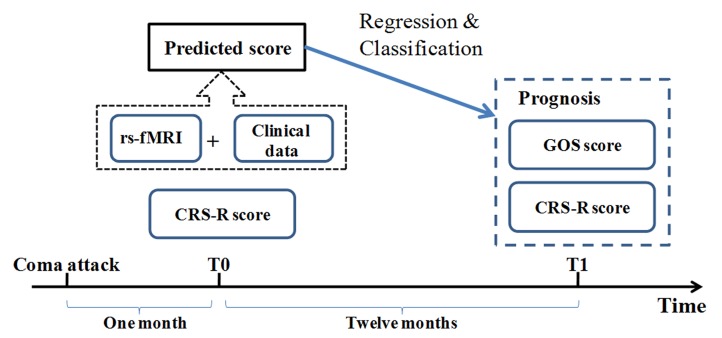
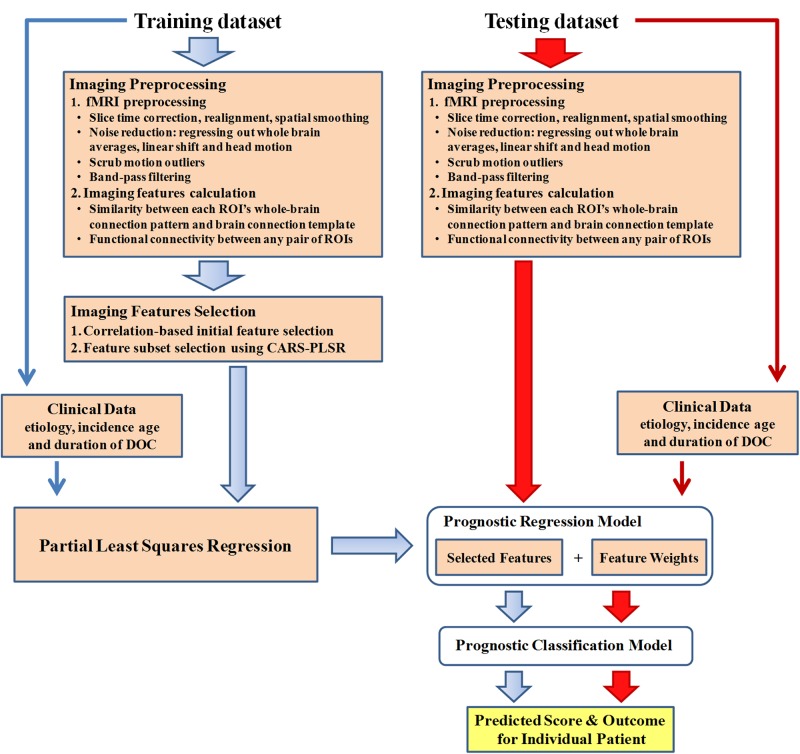
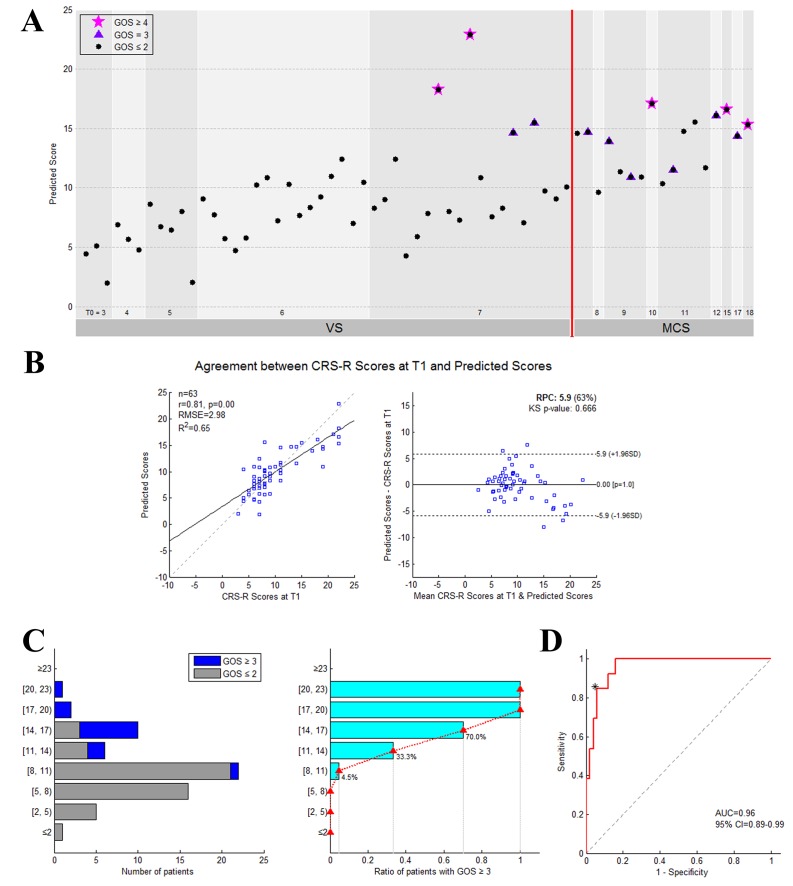
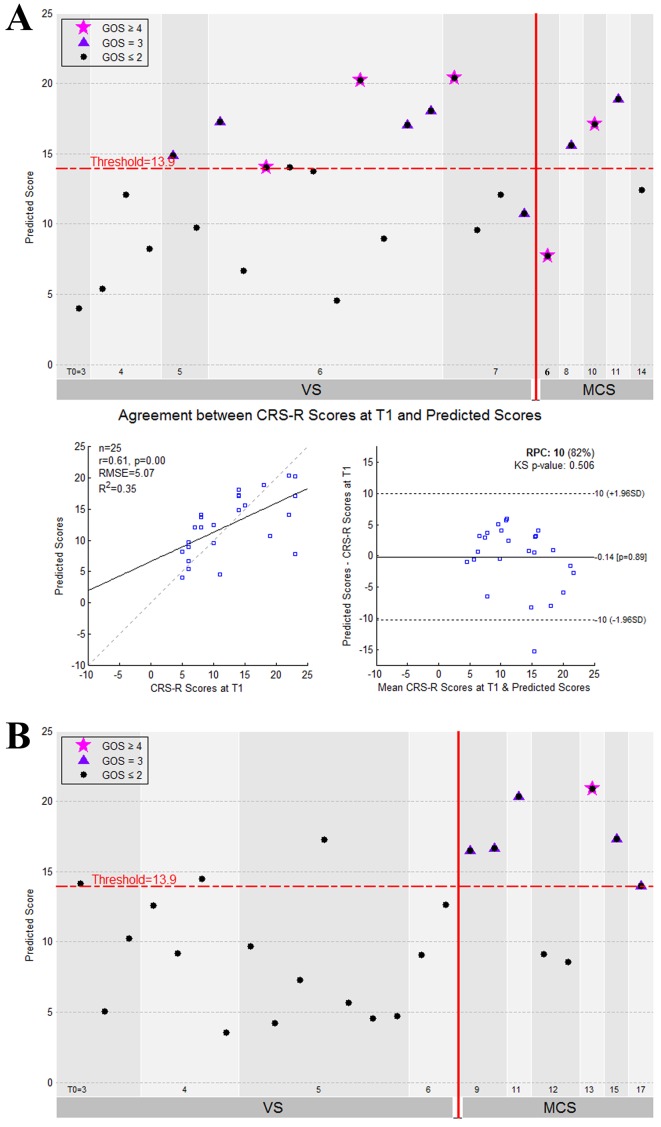
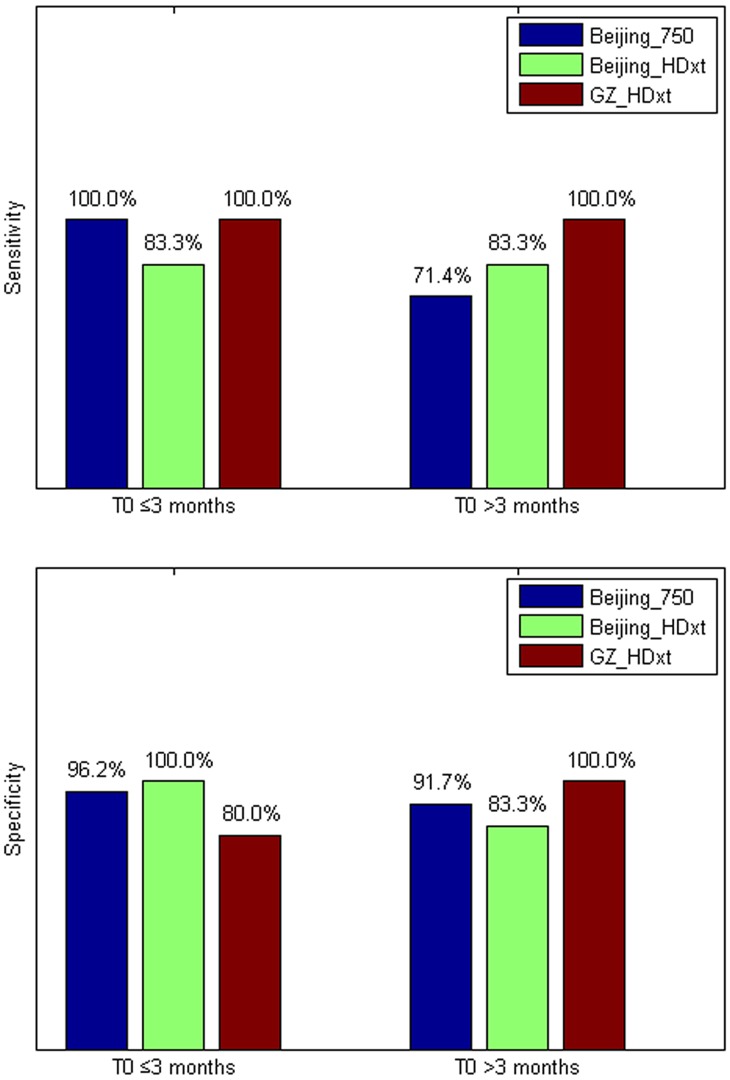
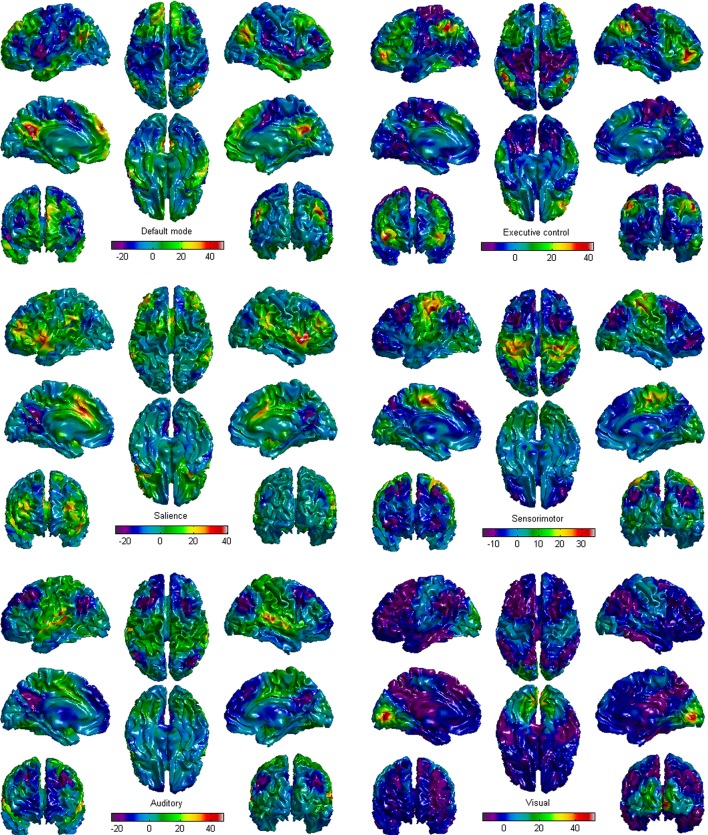
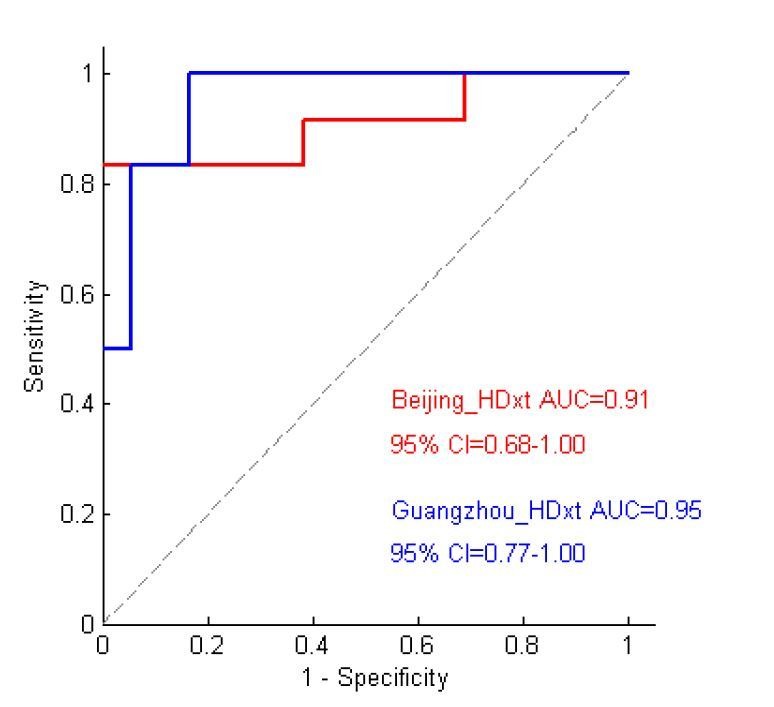
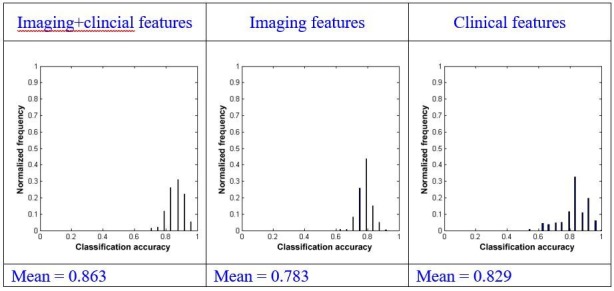
Disorders of consciousness are a heterogeneous mixture of different diseases or injuries. Although some indicators and models have been proposed for prognostication, any single method when used alone carries a high risk of false prediction. This study aimed to develop a multidomain prognostic model that combines resting state functional MRI with three clinical characteristics to predict one year-outcomes at the single-subject level. The model discriminated between patients who would later recover consciousness and those who would not with an accuracy of around 88% on three datasets from two medical centers. It was also able to identify the prognostic importance of different predictors, including brain functions and clinical characteristics. To our knowledge, this is the first reported implementation of a multidomain prognostic model that is based on resting state functional MRI and clinical characteristics in chronic disorders of consciousness, which we suggest is accurate, robust, and interpretable.

Keywords: brain; functional network; human; human biology; medicine; neural network; neuroscience.


Conflict of interest statement

MS, YY, JH, ZY, SY, QX, XX, YD, QZ, XW, YC, BH, RY, RX, TJ No competing interests declared

Figures

Figure 1.
Figure 1.. Conceptual paradigm of the study.
CRS-R: Coma Recovery Scale Revised scale; GOS: Glasgow Outcome Scale.
Figure 2.
Figure 2.. Data analysis pipeline.
All datasets involved in this study included resting state fMRI and clinical data. For the fMRI data in the training dataset, data analysis first encompassed preprocessing and imaging feature selection and extraction. Partial least square regression was then used to generate the regression model using the selected imaging features and clinical features in the training dataset. In this way, a prediction score that depicts the possibility of consciousness recovery was computed for each patient. The optimal cut-off value for classifying an individual patient as responsive or non-responsive was then calculated, and the prognostic classification model was obtained. The two testing datasets were only used to validate externally the regression and classification model.
Figure 3.
Figure 3.. Imaging features involved in the prognostic regression model.
DMN.aMPFC, anterior medial prefrontal cortex in the default mode network; DMN.PCC, posterior cingulate cortex/precuneus in the default mode network; ExecuContr.DMPFC, dorsal medial prefrontal cortex in the executive control network; Auditory.MCC, middle cingulate cortex in the auditory network; Visual.R.V1, right lateral primary visual cortex in the visual network. DMN.aMPFC—ExecuContr.DMPFC: the functional connectivity between DMN.aMPFC and ExecuContr.DMPFC; Auditory.MCC—Visual.R.V1: the functional connectivity between Auditory.MCC and Visual.R.V1.
Figure 4.
Figure 4.. Prognostic regression model.
In the three subplots, each color denotes a particular predictor. (A) Regression formula. (B) Predictor importance for each predictor in prognostic regression model. The vertical axis represents the sMC F-test value. The larger the sMC F-value, the more informative the predictor with respect to the regression model. (C) The imaging features in the model are rendered on a 3D surface plot template in medial view.
Figure 5.
Figure 5.. The performance of the prediction model on the training dataset.
(A) Individual predicted scores for each DOC patient in the training dataset. The CRS-R score at the T0 time point is shown on the x axis and the predicted score on the y axis. The patients diagnosed as VS/UWS at the T0 time point are shown to the left of the vertical red solid line, whereas the patients diagnosed as MCS at this time point are shown to the right. The purplish red pentagram, imperial purple triangle and blank circle mark the patients with a GOS score ≥4,=3 and≤2, respectively, at the T1 time point. (B) Agreement between the CRS-R scores at the T1 time point and the predicted scores. The left panel shows the correlation between the CRS-R scores at the T1 time point and the predicted scores, and the right panel shows the differences between them using the Bland-Altman plot. (C) Bar chart showing the numbers or proportions of DOC patients in each band of predicted scores. In these two panels, the y axis shows the predicted score. (D) The area under the receiver-operating characteristic (ROC) curve. The star on the curve represents the point with the maximal sum of true positive and false negative rates on the ROC curve, which were chosen as the cut-off threshold for classification. Here, the corresponding predicted score = 13.9.
Figure 6.
Figure 6.. The performance of the prediction model on the two testing datasets.
(A) The individual predicted score (top panel) and agreement between the CRS-R scores at the T1 time point and the predicted scores (bottom panel) for the testing dataset ‘Beijing HDxt’. (B) The individual predicted score for each DOC patient in the testing dataset ‘Guangzhou HDxt’. The legend description is the same as for Figure 5.
Figure 7.
Figure 7.. The sensitivity and specificity in the ‘subacute’ patients (i.e. duration of unconsciousness T0 ≤3 months) and those in the chronic phase (i.e. duration of unconsciousness T0 >3 months), respectively.
Appendix 3—figure 1.
Appendix 3—figure 1.. The six brain functional network templates in this study.
Appendix 4—figure 1.
Appendix 4—figure 1.. Cumulative distribution of head motion per volume (framewise displacement) for normal controls and DOC patients separately in the training dataset ‘Beijing 750’ (A1), the testing dataset ‘Beijing HDxt’ (A2), and the testing dataset ‘Guangzhou HDxt’ (A3).
The normal controls were shown in left column, whereas the DOC patients were shown in right column. No healthy control data were available for the Guangzhou centre. In both patients and controls, head position was stable to within 1.5 mm for the vast majority (>95%) of brain volumes.
Appendix 4—figure 2.
Appendix 4—figure 2.. Correlations between motion artifact and neuroanatomical distance between the ROIs in this study.
Prior studies have shown that motion artifacts tend to vary with neuroanatomical distance between brain nodes. Here, we conducted quality control analyses as described in the previous study (Power et al., 2015). Specifically, we computed correlations between head motion (mean FD) and each resting state functional connectivity (RSFC) feature and plotted them as a function of neuroanatomical distance (mm) for subjects in the training dataset ‘Beijing 750’ (B1), the testing dataset ‘Beijing HDxt’ (B2), and the testing dataset ‘Guangzhou HDxt’ (B3). Smoothing curves (in red) were plotted using a moving average filter.
Appendix 4—figure 3.
Appendix 4—figure 3.. Histogram of the remaining number of fMRI volumes after scrubbing for each population, specifically ‘Beijing 750’ datatset (C1), ‘Beijing HDxt’ dataset (C2), and ‘Guangzhou HDxt’ dataset (C3).
Appendix 6—figure 1.
Appendix 6—figure 1.. The brain area connection features sorted by their Pearson's correlations to the CRS-R scores at the T1 time point in the training dataset ‘Beijing 750’.
Appendix 6—figure 2.
Appendix 6—figure 2.. The functional connectivity features sorted by their Pearson's correlations to the CRS-R scores at the T1 time point across the DOC patients in the training dataset ‘Beijing 750’.
Appendix 6—figure 3.
Appendix 6—figure 3.. The Circos map for the functional connectivity features that were significantly correlated to the CRS-R scores at the T1 time point across the DOC patients in the training dataset ‘Beijing 750’.
Appendix 7—figure 1.
Appendix 7—figure 1.. Histogram depicting the imaging features included in CARS-PLSR models.
Appendix 8—figure 1.
Appendix 8—figure 1.. The imaging subscores for all of the subjects in the three datasets.
Appendix 9—figure 1.
Appendix 9—figure 1.. The distribution of the predicted imaging subscores of the healthy controls at different sites.
Appendix 9—figure 2.
Appendix 9—figure 2.. The correlations between the fMRI signal-to-noise ratio (SNR) and the predicted imaging subscores in the healthy controls.
Author response image 1.
Author response image 2.
Author response image 3.
Author response image 4.
Author response image 5.
Author response image 6.
Author response image 7.
Author response image 8.
Author response image 9.
Author response image 10.
Author response image 11.
Author response image 12.
Author response image 13.
Author response image 14.
Author response image 15.

References

    1. Bernat JL. Chronic disorders of consciousness. The Lancet. 2006;367:1181–1192. doi: 10.1016/S0140-6736(06)68508-5. - DOI - PubMed
    1. Bernat JL. Prognostic limitations of syndromic diagnosis in disorders of consciousness. AJOB Neuroscience. 2016;7:46–48. doi: 10.1080/21507740.2016.1146367. - DOI
    1. Booth CM, Boone RH, Tomlinson G, Detsky AS. Is this patient dead, vegetative, or severely neurologically impaired? assessing outcome for comatose survivors of cardiac arrest. Jama-Journal of the American Medical Association. 2004;291:870–879. doi: 10.1001/jama.291.7.870. - DOI - PubMed
    1. Bruno M-A, Ledoux D, Vanhaudenhuyse A, Gosseries O, Thibaut A, Laureys S. Prognosis of Patients with Altered State of Consciousness. In: Schnakers C, Laureys S, editors. Coma and Disorders of Consciousness. London: Springer London. 2012. pp. 11–23. - DOI
    1. Buckner RL, Andrews-Hanna JR, Schacter DL. The brain's Default Network. Annals of the New York Academy of Sciences. 2008;1124:1–38. doi: 10.1196/annals.1440.011. - DOI - PubMed

Publication types