

Developing a Topology of Syphilis in the United States
- PMID: 30106385
- PMCID: PMC6713900
- DOI: 10.1097/OLQ.0000000000000817
Developing a Topology of Syphilis in the United States
Abstract
Background: In the United States, reported rates of syphilis continue to increase. Co-occurring epidemics of syphilis among men who have sex with men (MSM) and heterosexual populations create challenges for the prioritization of resources and the implementation of context-specific interventions.
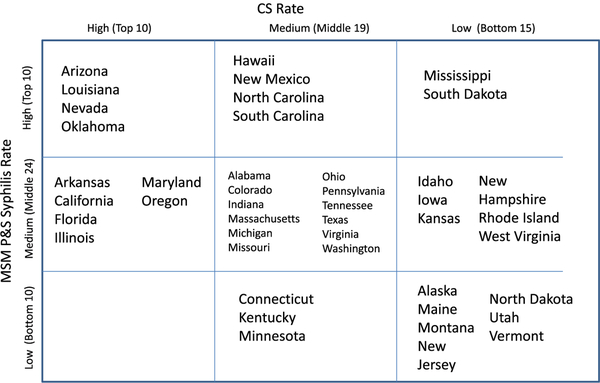
Methods: State was the unit of analysis and was restricted to the 44 states with the most complete data of sex or sex partners for their reported adult syphilis cases. States were classified as high, medium, or low for reported congenital syphilis (CS) and MSM primary and secondary (P&S) syphilis rates. Average values of a range of ecologic state level variables were examined among the 9 categories created through the cross-tabulation of CS and MSM P&S syphilis rates. Patterns among ecologic factors were assessed across the 9 categories of states' syphilis rates.
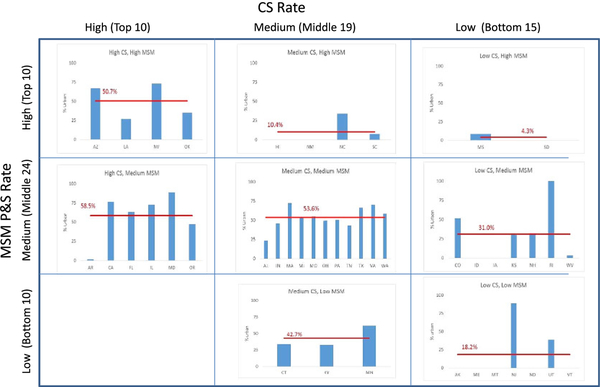
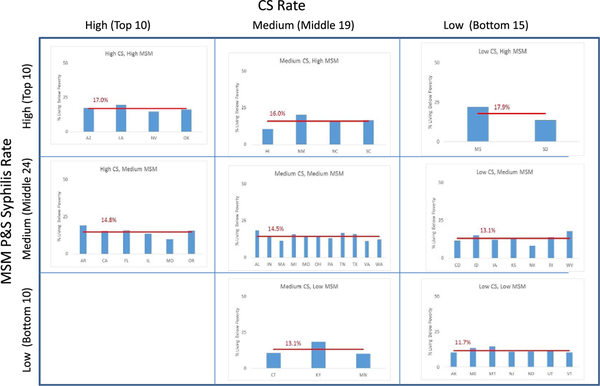
Results: Among the 44 states categorized, 4 states had high rates of both CS and MSM P&S syphilis in 2015, whereas 12 states fell into the medium/medium category and 7 into the low category. Six states had high CS and medium MSM syphilis and 4 states had medium CS but high MSM syphilis. Several area-level factors, including violent crime, poverty, insurance status, household structure and income, showed qualitative patterns with higher rates of CS and MSM P&S syphilis. Higher proportions of urban population were found among states with higher CS rates; no trend was seen with respect to urbanity and MSM P&S syphilis.
Conclusions: Several area-level factors were associated with CS and MSM P&S syphilis in similar ways, whereas other ecologic factors functioned differently with respect to the 2 epidemics. Explorations of community and area-level factors may shed light on novel opportunities for population specific prevention of syphilis.
Conflict of interest statement
No conflicts of interest to declare.
Figures
Similar articles
-
Reported Primary and Secondary Syphilis Cases in the United States: Implications for HIV Infection.Sex Transm Dis. 2018 Sep;45(9S Suppl 1):S42-S47. doi: 10.1097/OLQ.0000000000000810. Sex Transm Dis. 2018. PMID: 29465633 Free PMC article.
-
Syphilis in the United States: on the rise?Expert Rev Anti Infect Ther. 2015 Feb;13(2):161-8. doi: 10.1586/14787210.2015.990384. Epub 2014 Dec 9. Expert Rev Anti Infect Ther. 2015. PMID: 25487961 Free PMC article. Review.
-
State-Specific Rates of Primary and Secondary Syphilis Among Men Who Have Sex with Men - United States, 2015.MMWR Morb Mortal Wkly Rep. 2017 Apr 7;66(13):349-354. doi: 10.15585/mmwr.mm6613a1. MMWR Morb Mortal Wkly Rep. 2017. PMID: 28384130 Free PMC article.
-
Men who have sex with men have a 140-fold higher risk for newly diagnosed HIV and syphilis compared with heterosexual men in New York City.J Acquir Immune Defic Syndr. 2011 Dec 1;58(4):408-16. doi: 10.1097/QAI.0b013e318230e1ca. J Acquir Immune Defic Syndr. 2011. PMID: 21857351
-
Context-Appropriate Interventions to Prevent Syphilis: A Narrative Review.Sex Transm Dis. 2018 Sep;45(9S Suppl 1):S65-S71. doi: 10.1097/OLQ.0000000000000804. Sex Transm Dis. 2018. PMID: 29465640 Free PMC article. Review.
Cited by
-
Lifetime prevalence of syphilis infection among predominantly Black sexual and gender minorities living with HIV in Atlanta, Georgia: a cross-sectional analysis.Ethn Health. 2023 Feb;28(2):159-169. doi: 10.1080/13557858.2021.2007225. Epub 2021 Nov 24. Ethn Health. 2023. PMID: 34818951 Free PMC article.
-
Barriers and facilitators of participation in syphilis vaccine trials: a qualitative analysis to inform trial design and community engagement in the United States.Sex Reprod Health Matters. 2024 Dec;32(1):2473199. doi: 10.1080/26410397.2025.2473199. Epub 2025 May 2. Sex Reprod Health Matters. 2024. PMID: 40052273 Free PMC article.
-
A qualitative assessment of structural barriers to prenatal care and congenital syphilis prevention in Kern County, California.PLoS One. 2021 Apr 1;16(4):e0249419. doi: 10.1371/journal.pone.0249419. eCollection 2021. PLoS One. 2021. PMID: 33793630 Free PMC article.
-
Solitary Interdigital Condyloma Latum in a Female Adolescent: A Case Report of an Unusual Form of Secondary Syphilis.Int J Womens Health. 2023 May 18;15:793-797. doi: 10.2147/IJWH.S408853. eCollection 2023. Int J Womens Health. 2023. PMID: 37228690 Free PMC article.
-
Revival of a Beast: The Challenges Facing the Management and Control of Syphilis in Missouri from 2000 to 2024.Mo Med. 2024 Nov-Dec;121(6):474-480. Mo Med. 2024. PMID: 39697571 Free PMC article. Review.
References
-
- Centers for Disease Control and Prevention. The National Plan to Eliminate Syphilis from the United States, 1999 1999.
-
- Centers for Disease Control and Prevention (CDC). Outbreak of syphilis among men who have sex with men—Southern California, 2000. MMWR Morb Mortal Wkly Rep 2001; 50:117–120. - PubMed
-
- Centers for Disease Control and Prevention (CDC). Primary and secondary syphilis among men who have sex with men—New York City, 2001. MMWR Morb Mortal Wkly Rep 2002; 51:853–856. - PubMed
-
- Centers for Disease Control and Prevention (CDC). Primary and secondary syphilis—United States, 2000–2001. MMWR Morb Mortal Wkly Rep 2002; 51:971–973. - PubMed
MeSH terms
Supplementary concepts
Grants and funding
LinkOut - more resources
Full Text Sources
Other Literature Sources
Medical
