

Incorporation and Remodeling of Structural Allografts in Acetabular Reconstruction: Multiscale, Micro-Morphological Analysis of 13 Pelvic Explants
- PMID: 30106822
- PMCID: PMC6133218
- DOI: 10.2106/JBJS.17.01636
Incorporation and Remodeling of Structural Allografts in Acetabular Reconstruction: Multiscale, Micro-Morphological Analysis of 13 Pelvic Explants
Abstract
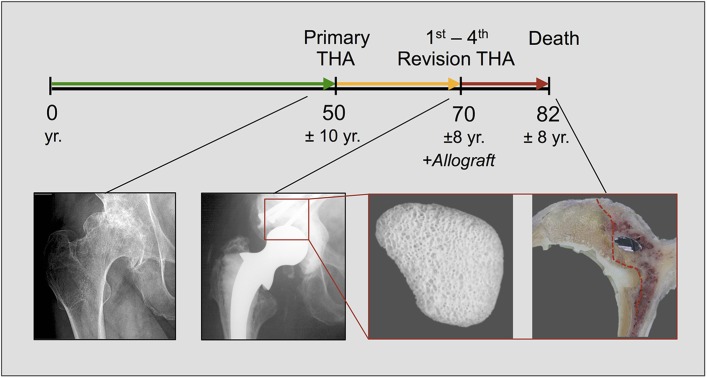
Background: Total hip arthroplasty (THA) is frequently accompanied by acetabular bone loss, which constitutes a major challenge in revision procedures. Structural allografts can be implanted to restore a stable osseous foundation for the acetabular prosthesis. As previous studies were limited to clinical data or included very few cases, the extent to which the graft bone is incorporated over time has remained unclear.
Methods: Thirteen acetabula were retrieved post mortem, and the incorporation properties of the bone allografts were analyzed using a hierarchical approach of imaging techniques including contact radiography, high-resolution peripheral quantitative computed tomography (HR-pQCT), histological analysis of undecalcified specimens, and quantitative backscattered electron imaging (qBEI). The distance between the current allograft bone and host bone borders (i.e., current overlap) as well as the distance between the original allograft bone and host bone borders (i.e., total ingrowth) were assessed.
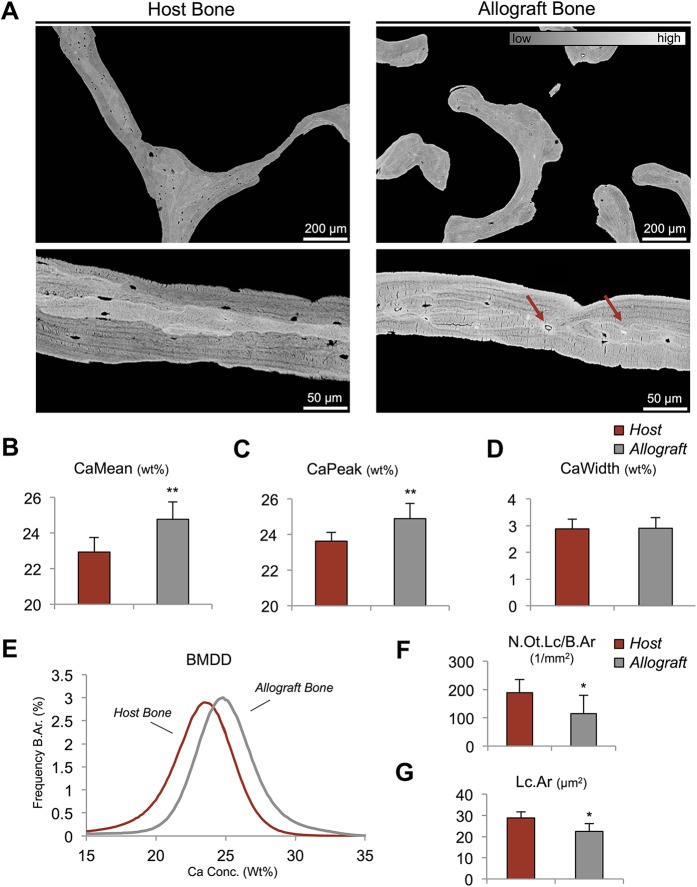
Results: In 10 of 13 cases, the complete interface (100%) was characterized by direct contact and additional overlap of the allograft bone and host bone, while the remaining 3 cases demonstrated direct contact along 25% to 80% of the interface. The allograft bone showed an intact trabecular structure and significantly higher mineralization compared with the host bone. The mean current overlap (and standard deviation) was 2.3 ± 1.0 mm, with a maximum of 5.3 ± 2.4 mm. Importantly, the total ingrowth reached much further, to a mean of 7.2 ± 2.3 mm (maximum, 10.5 ± 4.0 mm). Neither the time that the allograft was in situ nor the degree of contact between the host and allograft bone correlated with the current overlap and the time in situ did not correlate with total ingrowth.
Conclusions: This study showed bone remodeling with subsequent interconnection of the host and allograft bone along the majority of the interface, leading to adequate incorporation of the allograft. The lack of complete incorporation of the graft did not lead to graft collapse up to 22 years after revision surgery.
Clinical relevance: Our study provides the first systematic multiscale evaluation of successfully implanted structural allografts and forms the scientific basis for their clinical use in revision THA.
Figures


Similar articles
-
Allograft Chip Incorporation in Acetabular Reconstruction: Multiscale Characterization Revealing Osteoconductive Capacity.J Bone Joint Surg Am. 2021 Nov 3;103(21):1996-2005. doi: 10.2106/JBJS.20.01943. J Bone Joint Surg Am. 2021. PMID: 34228665
-
Acetabular bone defects in THA revision: Reconstruction using morsellised virus-inactivated bone allograft and reinforcement ring. Seven-year outcomes in 95 patients.Orthop Traumatol Surg Res. 2017 Jun;103(4):543-548. doi: 10.1016/j.otsr.2017.03.008. Epub 2017 Mar 30. Orthop Traumatol Surg Res. 2017. PMID: 28366746
-
Use of morselized allografts for acetabular reconstruction during THA revision: French multicenter study of 508 cases with 8 years' average follow-up.Orthop Traumatol Surg Res. 2019 Sep;105(5):957-966. doi: 10.1016/j.otsr.2019.02.025. Epub 2019 May 27. Orthop Traumatol Surg Res. 2019. PMID: 31147251
-
Acetabular bone loss in revision total hip arthroplasty: evaluation and management.J Am Acad Orthop Surg. 2013 Mar;21(3):128-39. doi: 10.5435/JAAOS-21-03-128. J Am Acad Orthop Surg. 2013. PMID: 23457063 Review.
-
Structural acetabular allograft in revision total hip arthroplasty.Am J Orthop (Belle Mead NJ). 2002 Aug;31(8):481-4. Am J Orthop (Belle Mead NJ). 2002. PMID: 12216973 Review.
Cited by
-
Histological evaluation of the incorporation and remodeling of structural allografts in critical size metaphyseal femur defects in rats of different ages.Rom J Morphol Embryol. 2022 Apr-Jun;63(2):349-356. doi: 10.47162/RJME.63.2.06. Rom J Morphol Embryol. 2022. PMID: 36374140 Free PMC article.
-
Cellular Mechanisms Responsible for Success and Failure of Bone Substitute Materials.Int J Mol Sci. 2018 Sep 23;19(10):2893. doi: 10.3390/ijms19102893. Int J Mol Sci. 2018. PMID: 30249051 Free PMC article. Review.
-
Osseointegration and Success in Hip Arthroplasty Acetabular Revision Using Structured Homologous Graft: Average 9.6 Years Follow-up.Rev Bras Ortop (Sao Paulo). 2023 Jun 29;58(3):523-531. doi: 10.1055/s-0043-1768619. eCollection 2023 Jun. Rev Bras Ortop (Sao Paulo). 2023. PMID: 37396083 Free PMC article.
-
Non-Union Treatment in the Foot, Ankle, and Lower Leg: A Multicenter Retrospective Study Comparing Conventional Treatment with the Human Allogeneic Cortical Bone Screw (Shark Screw®).J Pers Med. 2024 Mar 27;14(4):352. doi: 10.3390/jpm14040352. J Pers Med. 2024. PMID: 38672979 Free PMC article.
-
Use of structural bone allograft in revision hip arthroplasty for massive acetabular defect: A systematic review and meta-analysis.J Exp Orthop. 2025 May 3;12(2):e70241. doi: 10.1002/jeo2.70241. eCollection 2025 Apr. J Exp Orthop. 2025. PMID: 40322511 Free PMC article. Review.
References
-
- Bozic KJ, Kurtz SM, Lau E, Ong K, Vail TP, Berry DJ. The epidemiology of revision total hip arthroplasty in the United States. J Bone Joint Surg Am. 2009. January;91(1):128-33. - PubMed
-
- Pilliar RM, Lee JM, Maniatopoulos C. Observations on the effect of movement on bone ingrowth into porous-surfaced implants. Clin Orthop Relat Res. 1986. July;208:108-13. - PubMed
-
- Deirmengian GK, Zmistowski B, O’Neil JT, Hozack WJ. Management of acetabular bone loss in revision total hip arthroplasty. J Bone Joint Surg Am. 2011. October 5;93(19):1842-52. - PubMed
-
- Jasty M, Harris WH. Salvage total hip reconstruction in patients with major acetabular bone deficiency using structural femoral head allografts. J Bone Joint Surg Br. 1990. January;72(1):63-7. - PubMed
MeSH terms
LinkOut - more resources
Full Text Sources
Other Literature Sources
Medical
Research Materials
