

Neuroinflammation and ER-stress are key mechanisms of acute bilirubin toxicity and hearing loss in a mouse model
- PMID: 30106954
- PMCID: PMC6091913
- DOI: 10.1371/journal.pone.0201022
Neuroinflammation and ER-stress are key mechanisms of acute bilirubin toxicity and hearing loss in a mouse model
Abstract
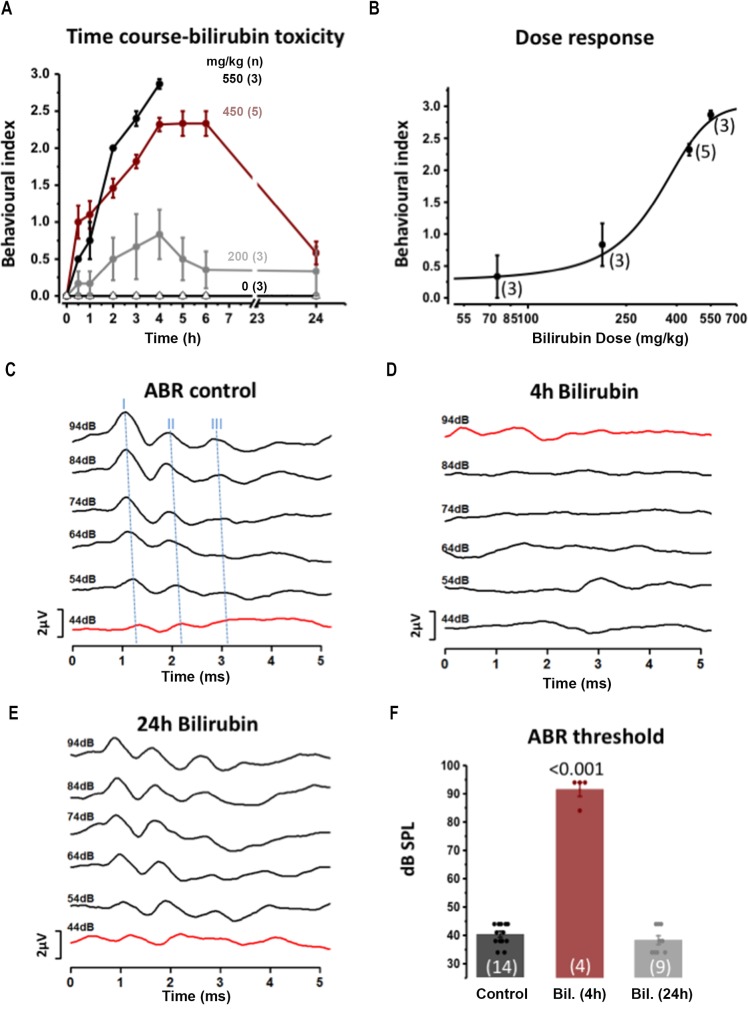
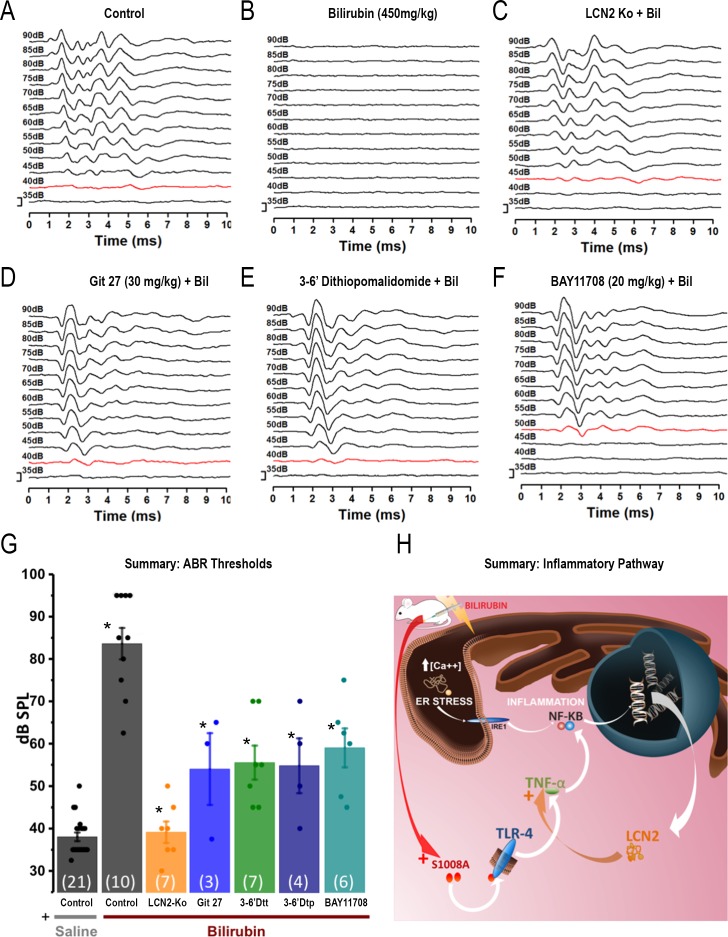
Hyperbilirubinemia (jaundice) is caused by raised levels of unconjugated bilirubin in the blood. When severe, susceptible brain regions including the cerebellum and auditory brainstem are damaged causing neurological sequelae such as ataxia, hearing loss and kernicterus. The mechanism(s) by which bilirubin exerts its toxic effect have not been completely understood to date. In this study we investigated the acute mechanisms by which bilirubin causes the neurotoxicity that contributes to hearing loss. We developed a novel mouse model that exhibits the neurological features seen in human Bilirubin-Induced Neurological Dysfunction (BIND) syndrome that we assessed with a behavioural score and auditory brainstem responses (ABR). Guided by initial experiments applying bilirubin to cultured cells in vitro, we performed whole genome gene expression measurements on mouse brain tissue (cerebellum and auditory brainstem) following bilirubin exposure to gain mechanistic insights into biochemical processes affected, and investigated further using immunoblotting. We then compared the gene changes induced by bilirubin to bacterial lipopolysaccharide (LPS), a well characterized inducer of neuroinflammation, to assess the degree of similarity between them. Finally, we examined the extent to which genetic perturbation of inflammation and both known and novel anti-inflammatory drugs could protect hearing from bilirubin-induced toxicity. The in vitro results indicated that bilirubin induces changes in gene expression consistent with endoplasmic reticulum (ER) stress and activation of the unfolded protein response (UPR). These gene changes were similar to the gene expression signature of thapsigargin-a known ER stress inducer. It also induced gene expression changes associated with inflammation and NF-κB activation. The in vivo model showed behavioural impairment and a raised auditory threshold. Whole genome gene expression analysis confirmed inflammation as a key mechanism of bilirubin neurotoxicity in the auditory pathway and shared gene expression hallmarks induced by exposure to bacterial lipopolysaccharide (LPS) a well-characterized inducer of neuroinflammation. Interestingly, bilirubin caused more severe damage to the auditory system than LPS in this model, but consistent with our hypothesis of neuroinflammation being a primary part of bilirubin toxicity, the hearing loss was protected by perturbing the inflammatory response. This was carried out genetically using lipocalin-2 (LCN2)-null mice, which is an inflammatory cytokine highly upregulated in response to bilirubin. Finally, we tested known and novel anti-inflammatory compounds (interfering with NF-κB and TNFα signalling), and also demonstrated protection of the auditory system from bilirubin toxicity. We have developed a novel, reversible, model for jaundice that shows movement impairment and auditory loss consistent with human symptoms. We used this model to establish ER-stress and inflammation as major contributors to bilirubin toxicity. Because of the rapid and reversible onset of toxicity in this novel model it represents a system to screen therapeutic compounds. We have demonstrated this by targeting inflammation genetically and with anti-inflammatory small molecules that offered protection against bilirubin toxicity. This also suggests that anti-inflammatory drugs could be of therapeutic use in hyperbilirubinemia.
Conflict of interest statement
The authors have declared that no competing interests exist.
Figures


Similar articles
-
Contribution of inflammatory processes to nerve cell toxicity by bilirubin and efficacy of potential therapeutic agents.Curr Pharm Des. 2009;15(25):2915-26. doi: 10.2174/138161209789058165. Curr Pharm Des. 2009. PMID: 19754368 Review.
-
Developmental onset of bilirubin-induced neurotoxicity involves Toll-like receptor 2-dependent signaling in humanized UDP-glucuronosyltransferase1 mice.J Biol Chem. 2014 Feb 21;289(8):4699-709. doi: 10.1074/jbc.M113.518613. Epub 2014 Jan 8. J Biol Chem. 2014. PMID: 24403077 Free PMC article.
-
Attenuation of neuro-inflammation improves survival and neurodegeneration in a mouse model of severe neonatal hyperbilirubinemia.Brain Behav Immun. 2018 May;70:166-178. doi: 10.1016/j.bbi.2018.02.011. Epub 2018 Feb 16. Brain Behav Immun. 2018. PMID: 29458193
-
Modulation of bilirubin neurotoxicity by the Abcb1 transporter in the Ugt1-/- lethal mouse model of neonatal hyperbilirubinemia.Hum Mol Genet. 2017 Jan 1;26(1):145-157. doi: 10.1093/hmg/ddw375. Hum Mol Genet. 2017. PMID: 28025333
-
Bilirubin toxicity in the developing nervous system.Pediatr Neurol. 2003 Nov;29(5):410-21. doi: 10.1016/j.pediatrneurol.2003.09.011. Pediatr Neurol. 2003. PMID: 14684236 Review.
Cited by
-
Congenital Deafness and Recent Advances Towards Restoring Hearing Loss.Curr Protoc. 2021 Mar;1(3):e76. doi: 10.1002/cpz1.76. Curr Protoc. 2021. PMID: 33780161 Free PMC article.
-
KCC2 is required for the survival of mature neurons but not for their development.J Biol Chem. 2021 Jan-Jun;296:100364. doi: 10.1016/j.jbc.2021.100364. Epub 2021 Feb 2. J Biol Chem. 2021. PMID: 33539918 Free PMC article.
-
Neuroactive steroids activate membrane progesterone receptors to induce sex specific effects on protein kinase activity.iScience. 2025 Apr 4;28(5):112352. doi: 10.1016/j.isci.2025.112352. eCollection 2025 May 16. iScience. 2025. PMID: 40292327 Free PMC article.
-
Amplitude-integrated electroencephalography improves the predictive ability of acute bilirubin encephalopathy.Transl Pediatr. 2021 Mar;10(3):647-656. doi: 10.21037/tp-21-35. Transl Pediatr. 2021. PMID: 33880334 Free PMC article.
-
Wearable Photomedicine for Neonatal Jaundice Treatment Using Blue Organic Light-Emitting Diodes (OLEDs): Toward Textile-Based Wearable Phototherapeutics.Adv Sci (Weinh). 2022 Dec;9(35):e2204622. doi: 10.1002/advs.202204622. Epub 2022 Oct 30. Adv Sci (Weinh). 2022. PMID: 36310107 Free PMC article.
References
Publication types
MeSH terms
Substances
Grants and funding
LinkOut - more resources
Full Text Sources
Other Literature Sources
Molecular Biology Databases
Miscellaneous
