. 2018 Oct;27(20):4121-4135.
doi: 10.1111/mec.14833. Epub 2018 Sep 7.

How to estimate kinship

Affiliations

How to estimate kinship

Jérôme Goudet et al. Mol Ecol. 2018 Oct.

Abstract

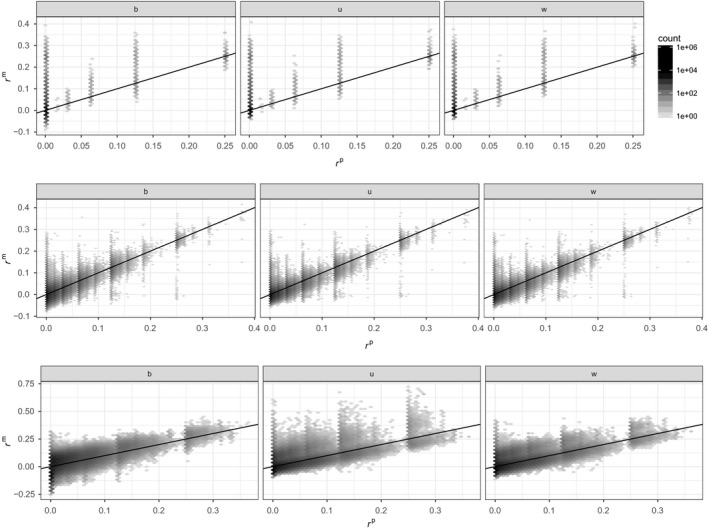
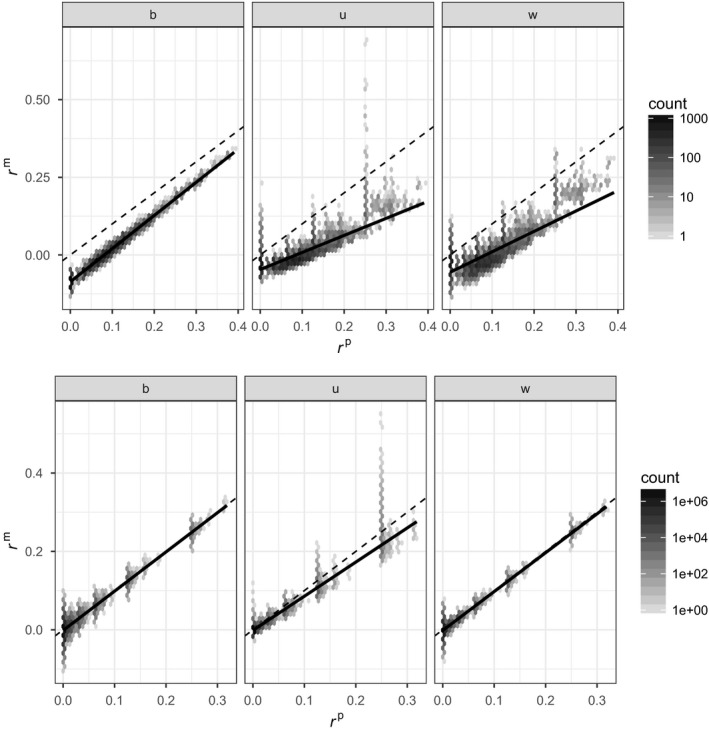
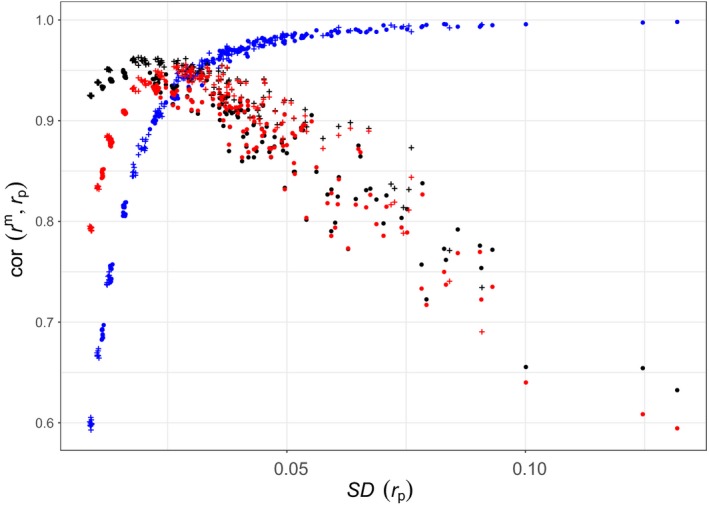
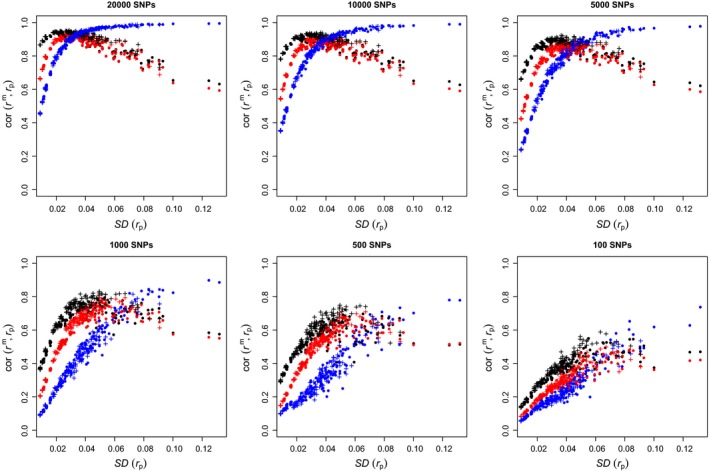
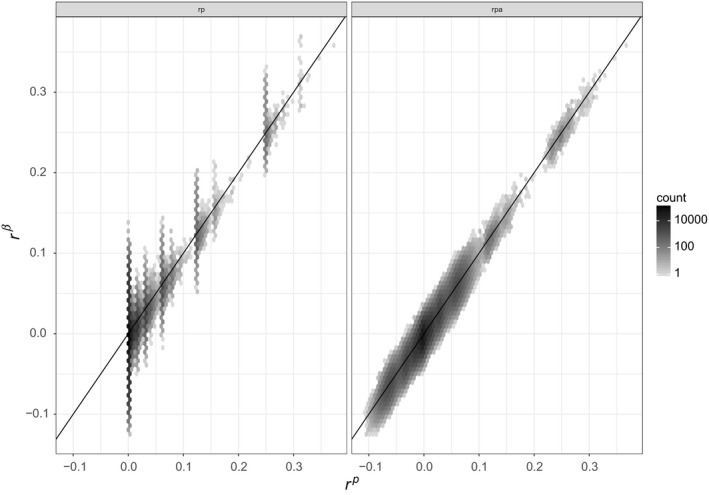
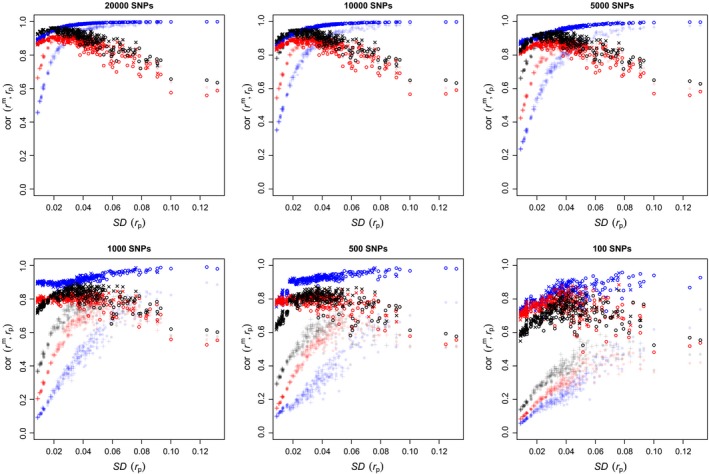
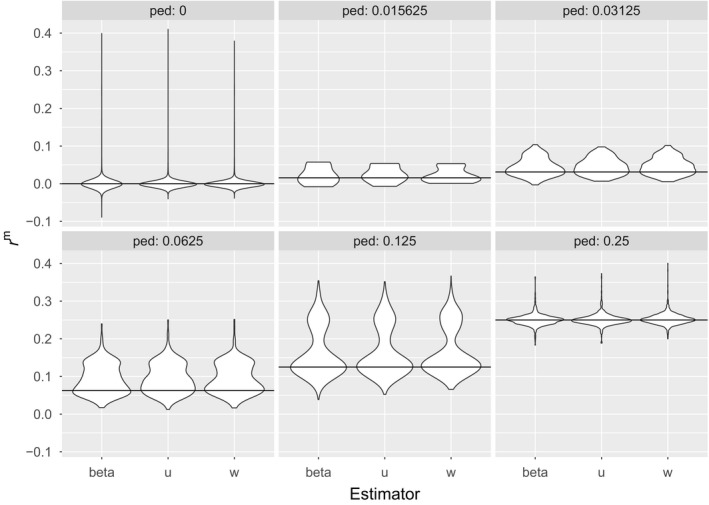
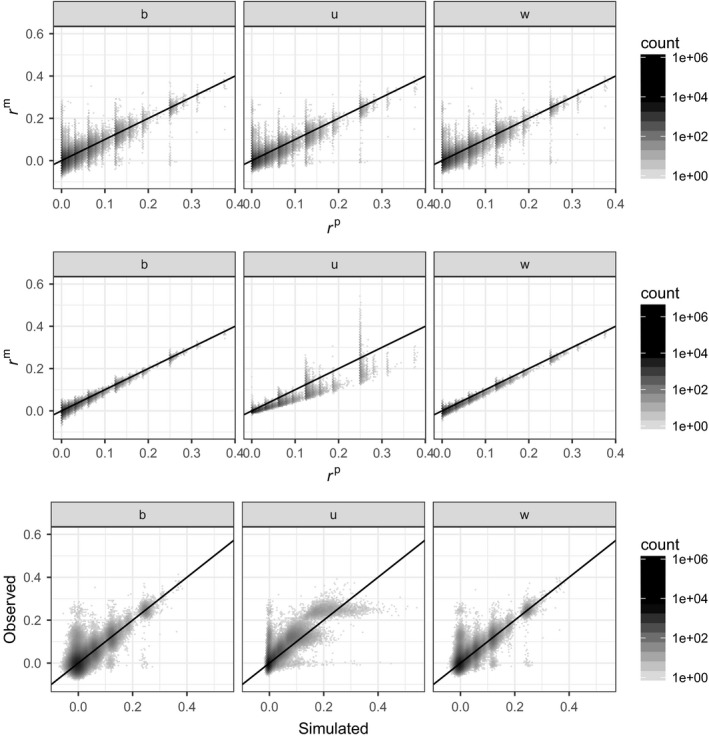
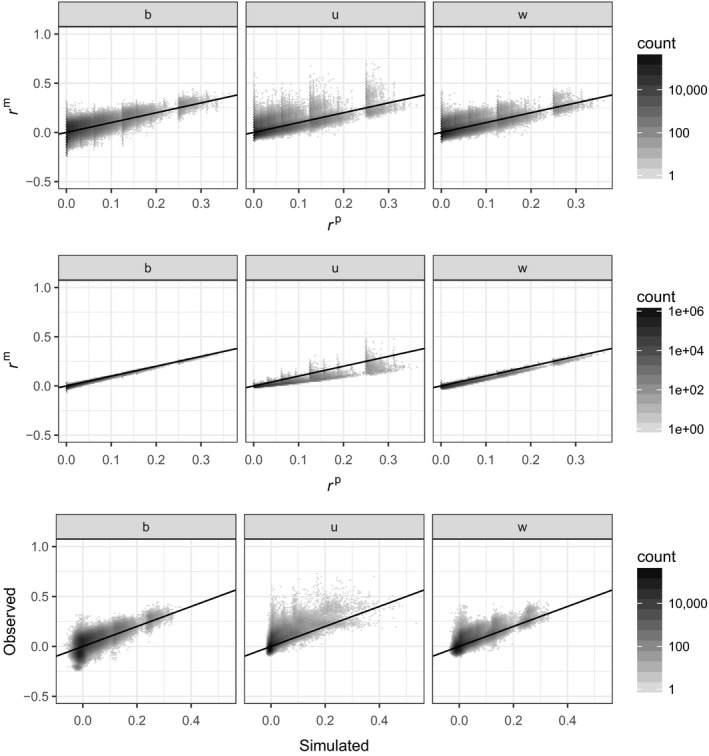
The concept of kinship permeates many domains of fundamental and applied biology ranging from social evolution to conservation science to quantitative and human genetics. Until recently, pedigrees were the gold standard to infer kinship, but the advent of next-generation sequencing and the availability of dense genetic markers in many species make it a good time to (re)evaluate the usefulness of genetic markers in this context. Using three published data sets where both pedigrees and markers are available, we evaluate two common and a new genetic estimator of kinship. We show discrepancies between pedigree values and marker estimates of kinship and explore via simulations the possible reasons for these. We find these discrepancies are attributable to two main sources: pedigree errors and heterogeneity in the origin of founders. We also show that our new marker-based kinship estimator has very good statistical properties and behaviour and is particularly well suited for situations where the source population is of small size, as will often be the case in conservation biology, and where high levels of kinship are expected, as is typical in social evolution studies.

Keywords: animal mating/breeding systems; behavior/social evolution; conservation genetics; quantitative genetics; wildlife management.


Figures

Figure 1
Figure 1
Density plot (hexagons) of marker‐based kinship estimates as a function of pedigree‐based predictions (the darker the hexagon, the more points, and density is on a log 10 scale). Top row: great tit data; middle row: Soay sheep data; and bottom row: pig data. Left column: r β; middle column: r u; and right column: r w. For all panels, the black line is the one‐to‐one relationship
Figure 2
Figure 2
Density plot (hexagons) of marker‐based kinship estimates as a function of pedigree‐based expectations (darker means more points in the hexagon, and density is on log 10 scale). Top row: monogamous mating, 20 founders; and bottom row: random mating, 750 founders. Left column (b): r β; middle column (u): r u; and right column (w): r w. Dotted line is the one‐to‐one relationship. Solid line is the regression between marker kinship and pedigree kinship
Figure 3
Figure 3
Correlation between marker‐based kinship with 42k SNPs and pedigree‐based prediction, against the standard deviation of pedigree‐based kinship. Each point corresponds to one of the 300 simulated pedigrees. Blue: r β; red: r w; and black: r u. Filled circles: monogamous pedigrees. +: random‐mating pedigrees [Colour figure can be viewed at http://wileyonlinelibrary.com]
Figure 4
Figure 4
Correlations between marker‐ and pedigree‐based kinship, against the standard deviation of pedigree‐based kinship with different numbers of SNPs. Each point corresponds to one of 300 simulated pedigrees. Symbols and colours as in Figure3 [Colour figure can be viewed at http://wileyonlinelibrary.com]
Figure 5
Figure 5
Marker kinship as a function of pedigree kinship when the founders come from two populations. Left panel: Founders are assumed unrelated (r p). Right panel: Founders kinships have been estimated from markers (rap )
Figure 6
Figure 6
A reproduction of Figure 4 reproduced (in reduced opacity) with the addition of results obtained using markers to estimate founder kinship. Blue: r β; red: r w; and black: r u. Open circles: monogamous pedigrees, where founders’ pedigree kinship was obtained from markers rather than assumed to be 0; x: random‐mating pedigrees, where founders’ pedigree kinship was obtained from markers rather than assumed to be 0. Filled circles: monogamous pedigrees. +: random‐mating pedigrees [Colour figure can be viewed at http://wileyonlinelibrary.com]
Figure 7
Figure 7
Great tit data. Violin plots of the marker‐based estimates of kinship from r β, r u and r w for each level of pedigree kinship r p = 0, (1/2)kk ∊ [6:2]. Solid lines give the pedigree kinship
Figure 8
Figure 8
Soay sheep data. Density plots (darker means the more points in the hexagon, and density is on log 10 scale). Top row: marker‐based kinship estimates against pedigree‐based predictions. Middle row: the same as top row, but for simulated genetic data, assuming all founders or unknown parents are unrelated. Bottom row: real marker estimates vs. simulated marker estimates. Left column (b): r β; middle column (u): r u; and right column (w): r w
Figure 9
Figure 9
Pig data. Density plots (darker means more points in the hexagon, and density is on log 10 scale) First row: marker‐based estimates of kinship from real data vs. pedigree kinship. b: pedigree kinship vs. r β. u: pedigree kinship vs. r u. w: pedigree kinship vs. r w. Second row: marker‐based estimates of kinship from simulated genetic data vs. pedigree‐based kinship. b: pedigree kinship vs. r β. u: pedigree kinship vs. r u. w: pedigree kinship vs. r w. Third row: real vs. simulated marker‐based kinship. β: r β. u: r u. w: r w

References

    1. Bérénos, C. , Ellis, P. A. , Pilkington, J. G. , & Pemberton, J. M. (2014). Estimating quantitative genetic parameters in wild populations: A comparison of pedigree and genomic approaches. Molecular Ecology, 23, 3434–3451. 10.1111/mec.12827 - DOI - PMC - PubMed
    1. Cai, Q. , Qian, X. , Lang, Y. , Luo, Y. , Xu, J. , Pan, S. , … Wang, J. (2013). Genome sequence of ground tit Pseudopodoces humilis and its adaptation to high altitude. Genome Biology, 14, R29. 10.1186/gb-2013-14-3-r29 . - DOI - PMC - PubMed
    1. Campos, G. D. L. , Gianola, D. , & Allison, D. B. (2010). Predicting genetic predisposition in humans: The promise ofwhole‐genome markers. Nature Reviews Genetics, 11, 880 10.1038/nrg2898 - DOI - PubMed
    1. Cleveland, M. A. , Hickey, J. M. , & Forni, S. (2012). A common dataset for genomic analysis of livestock populations. G3: Genes, Genomes, Genetics, 2, 429–435. 10.1534/g3.111.001453 - DOI - PMC - PubMed
    1. Csilléry, K. , Johnson, T. , Beraldi, D. , Clutton‐Brock, T. , Coltman, D. , Hansson, B. , … Pemberton, J. M. (2006). Performance of marker‐based relatedness estimators in natural populations of outbred vertebrates. Genetics, 173, 2091–2101. 10.1534/genetics.106.057331 - DOI - PMC - PubMed

Publication types

Substances

LinkOut - more resources