

Oral microbiome activity in children with autism spectrum disorder
- PMID: 30107083
- PMCID: PMC7775619
- DOI: 10.1002/aur.1972
Oral microbiome activity in children with autism spectrum disorder
Abstract
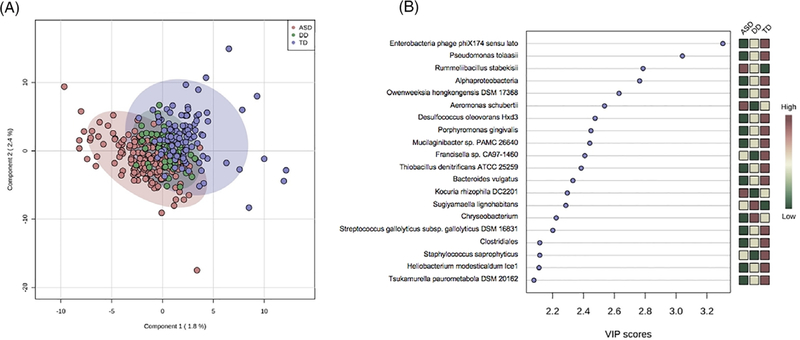
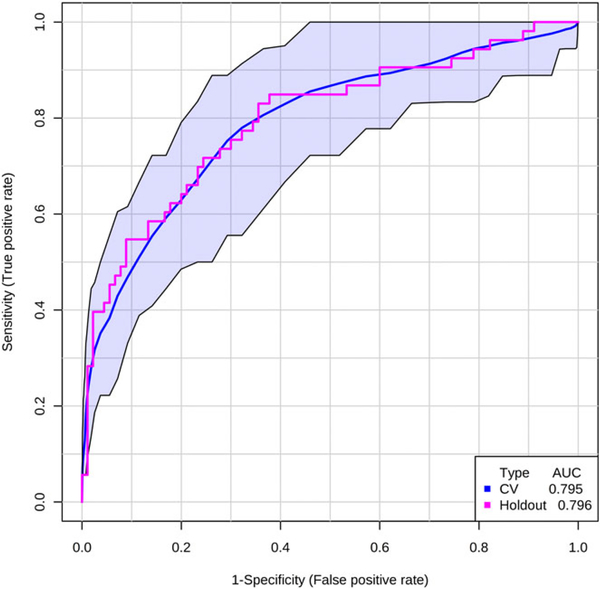
Autism spectrum disorder (ASD) is associated with several oropharyngeal abnormalities, including buccal sensory sensitivity, taste and texture aversions, speech apraxia, and salivary transcriptome alterations. Furthermore, the oropharynx represents the sole entry point to the gastrointestinal (GI) tract. GI disturbances and alterations in the GI microbiome are established features of ASD, and may impact behavior through the "microbial-gut-brain axis." Most studies of the ASD microbiome have used fecal samples. Here, we identified changes in the salivary microbiome of children aged 2-6 years across three developmental profiles: ASD (n = 180), nonautistic developmental delay (DD; n = 60), and typically developing (TD; n = 106) children. After RNA extraction and shotgun sequencing, actively transcribing taxa were quantified and tested for differences between groups and within ASD endophenotypes. A total of 12 taxa were altered between the developmental groups and 28 taxa were identified that distinguished ASD patients with and without GI disturbance, providing further evidence for the role of the gut-brain axis in ASD. Group classification accuracy was visualized with receiver operating characteristic curves and validated using a 50/50 hold-out procedure. Five microbial ratios distinguished ASD from TD participants (79.5% accuracy), three distinguished ASD from DD (76.5%), and three distinguished ASD children with/without GI disturbance (85.7%). Taxonomic pathways were assessed using the Kyoto Encyclopedia of Genes and Genomes microbial database and compared with one-way analysis of variance, revealing significant differences within energy metabolism and lysine degradation. Together, these results indicate that GI microbiome disruption in ASD extends to the oropharynx, and suggests oral microbiome profiling as a potential tool to evaluate ASD status. Autism Res 2018, 11: 1286-1299. © 2018 International Society for Autism Research, Wiley Periodicals, Inc. LAY SUMMARY: Previous research suggests that the bacteria living in the human gut may influence autistic behavior. This study examined genetic activity of microbes living in the mouth of over 300 children. The microbes with differences in children with autism were involved in energy processing and showed potential for identifying autism status.
Keywords: autism spectrum disorder; developmental delay; gastrointestinal disturbance; microbiome; oropharynx; saliva.
© 2018 International Society for Autism Research, Wiley Periodicals, Inc.
Figures
Similar articles
-
Alteration of gut microbiota-associated epitopes in children with autism spectrum disorders.Brain Behav Immun. 2019 Jan;75:192-199. doi: 10.1016/j.bbi.2018.10.006. Epub 2018 Oct 27. Brain Behav Immun. 2019. PMID: 30394313
-
Differential immune responses and microbiota profiles in children with autism spectrum disorders and co-morbid gastrointestinal symptoms.Brain Behav Immun. 2018 May;70:354-368. doi: 10.1016/j.bbi.2018.03.025. Epub 2018 Mar 20. Brain Behav Immun. 2018. PMID: 29571898 Free PMC article.
-
Changes in the Gut Microbiota of Children with Autism Spectrum Disorder.Autism Res. 2020 Sep;13(9):1614-1625. doi: 10.1002/aur.2358. Epub 2020 Aug 24. Autism Res. 2020. PMID: 32830918
-
The Role of Gut Microbiota in Gastrointestinal Symptoms of Children with ASD.Medicina (Kaunas). 2019 Jul 26;55(8):408. doi: 10.3390/medicina55080408. Medicina (Kaunas). 2019. PMID: 31357482 Free PMC article.
-
Autism Spectrum Disorder as a Brain-Gut-Microbiome Axis Disorder.Dig Dis Sci. 2020 Mar;65(3):818-828. doi: 10.1007/s10620-020-06133-5. Dig Dis Sci. 2020. PMID: 32056091 Free PMC article. Review.
Cited by
-
Potential Associations Among Alteration of Salivary miRNAs, Saliva Microbiome Structure, and Cognitive Impairments in Autistic Children.Int J Mol Sci. 2020 Aug 27;21(17):6203. doi: 10.3390/ijms21176203. Int J Mol Sci. 2020. PMID: 32867322 Free PMC article.
-
The Gut Microbiome and Mental Health: What Should We Tell Our Patients?: Le microbiote Intestinal et la Santé Mentale : que Devrions-Nous dire à nos Patients?Can J Psychiatry. 2019 Nov;64(11):747-760. doi: 10.1177/0706743719874168. Epub 2019 Sep 17. Can J Psychiatry. 2019. PMID: 31530002 Free PMC article. Review.
-
Salivary microbiome profiling reveals a dysbiotic schizophrenia-associated microbiota.NPJ Schizophr. 2021 Oct 28;7(1):51. doi: 10.1038/s41537-021-00180-1. NPJ Schizophr. 2021. PMID: 34711862 Free PMC article.
-
Changes in the stool and oropharyngeal microbiome in obsessive-compulsive disorder.Sci Rep. 2022 Jan 27;12(1):1448. doi: 10.1038/s41598-022-05480-9. Sci Rep. 2022. PMID: 35087123 Free PMC article.
-
An Adaptive Multivariate Two-Sample Test With Application to Microbiome Differential Abundance Analysis.Front Genet. 2019 Apr 24;10:350. doi: 10.3389/fgene.2019.00350. eCollection 2019. Front Genet. 2019. PMID: 31068967 Free PMC article.
References
-
- Aldred S, Moore KM, Fitzgerald M, & Waring RH (2003). Plasma amino acid levels in children with autism and their families. Journal of Autism and Developmental Disorders, 33(1), 93–97. - PubMed
Publication types
MeSH terms
Grants and funding
LinkOut - more resources
Full Text Sources
Other Literature Sources
Medical
Molecular Biology Databases
