. 2018 Aug 13;34(2):256-270.e5.
doi: 10.1016/j.ccell.2018.07.002.

Integrated Genomic Analysis of Hürthle Cell Cancer Reveals Oncogenic Drivers, Recurrent Mitochondrial Mutations, and Unique Chromosomal Landscapes

Affiliations

Integrated Genomic Analysis of Hürthle Cell Cancer Reveals Oncogenic Drivers, Recurrent Mitochondrial Mutations, and Unique Chromosomal Landscapes

Ian Ganly et al. Cancer Cell. .

Abstract

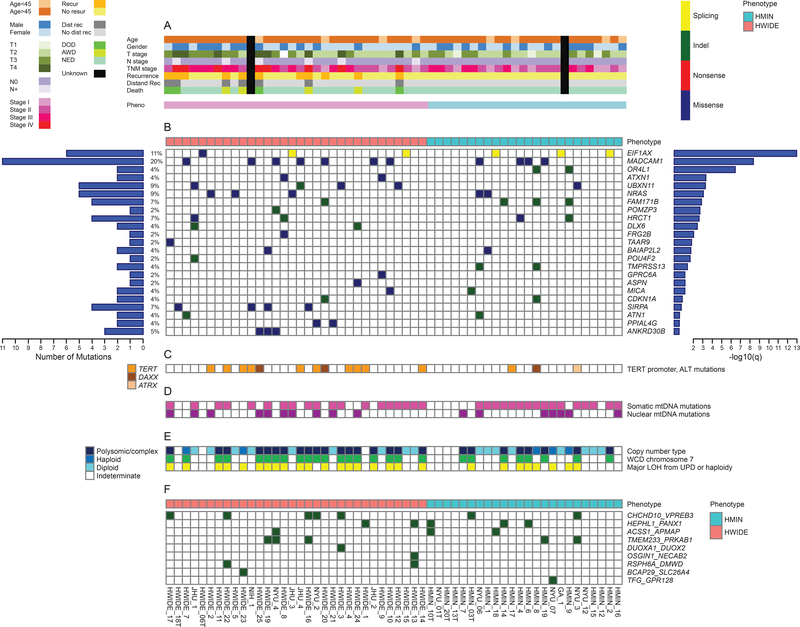
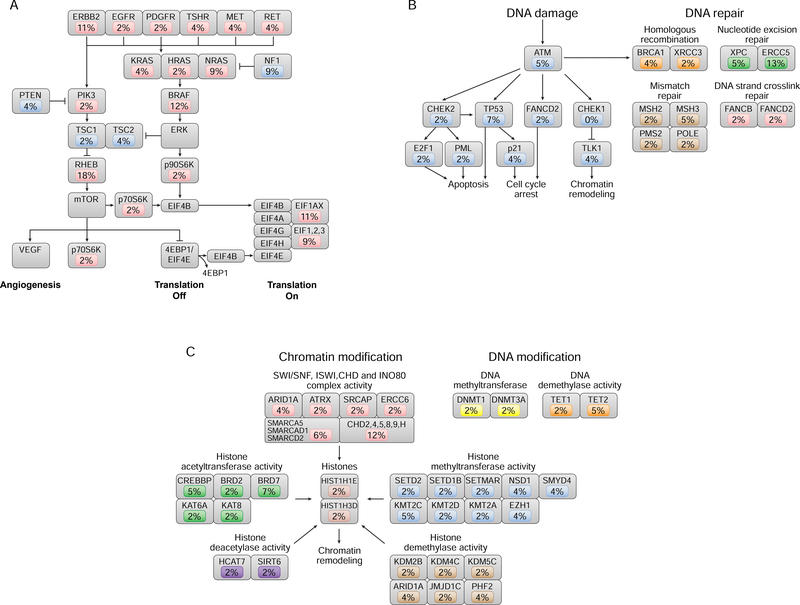
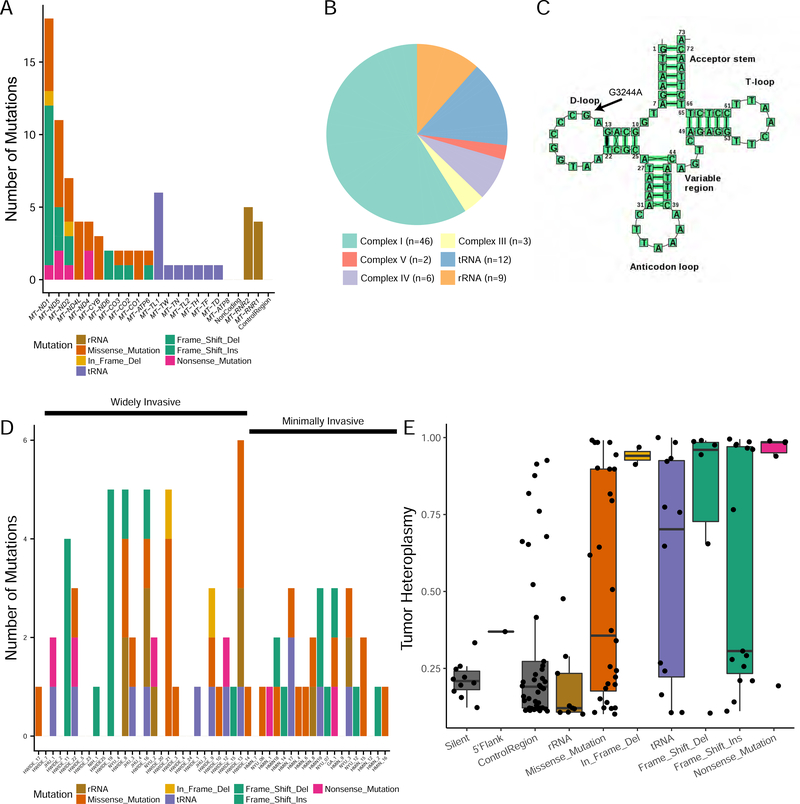
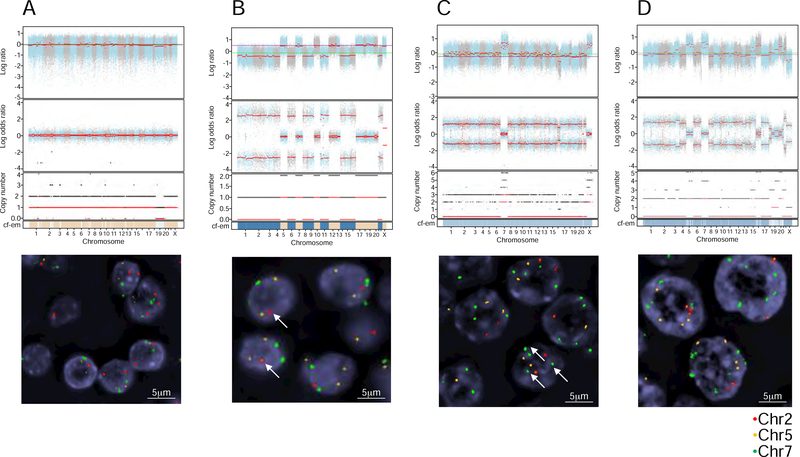
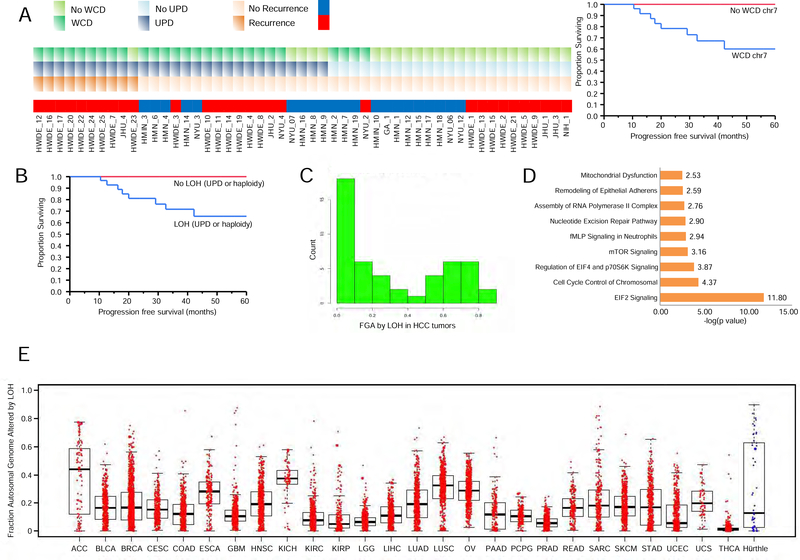
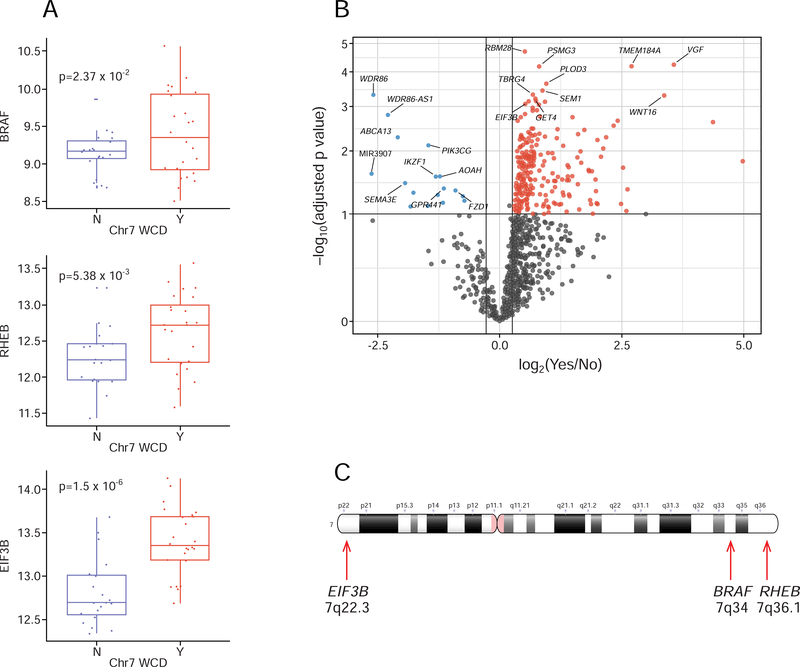
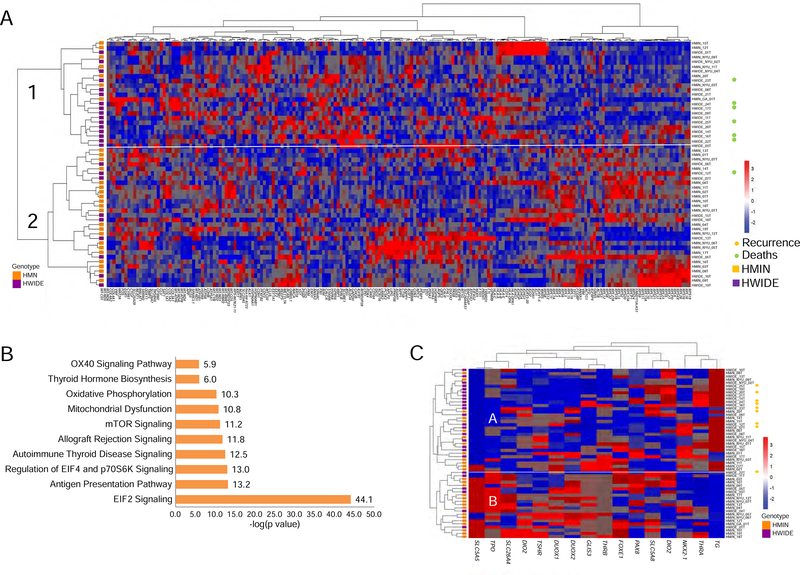
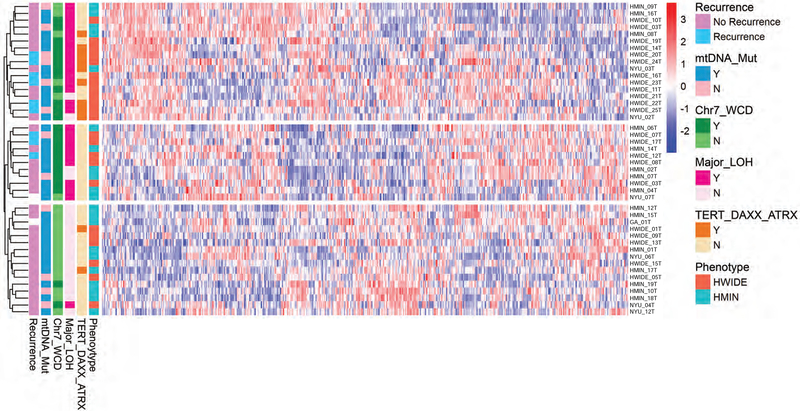
The molecular foundations of Hürthle cell carcinoma (HCC) are poorly understood. Here we describe a comprehensive genomic characterization of 56 primary HCC tumors that span the spectrum of tumor behavior. We elucidate the mutational profile and driver mutations and show that these tumors exhibit a wide range of recurrent mutations. Notably, we report a high number of disruptive mutations to both protein-coding and tRNA-encoding regions of the mitochondrial genome. We reveal unique chromosomal landscapes that involve whole-chromosomal duplications of chromosomes 5 and 7 and widespread loss of heterozygosity arising from haploidization and copy-number-neutral uniparental disomy. We also identify fusion genes and disrupted signaling pathways that may drive disease pathogenesis.

Keywords: Hurthle cell carcinoma; copy-number alterations; fusion genes; genomics; mitochondrial mutations; transcriptome.


Conflict of interest statement

Declaration of Interests: The authors declare no competing interests.

Figures

Figure 1.
Figure 1.. Somatic genomic alterations in HCCs.
(A) Summary of clinical characteristics stratified by histological phenotype. (B) Significantly mutated genes, as determined by the MutSig algorithm. Left histogram: Overall count for each gene. Right histogram: Significance level of mutations, as determined by log10 transformation of the MutSig q value. (C) TERT mutations. (D) Mitochondrial mutations. (E) Copy number alterations as determined by FACETS and FISH (F) In-frame structural variant fusion genes detected by RNA-Seq. See also Figures S1-S4 and S6 and Tables S1 and S6.
Figure 2.
Figure 2.. Somatic mutations of the canonical signal transduction and tumor suppressor pathways in HCC.
(A) RAS/RAF/MAPK and PI3K/AKT/mTOR pathway mutations occurred in 55% of tumors, and the incidence of mutation in each component of the pathway is indicated. Oncogenic alterations are shown in red; tumor suppressor alterations are shown in blue. All alterations were somatic mutations, with the exception of amplification events for RHEB and BRAF and deletion events for NF1. (B) DNA damage and DNA repair pathways were mutated in 38% of tumors, and the incidence of mutation in each component of the pathway is indicated. Gene mutations involved in DNA damage are shown in blue. Mutations in DNA repair pathways occurred in homologous recombination (orange), nucleotide excision repair (green), mismatch repair (brown), and DNA strand cross-link repair (red). (C) Epigenetic-modifying gene mutations occurred in 33 tumors (59%), by either chromatin modification (55%) or DNA modification (9%); the incidence of mutation in each component of the pathway is indicated. Chromatin-modifying mutations occurred in chromatin-modifying complexes, such as the SWI/SNF complex (red), histone acetyltransferases (green), methyltransferases (blue), histone deacetylases (purple), and demethylases (brown), as well as in histones themselves. DNAmodifying mutations occurred in DNA methyltransferases (yellow) and demethylases (orange).
Figure 3.
Figure 3.. Mitochondrial mutations in HCC tumors.
(A) Types and frequency of mutations observed in mtDNA. B) Mitochondrial mutations categorized by the genes encoding the mitochondrial complexes the mutations alter. C) Location of the recurrent leucine tRNA MTTL1 (G3244A) mutation. D) Type and frequency of mitochondrial mutations categorized for each tumor sample. E) Tumor heteroplasmy categorized by the type of mitochondrial mutation. Boxplots showing the degree of heteroplasmy are shown for each type of mitochondrial mutation. For each boxplot, the horizontal line inside the box is the median and the upper and lower horizontal lines of the box represent the interquartile range (25th-75th percentile). The line above the box shows tumors from the 75th to 100th percentile and the line below shows tumors from 0–25th percentile. See also Table S2.
Figure 4.
Figure 4.. Example of cytogenic subtypes, characterized using genomic copy number analysis and FISH.
(A–C) FACETS plots show the GC-corrected normalized log ratio of tumor to normal read depths at a set of single-nucleotide polymorphism (SNP) loci; the log odds ratio was determined from cross-tabulating the tumor and normal reads into alleles for loci that are heterozygous in the germline; the total (black) and minor (red) integer copy number assignment for the segments is indicated; the final band shows the cellular fractions, where dark blue represents 1, lighter shades represent lower numbers, and beige represents no copy number change. FISH validation was performed for chromosomes 2, 5, and 7. These analyses are provided for 4 representative patients: HMIN 18 (A), HMIN 9 (B), HWIDE 17 (C), and HWIDE 16 (D). The arrows in HMIN 9(B) show 1 copy of chromosome 2 (haploid phenotype). The arrows in HWIDE 17(C) show multiple copies of chromosome 7 (WCD chromosome 7) See also Figure S5 and Table S3 and S5
Figure 5.
Figure 5.. WCD and major LOH from UPD or haploidy in HCC tumors.
A) The correlation between WCD, major LOH, and recurrence is shown for each tumor (left). Kaplan-Meier plot showing progression-free survival in patients based on WCD of chromosome 7 (right). B) Kaplan-Meier plot showing progression-free survival in patients based on LOH from UPD and haploidy. C) Number of tumors with the indicated fraction of the genome altered by LOH from UPD or haploidy in HCC tumors is shown. D) Results of Ingenuity pathway analysis for tumors enriched with UPD. Pathways are shown along the y-axis and statistical significance (-log10 p value) along the x-axis. E) A pan-cancer analysis of LOH comparing HCC (blue) to data from TCGA for other cancer types (red). Fraction of the genome altered (FGA) by LOH is shown on the y-axis. Tumor types are shown on the x-axis. Boxplots show the fraction of genome altered for each tumor type. For each boxplot, the horizontal line inside the box is the median and the upper and lower horizontal lines of the box represent the interquartile range (25th–75th percentile). The line above the box shows tumors from the 75th to 100th percentile and the line below shows tumors from 0–25th percentile. See also Table S4.
Figure 6.
Figure 6.. Correlation of WCD of chromosome 7 with gene overexpression.
A) Boxplots showing the distribution of expression of 3 genes involved in mTOR signaling and translation in tumors with (Y) and without (N) chromosome 7 amplification. For each boxplot, the horizontal line inside the box is the median and the upper and lower horizontal lines of the box represent the interquartile range (25th–75th percentile). The line above the box shows tumors from the 75th to 100th percentile and the line below shows tumors from 0–25th percentile. B) Volcano plot showing differentially expressed genes in tumors with chromosome 7 amplification. Magnitude fold changes are shown on the x-axis and statistical significance (log10 of p value) on the y-axis. Genes with a fold change less than 2 (log2 = 1) are shown in grey. Genes in the top right colored red are overexpressed with large statistically significant fold changes. Genes in the top left colored blue are underexpressed with large statistically significant fold changes. C) Ideogram of chromosome 7 showing the location BRAF, RHEB and EIF3B genes.
Figure 7.
Figure 7.. Transcriptome profiles of HCC tumors.
A) Unsupervised clustering of the 200 most variant genes. B) Pathway analysis of the most significant pathways altered between the clusters in panel A. C) Unsupervised clustering using a 16-gene thyroid differentiation score shows 2 main groups A and B. Group A is over represented by widely invasive HCC with greater loss of thyroid differentiation. All patients with recurrence, shown by orange sympos, are in group A. (SLC5A5, TPO, SLC26A4, DIO2, TSHR, DUOX1, DUOX2, GLIS3, THRB, FOXE1, PAX8, SLC5A8, DIO1, NKX-2, THRA, and TG). See also Figure S7 and Table S7.
Figure 8.
Figure 8.. Heatmap showing integration of genomic and transcriptomic data.
The unsupervised clustering of the 500 most differentially expressed genes integrated with the major genomic findings of WCD, LOH, TERT mutation status and mitochondrial mutation status in HCC tumors.

References

    1. Amorim JP, Santos G, Vinagre J, and Soares P (2016). The Role of ATRX in the alternative lengthening of telomeres (ALT) phenotype. Genes (Basel) 7, E66. - PMC - PubMed
    1. Baxter E, Windloch K, Gannon F, and Lee JS (2014). Epigenetic regulation in cancer progression. Cell Biosci 4, 45. - PMC - PubMed
    1. Besic N, Vidergar-Kralj B, Frkovic-Grazio S, Movrin-Stanovnik T, and Auersperg M (2003). The role of radioactive iodine in the treatment of Hürthle cell carcinoma of the thyroid. Thyroid 13, 577–584. - PubMed
    1. Boot A, Oosting J, de Miranda NF, Zhang Y, Corver WE, van de Water B, Morreau H, and van Wezel T (2016). Imprinted survival genes preclude loss of heterozygosity of chromosome 7 in cancer cells. J Pathol 240, 72–83. - PubMed
    1. Cancer Genome Atlas Research Network. (2008). Comprehensive genomic characterization defines human glioblastoma genes and core pathways. Nature 455, 1061–1068. - PMC - PubMed

Publication types