. 2018 Dec 1;27(23):4024-4035.
doi: 10.1093/hmg/ddy293.

A patient-derived iPSC model revealed oxidative stress increases facioscapulohumeral muscular dystrophy-causative DUX4

Affiliations

A patient-derived iPSC model revealed oxidative stress increases facioscapulohumeral muscular dystrophy-causative DUX4

Mitsuru Sasaki-Honda et al. Hum Mol Genet. .

Abstract

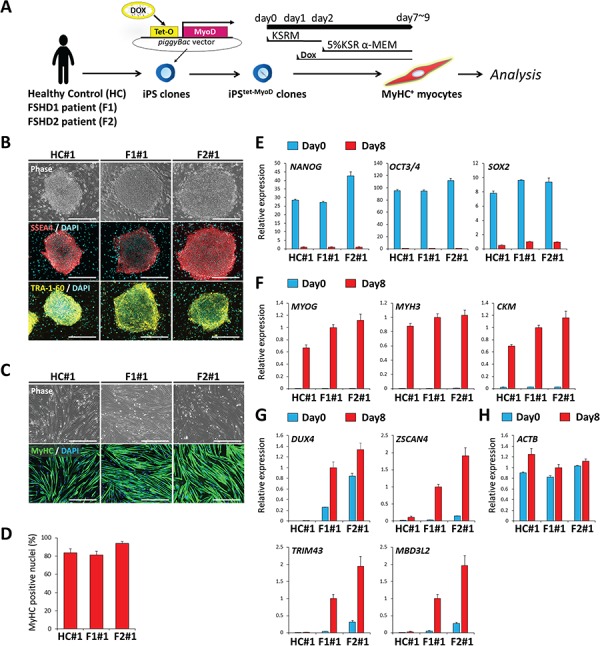
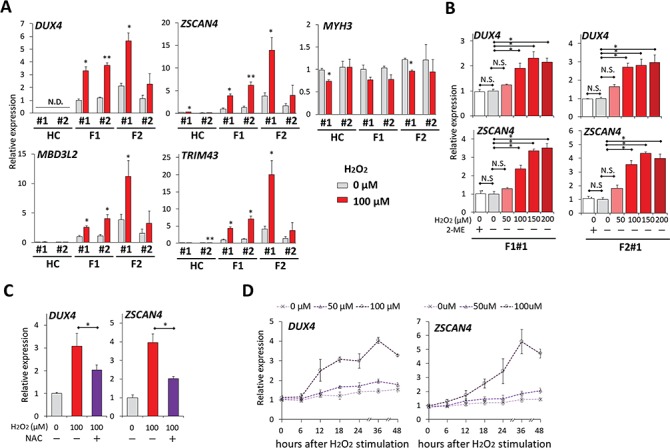
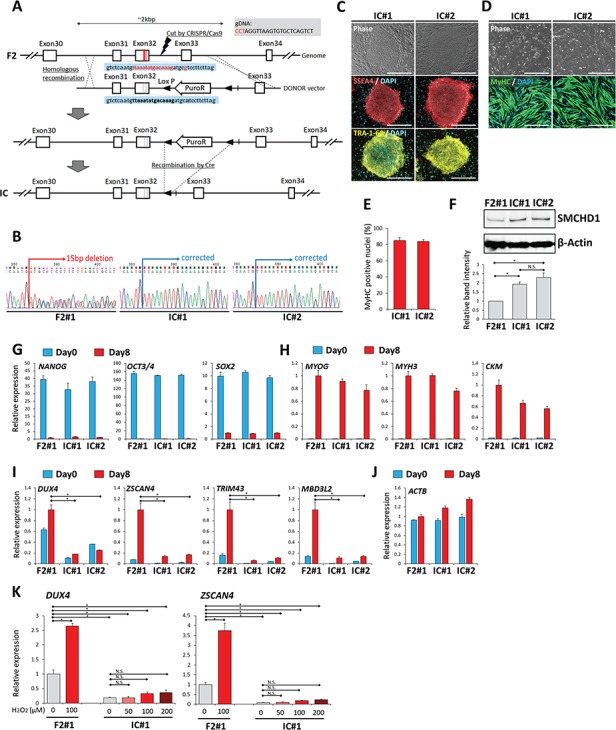
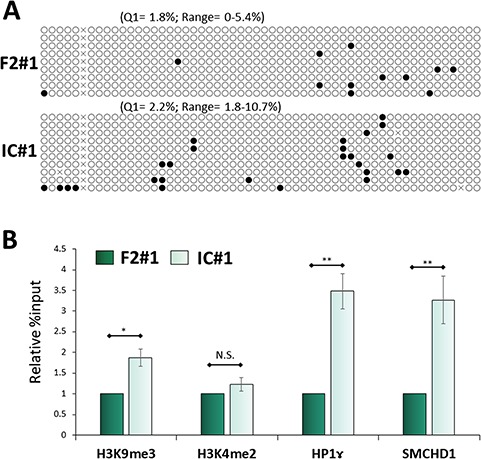
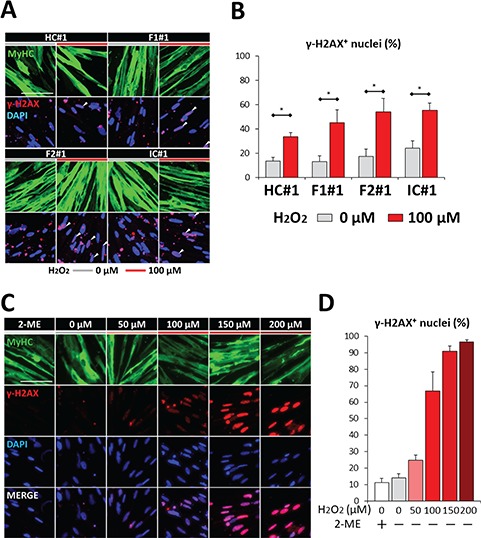
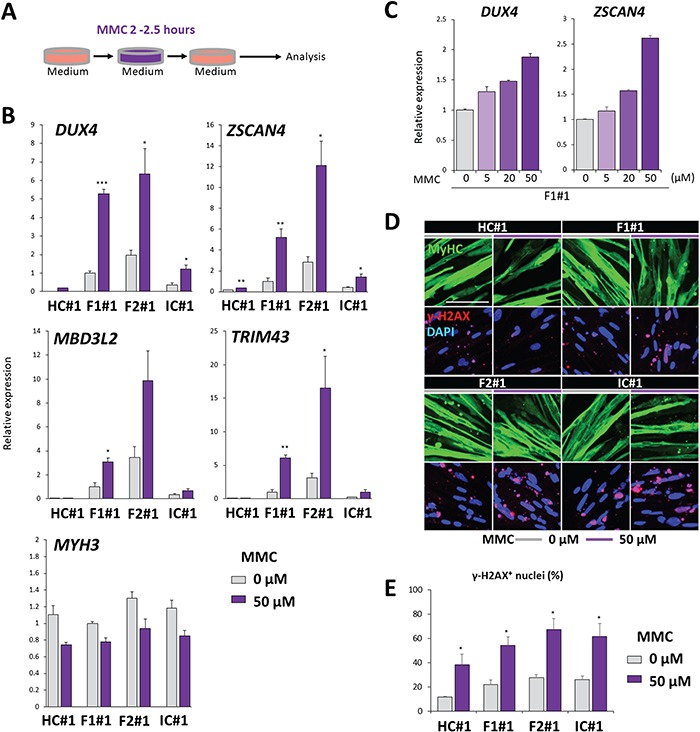
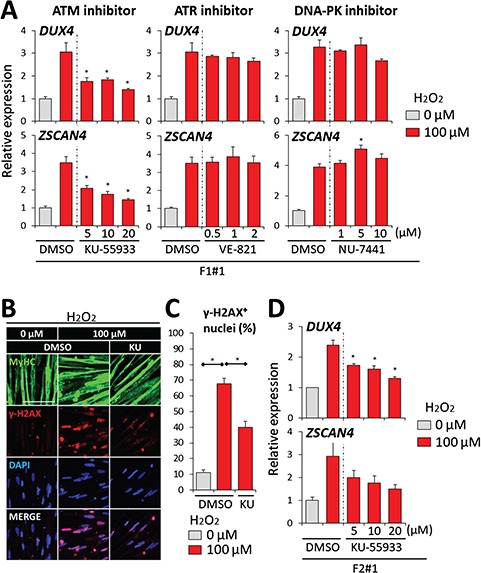
Double homeobox 4 (DUX4), the causative gene of facioscapulohumeral muscular dystrophy (FSHD), is ectopically expressed in the skeletal muscle cells of FSHD patients because of chromatin relaxation at 4q35. The diminished heterochromatic state at 4q35 is caused by either large genome contractions [FSHD type 1 (FSHD1)] or mutations in genes encoding chromatin regulators, such as SMCHD1 [FSHD type 2 (FSHD2)]. However, the mechanism by which DUX4 expression is regulated remains largely unknown. Here, using a myocyte model developed from patient-derived induced pluripotent stem cells, we determined that DUX4 expression was increased by oxidative stress (OS), a common environmental stress in skeletal muscle, in both FSHD1 and FSHD2 myocytes. We generated FSHD2-derived isogenic control clones with SMCHD1 mutation corrected by clustered regularly interspaced short palindromic repeats (CRISPR)/ CRISPR associated 9 (Cas9) and homologous recombination and found in the myocytes obtained from these clones that DUX4 basal expression and the OS-induced upregulation were markedly suppressed due to an increase in the heterochromatic state at 4q35. We further found that DNA damage response (DDR) was involved in OS-induced DUX4 increase and identified ataxia-telangiectasia mutated, a DDR regulator, as a mediator of this effect. Our results suggest that the relaxed chromatin state in FSHD muscle cells permits aberrant access of OS-induced DDR signaling, thus increasing DUX4 expression. These results suggest OS could represent an environmental risk factor that promotes FSHD progression.


Figures

Figure 1
Figure 1
iPStet-MyoD clones were generated from a healthy control and from FSHD1 and FSHD2 patients. (A) Scheme of the differentiation of iPSC clones to myocytes. (B) Representative images of immunofluorescence staining of SSEA4 (red) and TRA-1-60 (yellow) in undifferentiated iPSCtet-MyoD clones. Scale bar: 500 μm. (C) Representative images of immunofluorescence staining of MyHC (green) in differentiated myocytes at day 8. Scale bar: 500 μm. (D) Differentiation efficiency was quantified by calculating the percentage of MyHC positive nuclei in total nuclei at day 8 (n = 4). (E–H) RT-qPCR analysis of all clones at day 0 (undifferentiated) and day 8 (differentiated) (n = 3) for (E) pluripotency markers, (F) myogenic markers, (G) DUX4 and its downstream targets and (H) ACTB as a reference gene. Relative expression levels were normalized to RPLP0 as an internal control in each sample and then to F1#1 at day 8 (differentiated). Data information: in (D–H), data are represented as mean ± standard error of the mean.
Figure 2
Figure 2
OS increased DUX4 expression in FSHD myocytes. (A) RT-qPCR was performed for DUX4, its downstream targets (ZSCAN4, TRIM43 and MBD3L2) and MYH3 in HC#1, HC#2, F1#1, F1#2, F2#1 and F2#2 myocytes incubated with or without 100 μM H2O2 for 24 h at day 8 after differentiation (n = 3 for each condition). Relative expression levels were normalized to RPLP0 as an internal control in each sample and then to F1#1 without H2O2. (B) RT-qPCR was performed for DUX4 and ZSCAN4 in F1#1 and F2#1 myocytes incubated with 2-mercaptoethanol (2-ME) or with H2O2 at various concentrations for 24 h at day 8 after differentiation (n = 3 for each condition). Relative expression levels were normalized to RPLP0 as an internal control in each sample and then to the condition with 0 μM H2O2 without 2-ME in each clone. (C) NAC was pretreated 1 h before H2O2 stimulation to F1#1 myocytes at day 8. 24 h after H2O2 addition, RT-qPCR was performed for DUX4 and ZSCAN4 (n = 3 for each condition). Relative expression levels were normalized to RPLP0 as an internal control in each sample and then to the condition without H2O2 or NAC. (D) Time-course analysis of DUX4 and ZSCAN4 mRNA expression by RT-qPCR after H2O2 stimulation (n = 3 per each time point). Relative expression levels were normalized to RPLP0 as an internal control in each sample and then to the condition with 0 μM H2O2. Data information: all data are represented as mean ± SEM. *P ≤ 0.05, *P ≤ 0.01 [Student’s t-test in (A) and (C), one way ANOVA followed by Dunnett’s Multiple Comparison Test in (B)].
Figure 3
Figure 3
Basal DUX4 expression and increased DUX4 expression by OS were suppressed by gene modification in FSHD2 myocytes. (A) Scheme of the gene correction of the SMCHD1 mutation (shown in red letters) in F2 clone. The expected sequence (equal to wild-type sequence) after correction is shown in bold black letters. (B) The sequence around the mutation site was checked. F2#1 clone has a heterozygous 15 bp deletion followed by one point mutation (A), resulting in an ambiguous signal pattern, but genetically modified IC#1 and IC#2 clones showed a single pattern consistent with the expected sequence shown in (A), confirming the right correction. (C) Representative images of immunofluorescence staining of SSEA4 (red) and TRA-1-60 (yellow) in undifferentiated iPSCtet-MyoD clones of IC#1 and IC#2. Scale bar: 500 μm. (D) Representative images of immunofluorescence staining of MyHC (green) in differentiated myocytes at day 8 of IC#1 and IC#2. Scale bar: 500 μm. (E) Differentiation efficiency was quantified by calculating the percentage of MyHC positive nuclei in total nuclei at day 8 (n = 4). (F) Representative result of western blotting analysis for SMCHD1 (upper panel) and β-Actin (lower panel) in the myocytes of each clone at day 8. The lowest graph shows quantification of relative band intensity. Band intensity of SMCHD1 was normalized to that of β-Actin and subsequently to F2#1 (n = 3). (G–J). RT-qPCR analysis of all clones on day 0 (undifferentiated) and day 8 (differentiated) (n = 3) for (G) pluripotency markers, (H) myogenic markers, (I) DUX4 and its downstream targets and (J) ACTB as a reference gene. Relative expression levels were normalized to RPLP0 as an internal control in each sample and subsequently to F2#1 at day8 (differentiated). (K) Differentiated myocytes at day 8 after induction from F2#1 and IC#1 clones were incubated with or without H2O2 for 24 h, and RT-qPCR was performed for DUX4 and ZSCAN4 (n = 3 for each condition). Relative expression levels were normalized to RPLP0 as an internal control in each sample and then to F2#1 without H2O2. Data information: in (E–K) data are represented as mean ± SEM. *P ≤ 0.05, N. S. not significant [one-way ANOVA followed by Dunnett’s Multiple Comparison Test in (I) and by Tukey‘s test in (F) and (K)].
Figure 4
Figure 4
The 4q35 genome in FSHD2 isogenic control myocytes showed a more heterochromatic state at the protein level. (A) DNA methylation analysis on the 4q35 region by bisulfite sequencing. White and black circles mark unmethylated and methylated CpG, respectively. The lower quartile (Q1) and range of the percent methylation are shown above each column. (B) ChIP RT-qPCR was performed on 4q35 for H3K9me3, H3K4me2 (as a negative control), HP1ɤ and SMCHD1 (n = 4). Relative % input was normalized to F2#1. Data information: all data are represented as mean ± SEM. *P < 0.05, **P < 0.01 (Student’s t test, unpaired).
Figure 5
Figure 5
DDR occurred after H2O2 stimulation but before DUX4 expression increased. (A) Representative images of immunofluorescence staining of MyHC (green) and ɤ-H2AX (red) in HC#1, F1#1, F2#1 and IC#1 myocytes at day 8 in the presence or absence of H2O2. Cells were fixed 6 h after H2O2 addition. Scale bar: 100 μm. (B) The percentages of ɤ-H2AX positive nuclei in total nuclei in (A) (n = 3). (C) Representative images of immunofluorescence staining of MyHC (green) and ɤ-H2AX (red) in F1#1 myocytes at day 8 incubated with 2-ME or with H2O2 at various concentrations for 6 h. Scale bar: 100 μm. (D) The percentages of ɤ-H2AX positive nuclei in total nuclei in (C) (n = 3). Data information: in (B) and (D), data are represented as mean ± SEM. *P ≤ 0.05 [Student’s t-test in (B)].
Figure 6
Figure 6
MMC exposure increased DUX4 expression. (A) Scheme of the MMC exposure. Differentiated myocytes at day 8 after induction were exposed to MMC for 2–2.5 h, incubated for 9 or 24 h and analyzed. (B) RT-qPCR was performed for DUX4, its downstream targets (ZSCAN4, TRIM43 and MBD3L2), and MYH3 in HC#1, F1#1, F2#1 and IC#1 myocytes exposed to MMC for 2.5 h and subsequently incubated for 24 h (n = 3 for each condition). Relative expression levels were normalized to RPLP0 as an internal control in each sample and then to F1#1 without UV-C exposure. (C) RT-qPCR was performed for DUX4 and ZSCAN4 in F1#1 myocytes exposed to MMC at various concentrations for 2 h and subsequently incubated for 24 h (n = 3 for each condition). Relative expression levels were normalized to RPLP0 as an internal control in each sample and then to the condition without MMC exposure. (D) Representative images of immunofluorescence staining of MyHC (green) and ɤ-H2AX (red) in HC#1, F1#1, F2#1 and IC#1 myocytes at day 8 exposed to MMC for 2.5 h. Cells were fixed for 9 h after the initiation of MMC exposure. Scale bar: 100 μm. (E) The percentages of ɤ-H2AX positive nuclei in total nuclei in (C) (n = 3). Data information: in (B), (C) and (E), data are represented as mean ± SEM. *P ≤ 0.05, **P ≤ 0.01, ***P ≤ 0.001 [Student’s t-test in (B) and (E)].
Figure 7
Figure 7
ATM inhibition suppressed DUX4 increase by OS. (A) RT-qPCR was performed for DUX4 and ZSCAN4 in F1#1 myocytes under H2O2 stimulation treated with KU-55933, VE-821 or NU-7441 (inhibitors for ATM, ATR or DNA-PK, respectively) (n = 3 for each condition). Relative expression levels were normalized to RPLP0 as an internal control in each sample and then to the condition with 0 μM H2O2. Dimethyl sulfoxide (DMSO) was added to each sample to keep its final concentration comparable among all conditions. (B) Representative images of immunofluorescence staining of MyHC (green) and ɤ-H2AX (red) in F1#1 myocytes in the absence or presence of 100 μM H2O2 and 20 μM KU-55933 (KU). DMSO was added to each sample to keep its final concentration comparable among all the conditions. (C) The percentages of ɤ-H2AX positive nuclei in total nuclei in (B) (n = 3). (D) RT-qPCR was performed for DUX4 and ZSCAN4 in F2#1 myocytes under H2O2 stimulation and treated with KU-55933 (n = 3 for each condition). Relative expression levels were normalized to RPLP0 as an internal control in each sample and then to the condition with 0 μM H2O2. DMSO was added to each sample to keep its final concentration comparable among all conditions. Data information: in (A), (C) and (D), data are represented as mean ± SEM. *P ≤ 0.05 [one-way ANOVA followed by Dunnett’s Multiple Comparison Test in (A), (C) and (D)].

Similar articles

Cited by

References

    1. Tawil R., Maarel S.M. and Tapscott S.J. (2014) Facioscapulohumeral dystrophy: the path to consensus on pathophysiology. Skelet. Muscle, 4, 12. - PMC - PubMed
    1. Daxinger L., Tapscott S.J. and Maarel S.M. (2015) Genetic and epigenetic contributors to FSHD. Curr. Opin. Genet. Dev., 33, 56–61. - PMC - PubMed
    1. Lemmers R.J.L.F., Vliet P.J., Klooster R., Sacconi S., Dauwerse J.G., Snider L., Straasheijm K.R., Van Ommen G.J., Padberg G.W., Miller D.G. et al. (2010) A unifying genetic model for facioscapulohumeral muscular dystrophy. Science, 329, 1650–1653. - PMC - PubMed
    1. Zeng W., De Greef J.C., Chen Y.Y., Chien R., Kong X., Gregson H.C., Winokur S.T., Pyle A., Robertson K.D., Schmiesing J.A. et al. (2009) Specific loss of histone H3 lysine 9 trimethylation and HP1γ/cohesin binding at D4Z4 repeats is associated with facioscapulohumeral dystrophy (FSHD). PLoS Genet., 5, e1000559. - PMC - PubMed
    1. Lemmers R.J.L.F., Goeman J.J., Van der Vliet P.J., Van Nieuwenhuizen M.P., Balog J., Vos-Versteeg M., Camano P., Ramos Arroyo M.A., Jerico I., Rogers M.T. et al. (2015) Inter-individual differences in CpG methylation at D4Z4 correlate with clinical variability in FSHD1 and FSHD2. Hum. Mol. Genet., 24, 659–669. - PMC - PubMed

Publication types

MeSH terms