

Microbial Translocation Does Not Drive Immune Activation in Ugandan Children Infected With HIV
- PMID: 30107546
- PMCID: PMC6284549
- DOI: 10.1093/infdis/jiy495
Microbial Translocation Does Not Drive Immune Activation in Ugandan Children Infected With HIV
Abstract
Objective: Immune activation is associated with morbidity and mortality during human immunodeficiency virus (HIV) infection, despite receipt of antiretroviral therapy (ART). We investigated whether microbial translocation drives immune activation in HIV-infected Ugandan children.
Methods: Nineteen markers of immune activation and inflammation were measured over 96 weeks in HIV-infected Ugandan children in the CHAPAS-3 Trial and HIV-uninfected age-matched controls. Microbial translocation was assessed using molecular techniques, including next-generation sequencing.
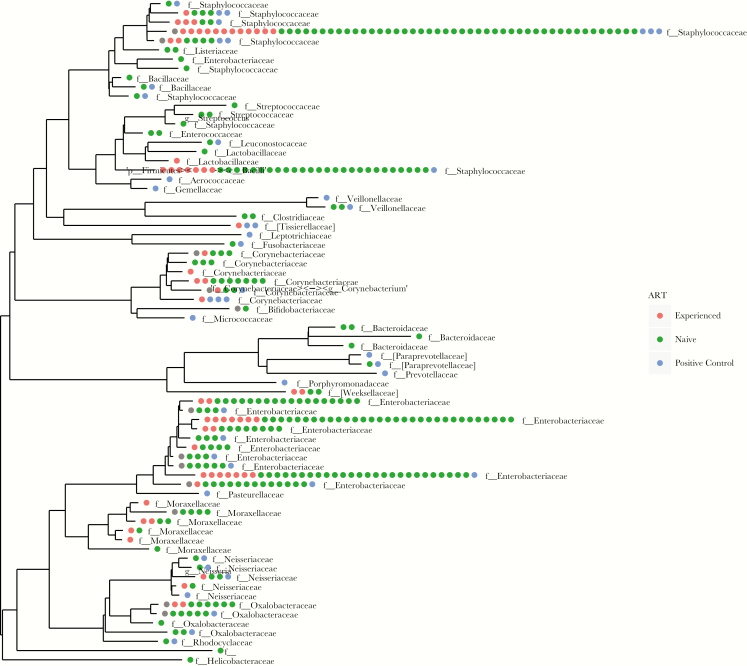
Results: Of 249 children included, 142 were infected with HIV; of these, 120 were ART naive, with a median age of 2.8 years (interquartile range [IQR], 1.7-4.0 years) and a median baseline CD4+ T-cell percentage of 20% (IQR, 14%-24%), and 22 were ART experienced, with a median age of 6.5 years (IQR, 5.9-9.2 years) and a median baseline CD4+ T-cell percentage of 35% (IQR, 31%-39%). The control group comprised 107 children without HIV infection. The median increase in the CD4+ T-cell percentage was 17 percentage points (IQR, 12-22 percentage points) at week 96 among ART-naive children, and the viral load was <100 copies/mL in 76% of ART-naive children and 91% of ART-experienced children. Immune activation decreased with ART use. Children could be divided on the basis of immune activation markers into the following 3 clusters: in cluster 1, the majority of children were HIV uninfected; cluster 2 comprised a mix of HIV-uninfected children and HIV-infected ART-naive or ART-experienced children; and in cluster 3, the majority were ART naive. Immune activation was low in cluster 1, decreased in cluster 3, and persisted in cluster 2. Blood microbial DNA levels were negative or very low across groups, with no difference between clusters except for Enterobacteriaceae organisms (the level was higher in cluster 1; P < .0001).
Conclusion: Immune activation decreased with ART use, with marker clustering indicating different activation patterns according to HIV and ART status. Levels of bacterial DNA in blood were low regardless of HIV status, ART status, and immune activation status. Microbial translocation did not drive immune activation in this setting.
Clinical trials registration: ISRCTN69078957.
Figures


References
-
- Joint United Nations Programme on HIV/AIDS (UNAIDS). UNAIDS data 2017. Geneva: UNAIDS, 2017. - PubMed
-
- Massanella M, Negredo E, Pérez-Alvarez N, et al. CD4 T-cell hyperactivation and susceptibility to cell death determine poor CD4 T-cell recovery during suppressive HAART. AIDS 2010; 24:959–68. - PubMed
-
- Giorgi JV, Hultin LE, McKeating JA, et al. Shorter survival in advanced human immunodeficiency virus type 1 infection is more closely associated with T lymphocyte activation than with plasma virus burden or virus chemokine coreceptor usage. J Infect Dis 1999; 179:859–70. - PubMed
Publication types
MeSH terms
Substances
Associated data
Grants and funding
LinkOut - more resources
Full Text Sources
Other Literature Sources
Medical
Research Materials
