Association between Type I interferon and depletion and dysfunction of endothelial progenitor cells in C57BL/6 mice deficient in both apolipoprotein E and Fas ligand
- PMID: 30108025
- PMCID: PMC12230987
- DOI: 10.1016/j.retram.2018.02.002
Association between Type I interferon and depletion and dysfunction of endothelial progenitor cells in C57BL/6 mice deficient in both apolipoprotein E and Fas ligand
Abstract
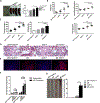
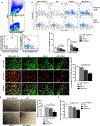
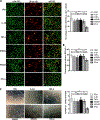
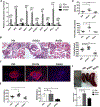
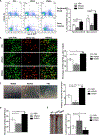
Patients with systemic lupus erythematosus (SLE) have a tremendously increased risk for cardiovascular disease (CVD), which could not be accounted in entirety by traditional Framingham risk factors. To study whether the accelerated atherosclerosis in SLE patients is mediated by type I interferon (IFN-I) through the regulation of endothelial progenitor cells (EPCs), we created a line of C57BL/6 mice with deficiency in both apolipoprotein E (ApoE-/-) and fas ligand (FasL-/-, gld.). As expected, the resultant gld. ApoE-/- mice exhibited both aggravated lupus-like disease and atherosclerosis under normal diet. Increased expression of IFN-I-stimulated genes (ISGs) was closely associated with depletion and dysfunction of EPCs, as well as with accelerated atherosclerotic lesion in gld. ApoE-/- mice. While only IFN-α instead of other interventions, including tumor necrosis factor-α (TNF-α), interleukin-1β (IL-1β), IRS423 and IRS661, impaired EPC function in vitro. Mechanistically, activation or inhibition of the TLR7/9 signaling could modulate EPC number and function in vivo. Decreased proliferation rate and increased apoptotic rate of EPCs induced by IFN-α might contribute to the results to a certain extent. Thus, our data suggest that excessive expression of IFN-I through the activation of TLR7/9 signaling may induce accelerated atherosclerosis in lupus through the depletion or dysfunction of EPCs, suggesting that targeting IFN-I might have potential therapeutic effects on both lupus disease and premature atherosclerosis in SLE patients.
Keywords: Endothelial progenitor cells; Lupus erythematosus; Systemic; Type I interferon; gld. ApoE−/− mice.
Copyright © 2018. Published by Elsevier Masson SAS.
Figures

Similar articles
-
Brief Report: Vitamin D Deficiency Is Associated With Endothelial Dysfunction and Increases Type I Interferon Gene Expression in a Murine Model of Systemic Lupus Erythematosus.Arthritis Rheumatol. 2016 Dec;68(12):2929-2935. doi: 10.1002/art.39803. Arthritis Rheumatol. 2016. PMID: 27390112 Free PMC article.
-
Endothelial cell injury is involved in atherosclerosis and lupus symptoms in gld.apoE- / - mice.Int J Rheum Dis. 2019 Mar;22(3):488-496. doi: 10.1111/1756-185X.13458. Epub 2018 Dec 21. Int J Rheum Dis. 2019. PMID: 30575313
-
SESN1 negatively regulates STING1 to maintain innate immune homeostasis.Autophagy. 2025 Jun;21(6):1245-1262. doi: 10.1080/15548627.2025.2463148. Epub 2025 Feb 13. Autophagy. 2025. PMID: 39945079
-
Type I Interferon as cardiovascular risk factor in systemic and cutaneous lupus erythematosus: A systematic review.Autoimmun Rev. 2021 May;20(5):102794. doi: 10.1016/j.autrev.2021.102794. Epub 2021 Mar 17. Autoimmun Rev. 2021. PMID: 33722754
-
Smoking cessation for secondary prevention of cardiovascular disease.Cochrane Database Syst Rev. 2022 Aug 8;8(8):CD014936. doi: 10.1002/14651858.CD014936.pub2. Cochrane Database Syst Rev. 2022. PMID: 35938889 Free PMC article.
Cited by
-
Metabolic Modulators in Cardiovascular Complications of Systemic Lupus Erythematosus.Biomedicines. 2023 Nov 25;11(12):3142. doi: 10.3390/biomedicines11123142. Biomedicines. 2023. PMID: 38137363 Free PMC article. Review.
-
Neutralizing interferon-α blocks inflammation-mediated vascular injury via PI3K and AMPK in systemic lupus erythematosus.Immunology. 2021 Oct;164(2):372-385. doi: 10.1111/imm.13379. Epub 2021 Jun 20. Immunology. 2021. PMID: 34077562 Free PMC article.
-
IFN-I Mediates Dysfunction of Endothelial Progenitor Cells in Atherosclerosis of Systemic Lupus Erythematosus.Front Immunol. 2020 Nov 11;11:581385. doi: 10.3389/fimmu.2020.581385. eCollection 2020. Front Immunol. 2020. PMID: 33262760 Free PMC article. Review.
-
Identification of Key Genes Associated with Endothelial Cell Dysfunction in Atherosclerosis Using Multiple Bioinformatics Tools.Biomed Res Int. 2022 Jan 10;2022:5544276. doi: 10.1155/2022/5544276. eCollection 2022. Biomed Res Int. 2022. PMID: 35059464 Free PMC article.
-
Update of Potential Biomarkers in Risk Prediction and Monitoring of Atherosclerosis in Systemic Lupus Erythematosus to Prevent Cardiovascular Disease.Biomedicines. 2023 Oct 17;11(10):2814. doi: 10.3390/biomedicines11102814. Biomedicines. 2023. PMID: 37893187 Free PMC article. Review.
References
-
- Murphy G, Lisnevskaia L, Isenberg D. Systemic lupus erythematosus and other autoimmune rheumatic diseases: challenges to treatment. Lancet 2013;382:809–18. - PubMed
-
- Frieri M, Stampfl H. Systemic lupus erythematosus and atherosclerosis: review of the literature. Autoimmun Rev 2016;15:16–21. - PubMed
-
- Benvenuti F, Gatto M, Larosa M, Iaccarino L, Punzi L, Doria A. Cardiovascular risk factors, burden of disease and preventive strategies in patients with systemic lupus erythematosus: a literature review. Expert Opin Drug Saf 2015;14:1373–85. - PubMed
-
- Bessant R, Duncan R, Ambler G, Swanton J, Isenberg DA, Gordon C, et al. Prevalence of conventional and lupus-specific risk factors for cardiovascular disease in patients with systemic lupus erythematosus: a case–control study. Arthritis Rheum 2006;55:892–9. - PubMed
-
- Asahara T, Kawamoto A, Masuda H. Concise review: circulating endothelial progenitor cells for vascular medicine. Stem Cells 2011;29:1650–5. - PubMed
Publication types
MeSH terms
Substances
Grants and funding
LinkOut - more resources
Full Text Sources
Other Literature Sources
Research Materials
Miscellaneous

