. 2018 Dec 15;24(24):6433-6446.
doi: 10.1158/1078-0432.CCR-18-1727. Epub 2018 Aug 14.

Biochemical and Epigenetic Insights into L-2-Hydroxyglutarate, a Potential Therapeutic Target in Renal Cancer

Affiliations

Biochemical and Epigenetic Insights into L-2-Hydroxyglutarate, a Potential Therapeutic Target in Renal Cancer

Sandeep Shelar et al. Clin Cancer Res. .

Abstract

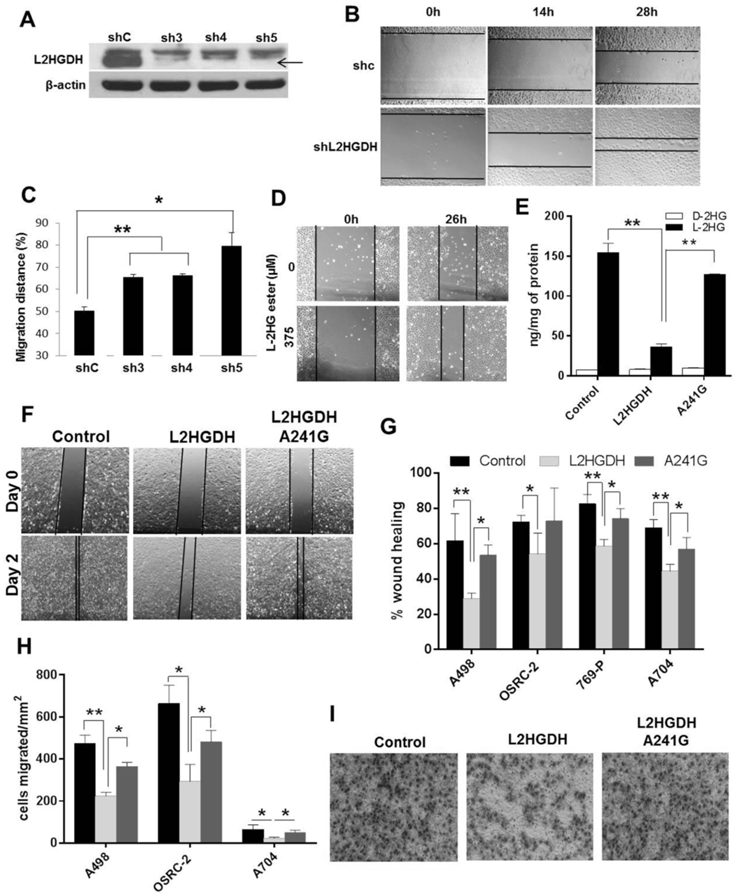
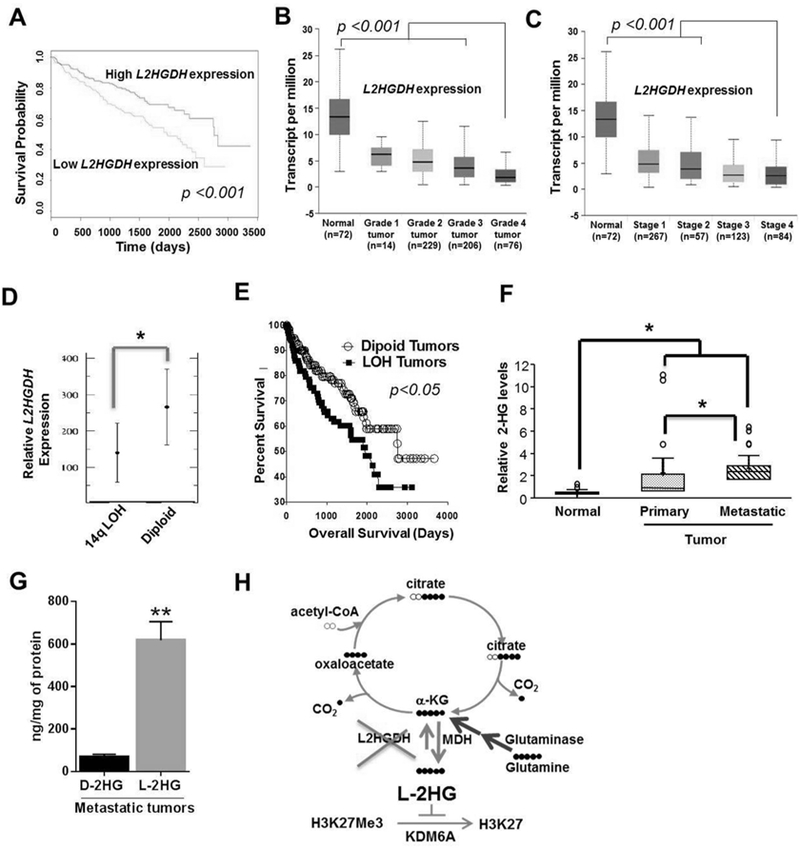
Purpose: Elevation of L-2-hydroxylgutarate (L-2-HG) in renal cell carcinoma (RCC) is due in part to reduced expression of L-2-HG dehydrogenase (L2HGDH). However, the contribution of L-2-HG to renal carcinogenesis and insight into the biochemistry and targets of this small molecule remains to be elucidated.

Experimental design: Genetic and pharmacologic approaches to modulate L-2-HG levels were assessed for effects on in vitro and in vivo phenotypes. Metabolomics was used to dissect the biochemical mechanisms that promote L-2-HG accumulation in RCC cells. Transcriptomic analysis was utilized to identify relevant targets of L-2-HG. Finally, bioinformatic and metabolomic analyses were used to assess the L-2-HG/L2HGDH axis as a function of patient outcome and cancer progression.

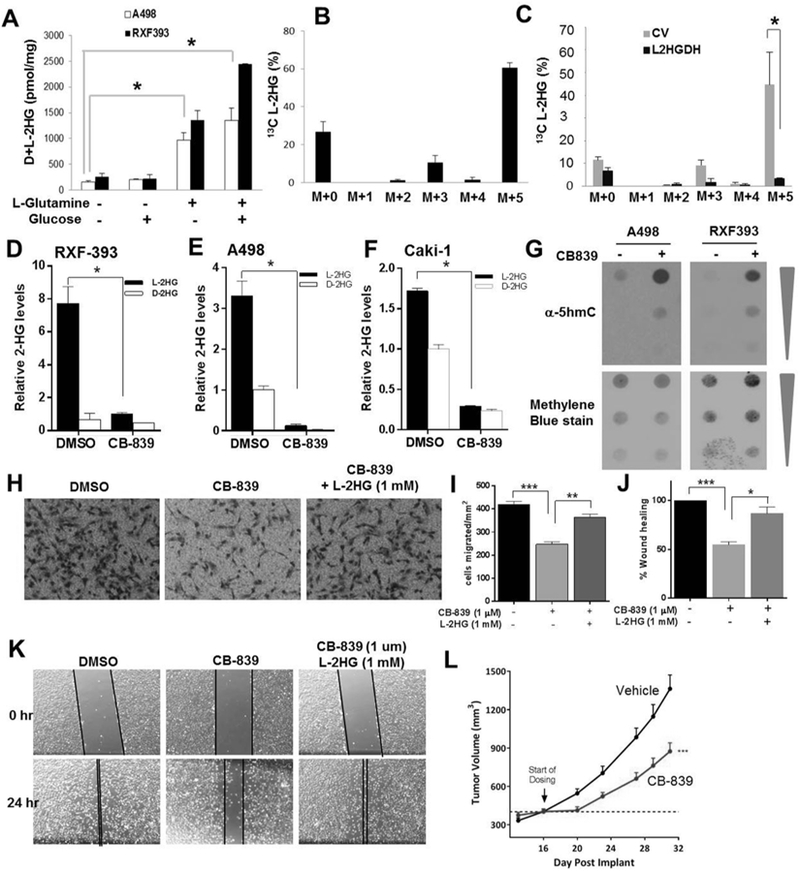
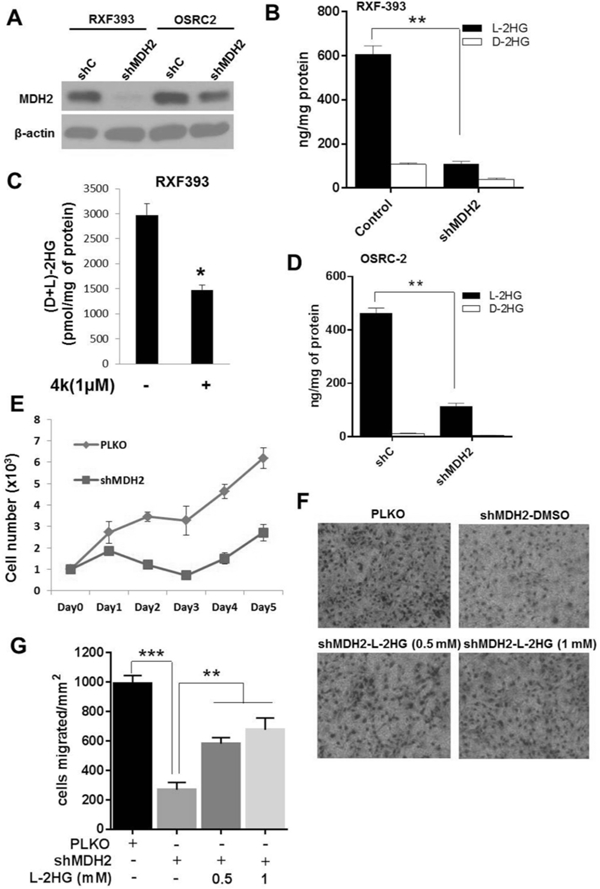
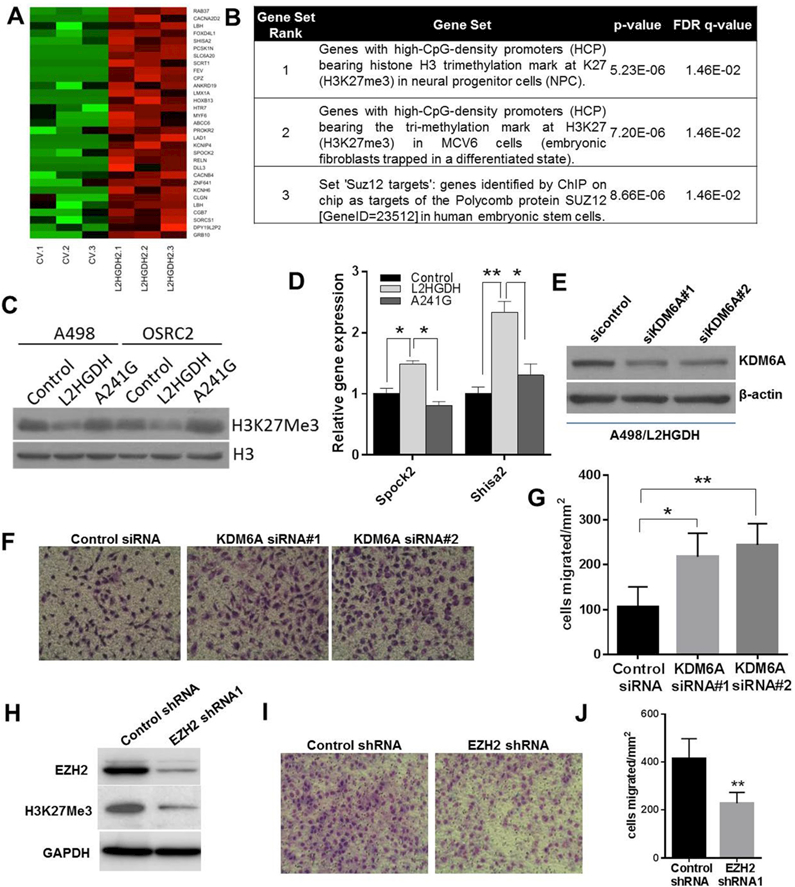
Results: L2HGDH suppresses both in vitro cell migration and in vivo tumor growth and these effects are mediated by L2HGDH's catalytic activity. Biochemical studies indicate that glutamine is the predominant carbon source for L-2-HG via the activity of malate dehydrogenase 2 (MDH2). Inhibition of the glutamine-MDH2 axis suppresses in vitro phenotypes in an L-2-HG-dependent manner. Moreover, in vivo growth of RCC cells with basal elevation of L-2-HG is suppressed by glutaminase inhibition. Transcriptomic and functional analyses demonstrate that the histone demethylase KDM6A is a target of L-2-HG in RCC. Finally, increased L-2-HG levels, L2HGDH copy loss, and lower L2HGDH expression are associated with tumor progression and/or worsened prognosis in patients with RCC.

Conclusions: Collectively, our studies provide biochemical and mechanistic insight into the biology of this small molecule and provide new opportunities for treating L-2-HG-driven kidney cancers.


Conflict of interest statement

Conflicts of Interest: E. Emberley, A. Pan, J. Cheng, and T. Huang are employees of Calithera Biosciences. All other authors have declared no conflict of interest exist.

Figures

Figure 1.
Figure 1.. The L2HGDH/L-2-HG axis regulates migratory phenotypes.
(A) HK-2 cells were transduced with control shRNA or three shRNAs targeting L2HGDH (sh3, sh4 and sh5) and puromycin resistant cells were selected to generate pooled stable cell lines. Validation of L2HGDH knockdown by immunoblotting (black arrow). (B and C) Wound healing of shL2HGDH stable cell lines seen using time-lapse phase contrast photography. Migration distance (%) calculated at 28 hr post-wound healing. Data are representative of two independent experiments (n=3/group). (D) Representative bright field images captured 26 hr post-wound creation in HK-2 cells treated with L-2-HG octyl ester. Data are representative of two independent experiments. (E) LC-MS analysis of L-2-HG and D-2-HG levels in control vector, WT L2HGDH, A241G expressing A498 cells. (F) Representative bright field images of A498 cells at day 0 and day 2 post-wound creation. (G) Relative wound healing of A498, OSRC-2, 769-P, A704 stably expressing control, L2HGDH and A241G vectors at 48, 36, 24 and 120 hrs post-wound creation, respectively. Data shown are the means ± SEM of two independent experiments (n=3/group). (H) Quantification of RCC cell migration (A498, OSRC-2, and A704) expressing control, L2HGDH and A241G. Data shown are the means ± SEM of two independent experiments (n=3/group). (I) Representative images of cell migration of A498 cells stably expressing control, L2HGDH and A241G vectors after 16 hrs incubation. (* indicates p < 0.05, ** indicates p < 0.01).
Figure 2.
Figure 2.. L2HGDH re-expression suppresses in vivo tumor growth of RCC cells.
(A-B) RXF-393 cells stably expressing control vector and wildtype L2HGDH were subcutaneously injected in 6 week old nude mice (n=10 per experimental group). Caliper measurements of the tumor were taken on the indicated days and the tumor volume at end of study was calculated. (C and D) Growth curves for OSRC-2 and A498 cells stably expressing wildtype L2HGDH and catalytic mutant A241G following subcutaneous injection in 6 week old nude mice (n=10 per experimental group). (E) Representative images of nude mice showing tumor growth of A498 cells stably expressing WT L2HGDH (red arrow) and A241G (blue arrow). Representative images (F) and average weights (G) of the harvested tumors of OSRC2 and A498 cells (L2HGDH and 241G) at the end of study. Data shown are the means ± SEM. (* indicates p < 0.05, ** indicates p < 0.01, *** indicates p < 0.001).
Figure 3.
Figure 3.. The role of glutamine in L-2-HG metabolism.
(A) A498 and RXF-393 cells were incubated in media containing either 5mM Glucose and/or 2mM L-Glutamine for 24 h. Total 2-HG level was measured. (B) L-2-HG isotopologue analysis showing abundance of 13C labelled L-2-HG in A498 cells starved for glutamine for 4 hrs and treated with 2mM 13C5 L-glutamine for 6 hrs. (C) L-2-HG isotopologue analysis showing abundance of 13C labelled L-2-HG in A498 cells (control and L2HGDH) starved for glutamine for 4 hrs and then incubated with 2mM 13C5 L-glutamine for 6 h. (D-F) Relative L-2-HG and D-2-HG levels of A498 (D), RXF-393 (E), and Caki-1 (F) RCC cells treated with glutaminase inhibitor CB-839 (1 µM) for 72 hrs. (G) Dot blot analysis of 5hmc levels in A498 and RXF-393 cells treated with CB-839 (1 µM) for 72 hrs. Upper panel: immunoblot for 5hmc. Bottom panel: methylene blue (MB) staining for total gDNA. (H-K) Caki-1 cells were treated with CB-839 (1 µM) for 48 hrs with or without L-2-HG (1 mM). Cells were harvested and then assessed for migration via Boyden chamber assay (panels H,I) and scratch assay (panels J,K). Data shown are the means ± SEM of two independent experiments (n=3/groups). (L) Growth curve of Caki-1 tumor xenografts in nude mice treated with vehicle or CB-839.
Figure 4.
Figure 4.. Knockdown of MDH lowers L-2-HG and suppresses in vitro tumor phenotypes in RCC cells.
OSRC-2 and RXF-393 cells were transduced with PLKO control and shMDH2 vectors. (A) Western blot analysis of MDH2 knockdown in RXF-393 and OSRC-2 cells. (B) Intracellular L-2-HG and D-2-HG level in shMDH2 transduced RXF-393 cells. (C) RXF-393 cells were treated with MDH inhibitor (4k, 1uM) for 48 h, harvested, and assayed for total 2-HG levels. (D) Intracellular L-2-HG and D-2-HG levels in PLKO and shMDH2 transduced OSRC-2 cells. (E) Proliferation of OSRC-2 cells transduced with control PLKO and shMDH2 vector. Data shown are the means ± SEM of two independent experiments (n=3/group). (F, G) OSRC-2 cells transduced with shMDH2 were treated with or without L-2-HG ester (0.5 and 1 mM) for 48 hrs and allowed to migrate in Boyden’s chamber for 16 hrs. (F) Representative images of OSRC-2 cells migrated in Boyden’s chamber. (G) Quantification of OSRC-2 cells migrated in Boyden’s chamber. Data shown are the means ± SEM of two independent experiments (n=3/group). (* indicates p < 0.05, ** indicates p < 0.01, *** indicates p < 0.001).
Figure 5.
Figure 5.. High L-2-HG inhibits activity of histone lysine demethylase to promote H3K27 trimethylation in RCC cells.
(A) Heat map of PRC2/H3K27me3 target genes with increased expression upon L2HGDH restoration (n=3/group). (B) GSEA of genes with increased expression upon L2HGDH restoration. (C) Immunoblots of H3K27Me3 levels in A498 and OSRC-2 cells expressing control, WT L2HGDH, and L2HGDH A241G. (D) Relative mRNA levels of SPOCK2 and SHISA2 in A498 cells stably expressing control, WT L2HGDH, and L2HGDH mutant A241G measured using RT-qPCR. (E) A498 cells expressing L2HGDH were treated with the indicated siRNA and then assessed by immunoblotting for KDM6A protein levels. (F) Representative images of A498/L2HGDH cells treated with the indicated siRNA migrated through a transwell insert. (G) Quantification of migration of A498/L2HGDH cells treated with the indicated siRNA. Data shown are the means ± SEM of two independent experiments (n=3/group). (H) Immunoblot for EZH2 and H3K27me3 in A498 cells transduced with control or EZH2 shRNA. (I) Representative images of A498 cells transduced with the indicated shRNA migrated through a transwell insert. (J) Quantification of migration of A498 cells transduced with the indicated shRNA. Data shown are the means ± SEM of two independent experiments (n=3/group). (* indicates p < 0.05, ** indicates p < 0.01).
Figure 6.
Figure 6.. Prognostic Significance of L2HGDH expression in RCC patients.
(A) Kaplan-Meier survival curve analysis in patients from TCGA data set with tumors expressing low L2HGDH mRNA expression (bottom 50%) relative to patients with tumors with high L2HGDH expression (upper 50%). Expression of L2HGDH (transcript per million) in increasing grades (Grade 1–4) (B) and stages (Stage 1–4) (C) of kidney tumors of patients from TCGA data set. (D) Relative L2HGDH mRNA expression as a function of 14q LOH. Data extracted from Sato et al. (E) Percentage survival curve of patients from TCGA data set as a function of L2HGDH copy number. (F) Relative total (D+L)-2-HG levels in normal, primary and metastatic kidney RCC deposits. (G) D-2-HG and L-2-HG levels in metastatic tumor deposits (n=3). (H) Graphical representation of biochemical axis of L-2-HG accumulation in RCC and therapeutic potential of glutaminase and MDH inhibitors to lower L-2-HG. (* indicates p <0.05 and ** indicates p <0.01).

Comment in

Similar articles

Cited by

References

    1. Yan H, Parsons DW, Jin G, McLendon R, Rasheed BA, Yuan W, et al. IDH1 and IDH2 mutations in gliomas. N Engl J Med 2009;360:765–73. - PMC - PubMed
    1. Amary MF, Bacsi K, Maggiani F, Damato S, Halai D, Berisha F, et al. IDH1 and IDH2 mutations are frequent events in central chondrosarcoma and central and periosteal chondromas but not in other mesenchymal tumours. The Journal of pathology 2011;224:334–43. - PubMed
    1. Dang L, White DW, Gross S, Bennett BD, Bittinger MA, Driggers EM, et al. Cancer-associated IDH1 mutations produce 2-hydroxyglutarate. Nature 2009;462:739–44. - PMC - PubMed
    1. Mardis ER, Ding L, Dooling DJ, Larson DE, McLellan MD, Chen K, et al. Recurring mutations found by sequencing an acute myeloid leukemia genome. The New England journal of medicine 2009;361:1058–66. - PMC - PubMed
    1. Ward PS, Patel J, Wise DR, Abdel-Wahab O, Bennett BD, Coller HA, et al. The common feature of leukemia-associated IDH1 and IDH2 mutations is a neomorphic enzyme activity converting alpha-ketoglutarate to 2-hydroxyglutarate. Cancer Cell 2010;17:225–34. - PMC - PubMed

Publication types

MeSH terms