. 2018 Sep 26;38(39):8421-8432.
doi: 10.1523/JNEUROSCI.0808-18.2018. Epub 2018 Aug 14.

Interneuron Simplification and Loss of Structural Plasticity As Markers of Aging-Related Functional Decline

Affiliations

Interneuron Simplification and Loss of Structural Plasticity As Markers of Aging-Related Functional Decline

Ronen Eavri et al. J Neurosci. .

Abstract

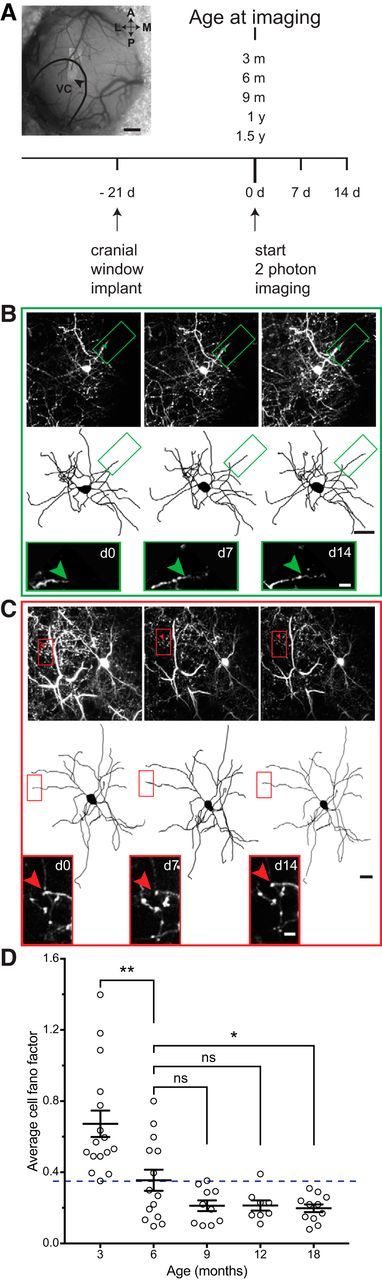
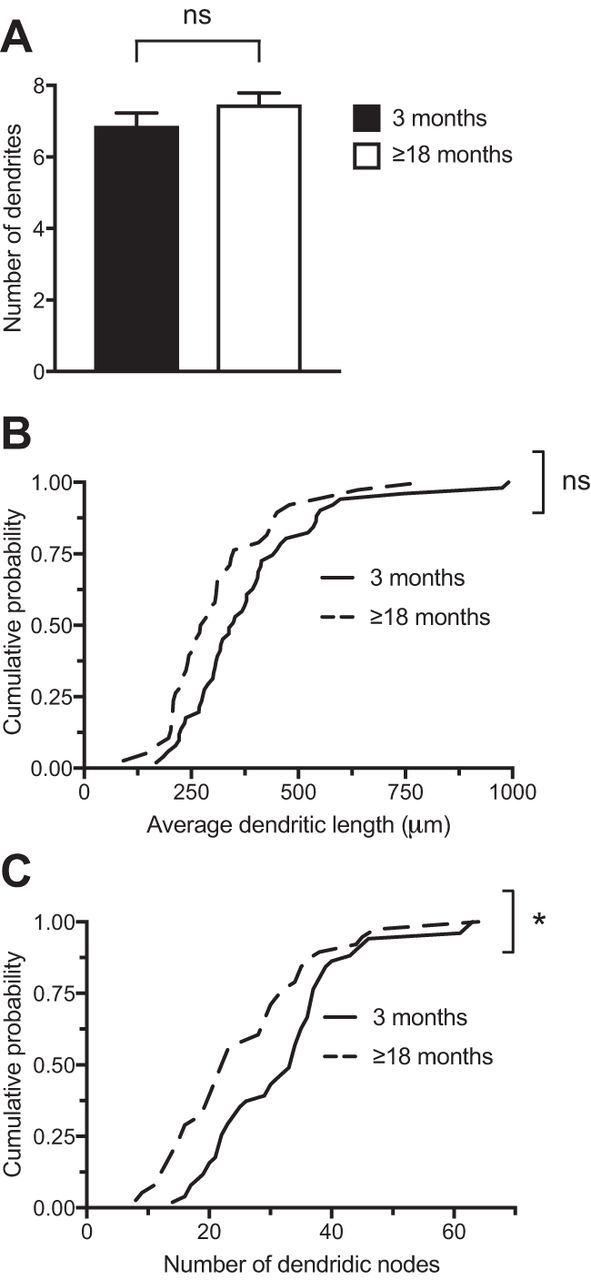
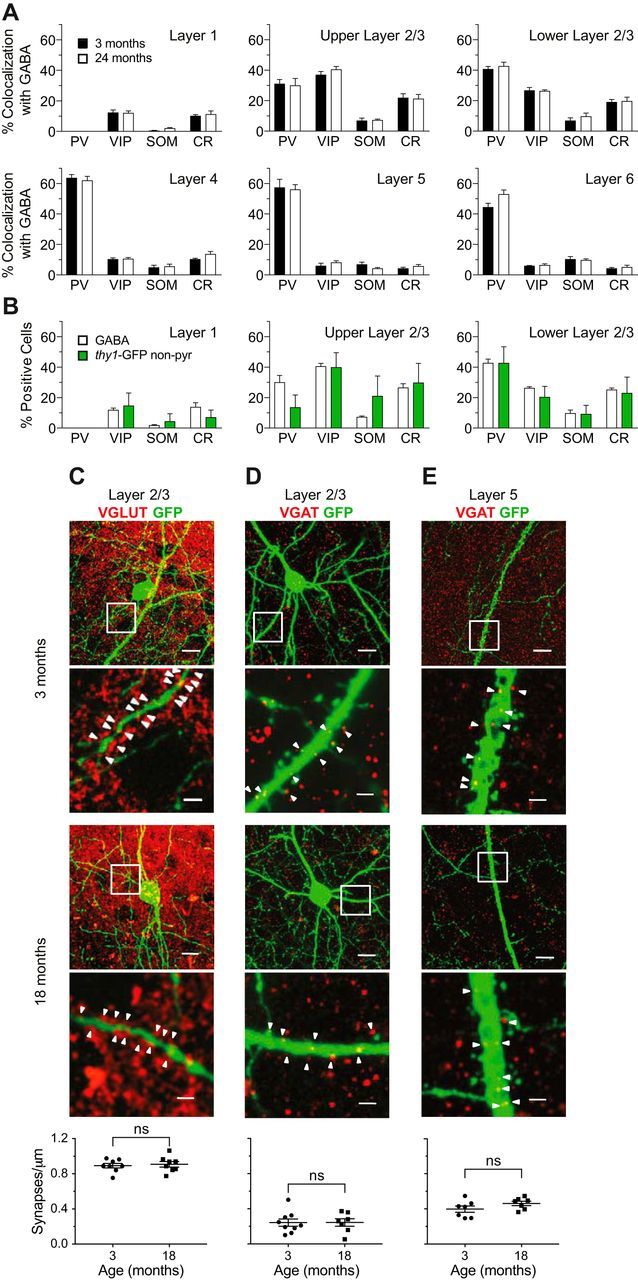
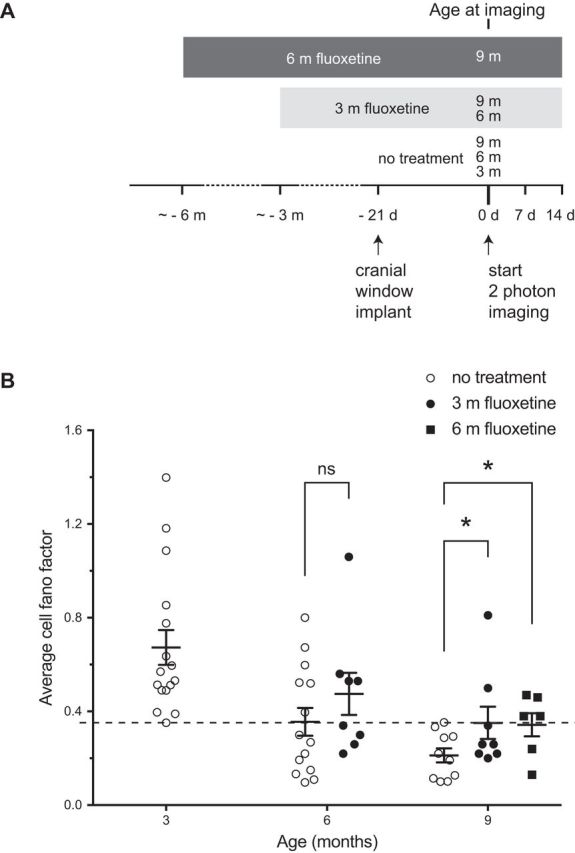
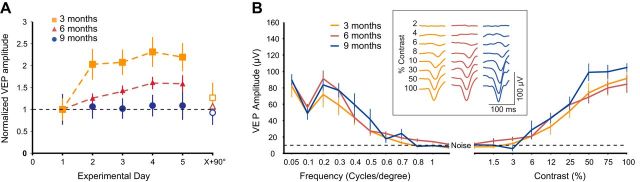
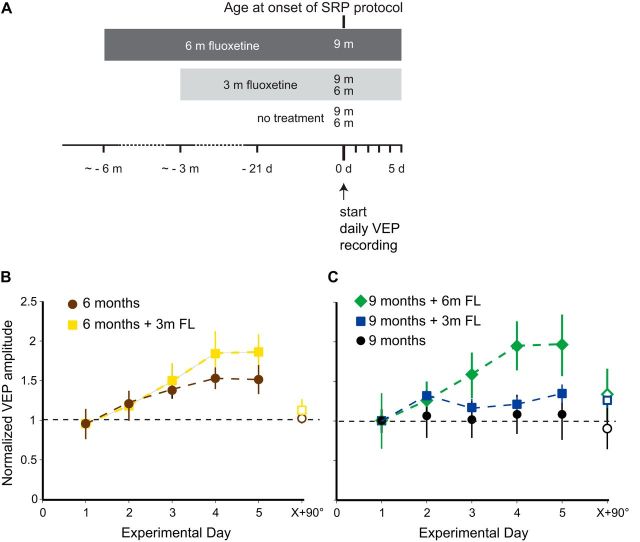
Changes in excitatory neuron and synapse structure have been recognized as a potential physical source of age-related cognitive decline. Despite the importance of inhibition to brain plasticity, little is known regarding aging-associated changes to inhibitory neurons. Here we test for age-related cellular and circuit changes to inhibitory neurons of mouse visual cortex. We find no substantial difference in inhibitory neuron number, inhibitory neuronal subtypes, or synapse numbers within the cerebral cortex of aged mice compared with younger adults. However, when comparing cortical interneuron morphological parameters, we find differences in complexity, suggesting that arbors are simplified in aged mice. In vivo two-photon microscopy has previously shown that in contrast to pyramidal neurons, inhibitory interneurons retain a capacity for dendritic remodeling in the adult. We find that this capacity diminishes with age and is accompanied by a shift in dynamics from balanced branch additions and retractions to progressive prevalence of retractions, culminating in a dendritic arbor that is both simpler and more stable. Recording of visually evoked potentials shows that aging-related interneuron dendritic arbor simplification and reduced dynamics go hand in hand with loss of induced stimulus-selective response potentiation (SRP), a paradigm for adult visual cortical plasticity. Chronic treatment with the antidepressant fluoxetine reversed deficits in interneuron structural dynamics and restored SRP in aged animals. Our results support a structural basis for age-related impairments in sensory perception, and suggest that declines in inhibitory neuron structural plasticity during aging contribute to reduced functional plasticity.SIGNIFICANCE STATEMENT Structural alterations in neuronal morphology and synaptic connections have been proposed as a potential physical basis for age-related decline in cognitive function. Little is known regarding aging-associated changes to inhibitory neurons, despite the importance of inhibitory circuitry to adult cortical plasticity and the reorganization of cortical maps. Here we show that brain aging goes hand in hand with progressive structural simplification and reduced plasticity of inhibitory neurons, and a parallel decline in sensory map plasticity. Fluoxetine treatment can attenuate the concurrent age-related declines in interneuron structural and functional plasticity, suggesting it could provide an important therapeutic approach for mitigating sensory and cognitive deficits associated with aging.

Keywords: aging; fluoxetine; inhibitory neurons; mice; two-photon microscopy; visually evoked potential.


Figures

Figure 1.
Figure 1.
Chronic two-photon in vivo imaging of dendritic branch tip dynamics in superficial L2/3 cortical interneurons. A, Left, A maximum z-projection (MZP) of chronically imaged interneuron (black arrow) superimposed over blood vessel map with primary visual cortex (VC) outlined. Right, The experimental timeline. B, MZP (top row) along with two-dimensional projections of three-dimensional skeletal reconstructions (middle row) of a superficial L2/3 interneuron acquired over 2 weeks in a 6-month-old animal. Green boxes indicate a dynamic branch tip shown at high-magnification in bottom. Green arrow marks the approximate distal end of the branch tip on the first day of imaging (d0). C, MZP (top row) and two-dimensional projections of three-dimensional skeletal reconstructions (middle row) of a superficial L2/3 interneuron acquired over 2 weeks in an 18-month-old animal. Red boxes indicate a stable branch tip shown at high-magnification in bottom. Red arrow shows no change in the distal branch tip over 2 weeks of imaging. D, Average cell FF (dynamic index) at different ages. Each circle represents an individual cell. Dashed line marks the experimentally determined threshold for a dynamic cell. The 3 month group has a significantly higher average FF than the 6 month group (**p = 0.0012, by bootstrap using Holm–Sidak's test with α = 0.05 to correct for multiple comparisons, n = 16 for 3 and 14 for 6 months). The 6 month group is significantly different from the 18 month time point (*p = 0.0229, by bootstrap using Holm–Sidak's test with α = 0.05 to correct for multiple comparisons, n = 14 for 6 and 11 for 18 months), but does not differ from the later ages (p = 0.0607 for 6 vs 9 months, p = 0.0607 for 6 vs 12 months, by bootstrap using Holm–Sidak's test with α = 0.05 to correct for multiple comparisons, n = 14 for 6 months, 10 for 9 months, and 8 for 12 months,). Error bars represent SD of the bootstrapped population. Scale bars: A, 200 μm; B, C (on cells), 20 μm; B, C (on tips), 5 μm.
Figure 2.
Figure 2.
Interneuron dendritic arbors simplify with age. A, The number of primary dendrites of V1 interneurons does not change between 3 and 18 months (p = 0.23, unpaired two-tailed Student's t test, n = 51 for 3 months, 38 for ≥18 months). B, The distribution of total dendritic lengths in V1 does not change between 3 and 18 months (p = 0.059, Kolmogorov–Smirnov test, n = 51 for 3, 38 for ≥18 months). C, The distribution of the number of dendritic nodes shifts toward fewer nodes between 3 and 18 months (*p = 0.029, Kolmogorov–Smirnov test, n = 51 for 3, 38 for ≥18 months). Each n represents one cell for all panels in this figure. Error bars represent SEM.
Figure 3.
Figure 3.
Interneuron subtype representation in layers of mouse visual cortex. A, Plots showing colocalization of GABA with: PV, VIP, SOM, and CR subtype markers in layers of visual cortex in young adult (3 months) or aged (24 months). A total of 25669 GABA-positive cells were counted. For each subtype in each layer, the percentage at 3 and 24 months was compared using a two-tailed Student's t test. Holm–Sidak's method with α = 0.05 was used to correct for multiple comparisons. The relative representation of interneuron subtypes within different cortical layers was largely unchanged in aged compared with young mice (p = 0.044 for SOM in layer 1, p = 0.69 for SOM in layer 5, p = 0.84 for PV in layer 6, and p > 0.99 for all other subtypes across layers, n = 3–5 mice for 3 months and 3–6 mice for 4 months). B, Interneuron subtype representation in the thy1-GFP-labeled nonpyramidal cells in the superficial layers of visual cortex in aged mice compared with subtype representation in the GABA-positive population in the same layers. For the GABA-positive group, the same data were used as in A. A total of 399 GFP nonpyramidal cells and 5262 GABA-positive cells were examined. For each subtype in each layer, the percentage GABA-positive and GFP-nonpyramidal was compared using a two-tailed Student's t test. Holm–Sidak's method with α = 0.05 was used to correct for multiple comparisons. Representation of the subtypes was not different between GABA-positive and GFP-nonpyramidal cells (p = 0.95 for PV in upper layer 2/3, p = 0.98 for CR in layer 1, and p > 0.99 for all other subtypes across layers, n = 3 mice for the GABA-positive cells and 6–8 for the GFP-nonpyramidal cells). C, Representative images of excitatory synapses (VGLUT) on L2/3 interneuron dendrites (GFP), at 3 months (top 2 panels) and 18 months (middle 2 panels). The second and fourth panels are enlargements of the boxed regions marked in the first and third panels, respectively. Synapse densities are quantified in the bottom panel. Each data point represents one animal. There is no statistically significant difference between the two ages (p = 0.69, unpaired two-tailed Student's t test, n = 8). D, Same as in C, except inhibitory synapses (VGAT) on L2/3 pyramidal neuron basal dendrites (GFP). There is no statistically significant difference between the two ages (p = 0.99, unpaired two-tailed Student's t test, n = 7–9). E, Same as in C, except inhibitory synapses (VGAT) on L5 pyramidal neuron apical dendrites (GFP). There is no statistically significant difference between the two ages (p = 0.17, unpaired two-tailed Student's t test, n = 7). Scale bars: first and third panels, 10 μm; second and fourth panels, 2 μm. All error bars represent SEM.
Figure 4.
Figure 4.
Fluoxetine treatment increases interneuron dynamics in aged mice. A, Experimental time line. B, Average cell FF at different ages. Each circle represents an individual cell. Dashed line marks the experimentally determined threshold (FF = 0.35) for a dynamic cell. The nontreated cells are also shown in Figure 1D. Fluoxetine treatment from 3 to 6 months has no effect on the average cell FF compared with 6 month controls (p = 0.13, by bootstrap, n = 14 for untreated, n = 8 for treated). Treatment from 6 to 9 months compared with 9 month controls significantly increased the average cell FF (*p = 0.043, by bootstrap using Holm–Sidak's test with α = 0.05 to correct for multiple comparisons, n = 10 for untreated, 8 for treated), as did treatment from 3 to 9 months (*p = 0.043, by bootstrap using Holm–Sidak's test with α = 0.05 to correct for multiple comparisons, n = 10 for untreated, 6 for treated). However, the longer treatment resulted in FF improvement for a larger fraction of animals (25% for 3 months vs 67% for 6 months). Error bars represent SD of the bootstrapped population.
Figure 5.
Figure 5.
Stimulus response potentiation is absent in aged mice. A, SRP was induced in mouse visual cortex by repeated presentations of sinusoidal gratings. Three-month-old mice (orange squares) exhibited large and sustained potentiation of binocular VEPs over many days of exposure to the same stimulus orientation (Day 5 = 2.2 ± 0.32-fold increase over Day 1; paired t test p = 0.0068, n = 5). Six-month-old mice (red triangles) exhibited less potentiation on average per day than 3-month-old mice but still exhibited significant SRP (Day 5 = 1.6 ± 0.19-fold increase over Day 1; paired t test p = 0.00035, n = 10) and 9-month-old mice (blue circles) did not exhibit any statistically significant potentiation (Day 5 = 1.08 ± 0.32-fold increase over Day 1; paired t test p = 0.675, n = 5). B, Binocular VEPs were recorded at different frequencies of sinusoidal gratings or with different contrast percentages. No differences were observed between the groups (F(2,26) = 0.623, p = 0.542; repeated-measures MANOVA). Error bars represent ± SEM. Inset, Average VEP waveforms for each age group as contrast was increased.
Figure 6.
Figure 6.
Chronic fluoxetine treatment of aged mice maintains stimulus response potentiation. A, Experimental time line. SRP was tested at 6 months, with or without 3 months of fluoxetine treatment, or at 9 months untreated or after 3 or 6 months of fluoxetine treatment. B, Fluoxetine treatment (yellow squares) had no significant effect on SRP in 6-month-old mice measured on Day 5 (Day 5 = 1.95 ± 0.23-fold increase over Day 1; n = 6) compared with untreated 6-month-old mice (brown circles; Day 5 = 1.6 ± 0.19-fold increase over Day 1; unpaired two-tailed Student's t test p = 0.256, n = 10). C, Three months of fluoxetine treatment had no statistically significant effect on SRP in 9-month-old mice (green diamonds; Day 5 = 1.35 ± 0.11-fold increase over Day 1; n = 11) compared with untreated 9-month-old mice (black circles; Day 5 = 1.08 ± 0.32-fold increase over Day 1; t test p = 0.339, n = 5), but 6 months of treatment significantly increased SRP in 9-month-old (blue squares) mice compared with untreated mice (Day 5 = 1.95 ± 0.39-fold increase over Day 1; t test p = 0.0405, n = 5).

References

    1. Andersen GJ. (2012) Aging and vision: changes in function and performance from optics to perception. Wiley Interdiscip Rev Cogn Sci 3:403–410. 10.1002/wcs.1167 - DOI - PMC - PubMed
    1. Anderson B, Rutledge V (1996) Age and hemisphere effects on dendritic structure. Brain 119:1983–1990. 10.1093/brain/119.6.1983 - DOI - PubMed
    1. Bloss EB, Janssen WG, Ohm DT, Yuk FJ, Wadsworth S, Saardi KM, McEwen BS, Morrison JH (2011) Evidence for reduced experience-dependent dendritic spine plasticity in the aging prefrontal cortex. J Neurosci 31:7831–7839. 10.1523/JNEUROSCI.0839-11.2011 - DOI - PMC - PubMed
    1. Buhl EH, Tamás G, Szilágyi T, Stricker C, Paulsen O, Somogyi P (1997) Effect, number and location of synapses made by single pyramidal cells onto aspiny interneurones of cat visual cortex. J Physiol 500:689–713. 10.1113/jphysiol.1997.sp022053 - DOI - PMC - PubMed
    1. Chattopadhyaya B, Di Cristo G, Higashiyama H, Knott GW, Kuhlman SJ, Welker E, Huang ZJ (2004) Experience and activity-dependent maturation of perisomatic GABAergic innervation in primary visual cortex during a postnatal critical period. J Neurosci 24:9598–9611. 10.1523/JNEUROSCI.1851-04.2004 - DOI - PMC - PubMed

Publication types

Substances