

Identification of an oncogenic network with prognostic and therapeutic value in prostate cancer
- PMID: 30108134
- PMCID: PMC6684952
- DOI: 10.15252/msb.20188202
Identification of an oncogenic network with prognostic and therapeutic value in prostate cancer
Abstract
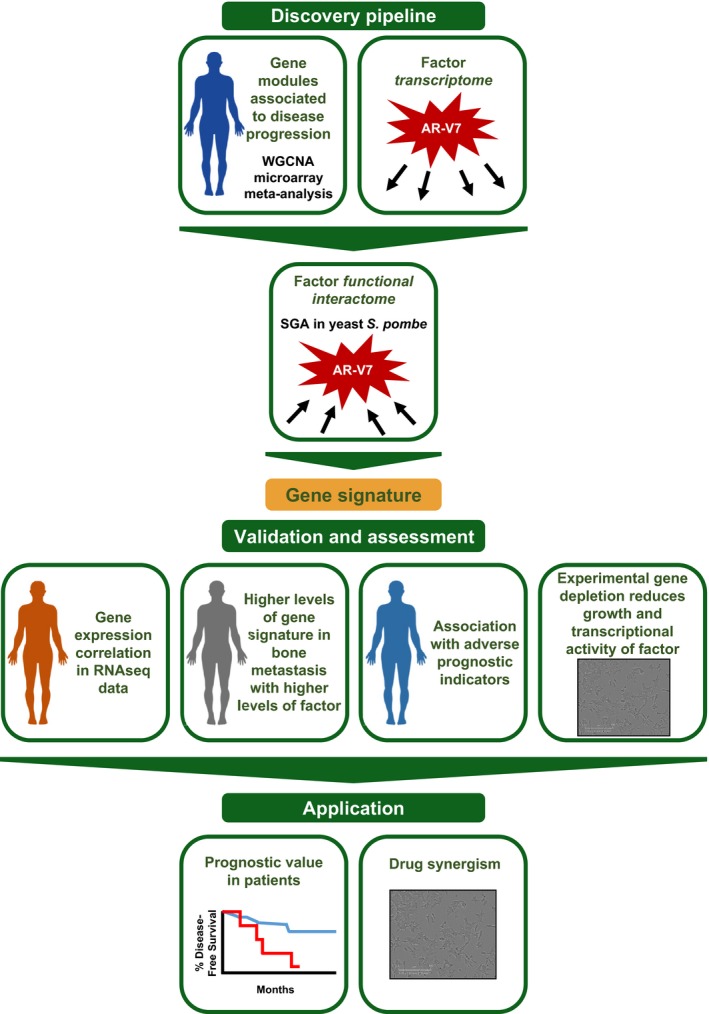
Identifying critical pathways governing disease progression is essential for accurate prognosis and effective therapy. We developed a broadly applicable and novel systems-level gene discovery strategy. This approach focused on constitutively active androgen receptor (AR) splice variant-driven pathways as representative of an intractable mechanism of prostate cancer (PC) therapeutic resistance. We performed a meta-analysis of human prostate samples using weighted gene co-expression network analysis combined with experimental AR variant transcriptome analyses. An AR variant-driven gene module that is upregulated during human PC progression was identified. We filtered this module by identifying genes that functionally interacted with AR variants using a high-throughput synthetic genetic array screen in Schizosaccharomyces pombe This strategy identified seven AR variant-regulated genes that also enhance AR activity and drive cancer progression. Expression of the seven genes predicted poor disease-free survival in large independent PC patient cohorts. Pharmacologic inhibition of interacting members of the gene set potently and synergistically decreased PC cell proliferation. This unbiased and novel gene discovery strategy identified a clinically relevant, oncogenic, interacting gene hub with strong prognostic and therapeutic potential in PC.
Keywords: androgen receptor splice variants; castration resistance; mitotic gene signature; weighted gene co‐expression network analysis; yeast synthetic genetic array.
© 2018 The Authors. Published under the terms of the CC BY 4.0 license.
Conflict of interest statement
The authors declare that they have no conflict of interest.
Figures
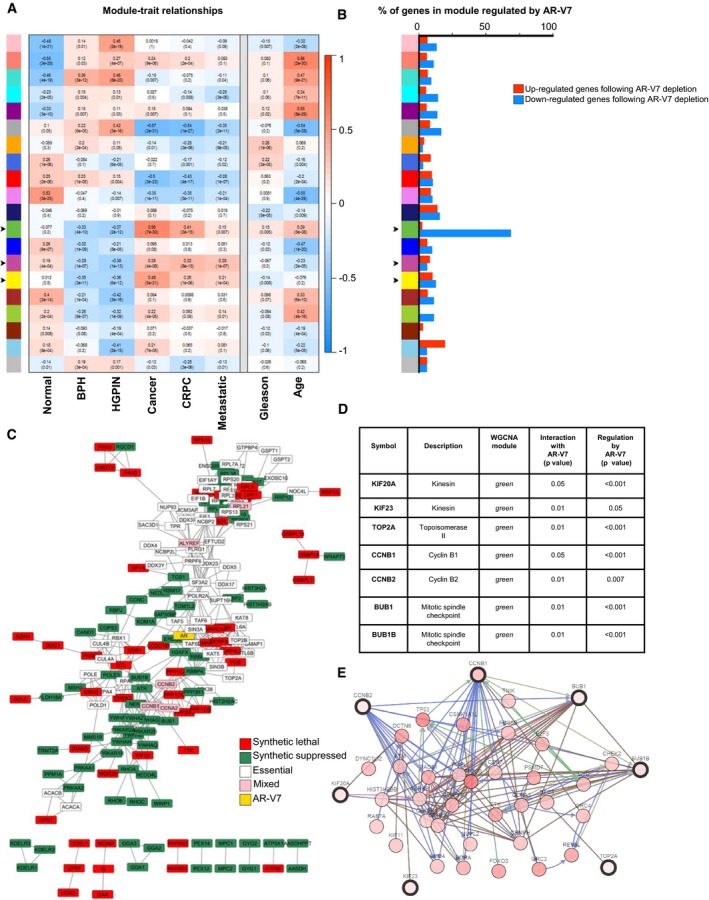
Module–trait relationships were established by WGCNA using eight independent microarray analyses comprising 375 human prostate samples. Gene modules (y‐axis) are denoted by an arbitrary color name. Bins show the Pearson correlation value between gene expression levels of each module within the noted phenotype/disease stage (x‐axis) and P‐values. A value of 1 (red) quantifies the strongest positive correlation (genes are upregulated), −1 (blue) the strongest negative correlation (genes are downregulated), and 0 (white) no correlation. Arrows indicate those modules whose genes were positively associated with PC.
Microarray analysis was performed following doxycycline‐regulated specific AR‐V7 depletion (using a tet‐pLKO backbone) in 22Rv1 PC cells compared to doxycycline‐treated shGFP controls. The genes that were significantly regulated by shAR‐V7 (in either direction, P‐value < 0.05) were distributed among the gene modules defined by WGCNA in panel (A). Upregulated genes (red) are those in which expression increased following AR‐V7 depletion, and conversely, downregulated genes (blue) are those that decreased following AR‐V7 depletion. Arrows indicate those modules whose genes were positively associated with PC.
AR‐V7 human functional interactome was generated using SGA screening in the yeast Schizosaccharomyces pombe, combined with STRING data to map protein–protein interactions, followed by the identification of the human orthologs. The colors denote the different types of genetic interactions: Red are genes that when deleted in yeast and crossed with AR‐V7‐expressing yeast suppressed growth, while green denotes genes that when deleted enhanced growth. White designates yeast essential genes (i.e., genes that are critical for yeast survival and thus could not be present in the yeast deletion library), but were incorporated into the network based on the criteria that they are known (based on literature) to physically interact with at least two of the red or green genes. Pink‐colored genes are a combination of essential and non‐essential genes identifying the same human protein.
Table summarizing the seven PC hub genes identified by the system‐level analyses.
Network interactions of the seven genes with the 50 most frequently altered neighbor genes were mapped using cbioportal.org. The types of gene‐to‐gene interactions are as follows: controls state change (blue), controls expression (green), and in complex with (brown).
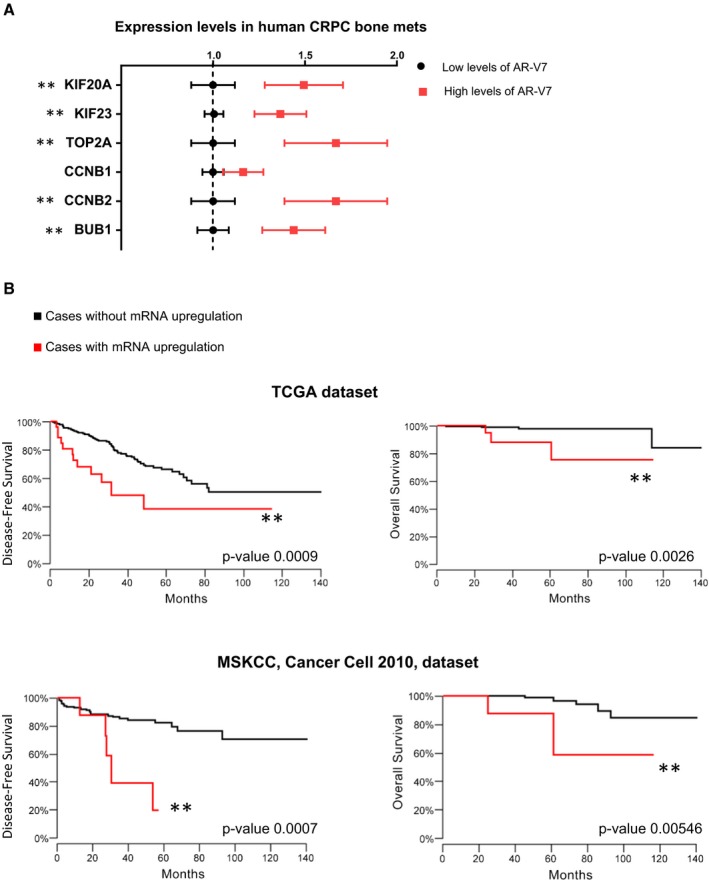
Hörnberg et al (2011) gene expression profiling array data were analyzed to determine the expression levels of the seven genes in human CRPC bone metastases, grouped by their relative levels of AR variants, mainly AR‐V7 [high levels of AR‐V7 (top quartile) or low levels of AR‐V7 (quartiles 1–3)]. Data are plotted as the mean ± s.e.m. Non‐parametric Mann–Whitney test was performed (two‐tailed). Note that BUB1B expression was not measured in these microarrays. **P‐value < 0.05. N (AR‐V7 low) = 20; N (AR‐V7 high) = 10.
The Kaplan–Meier curves for disease‐free survival (DFS) and overall survival were built using the TCGA Prostate Adenocarcinoma dataset (465 samples; upper graphs). Log rank tests were performed. The black curves denote cases with normal expression of the gene set, and red represents cases where the mRNA levels of the seven genes were upregulated (z‐score threshold ≤ 1.96). For DFS, P‐value = 0.0009; for death, P‐value = 0.0026. An independent dataset was analyzed (Prostate Adenocarcinoma MSKCC, Cancer Cell 2010, 123 samples; lower graphs). The black curves denote cases with normal expression of the gene set, and red represents cases where the mRNA levels of at least five genes of the gene set were upregulated (z‐score threshold ≤ 1.96). For DFS, P‐value = 0.0007; for death, P‐value = 0.00546.
- A
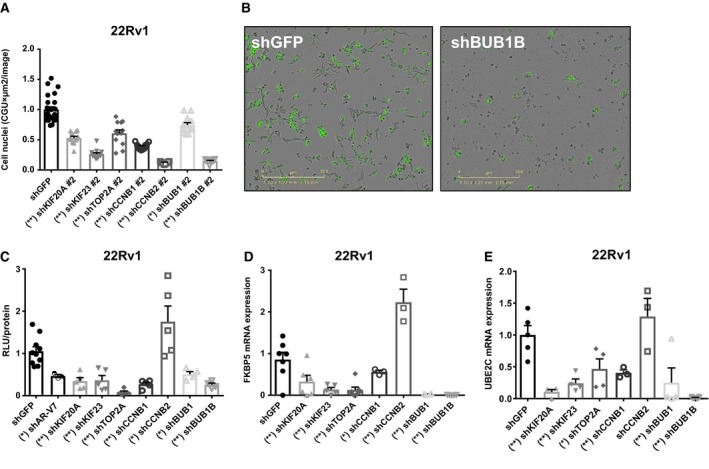
Cell proliferation was examined in the CRPC cell line 22Rv1 following individual depletion of mRNAs for the seven genes or shGFP controls, using shRNA against the coding region for each gene (shRNA #2). Cell number was measured using a non‐perturbing nuclear restricted dye and quantified after 72 h using Incucyte Zoom System. Data shown are mean ± s.e.m. of eight to 12 replicates normalized to their shGFP control. Kruskal–Wallis test (P‐value < 0.0001, two‐tailed) and Dunn's multiple comparisons test were performed. *P‐value < 0.05, **P‐value < 0.001.
- B
Representative images of 22Rv1 stably depleted of BUB1B or control (shGFP) are shown.
- C
22Rv1 stably depleted of each of the seven genes were transfected with a dual‐plasmid luciferase reporter system which quantifies AR activity and basal transcription. The assay was conducted in 2% CSS to measure AR ligand‐independent transcriptional activity. Data represent two independent experiments performed in triplicate, showing the mean ± s.e.m., and normalized to their shGFP controls. Kruskal–Wallis test (P‐value < 0.0001, two‐tailed) and Dunn's multiple comparisons test were performed. *P‐value < 0.05, **P‐value < 0.001.
- D, E
The expression of FKBP5 and UBE2C determined by RT–qPCR analysis and normalized to GAPDH mRNA levels was examined in 22Rv1 cells stably expressing shRNA for each of the seven genes. Cells were cultured in 2% CSS. Data represent two independent experiments performed in duplicate or triplicate, showing the mean ± s.e.m., and normalized to their shGFP controls. Kruskal–Wallis test (P‐value < 0.0001, two‐tailed) and Dunn's multiple comparisons test were performed. *P‐value < 0.05, **P‐value < 0.001.
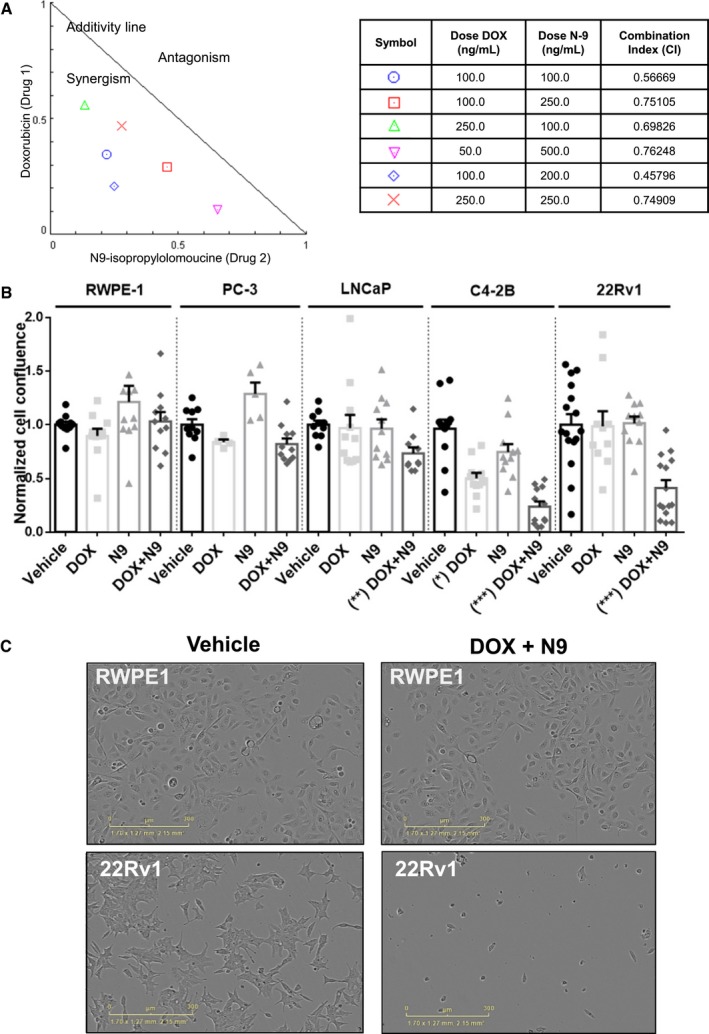
The CRPC cell line 22Rv1 was cultured in 2% CSS media and treated for 72 h with vehicle (DMSO), doxorubicin (DOX), N9‐isopropylolomoucine (N‐9), or the combination of DOX and N‐9 at different concentrations. Cell confluence was monitored using Incucyte Zoom System, and the experiments were done with eight replicates each. The data were analyzed using Compusyn software, and a normalized isobologram was built. The table shows the combination index (CI) for the different drug combinations. CI = 1 represents additivity, CI < 1 synergism, and CI > 1 antagonistic effects.
The non‐tumorigenic prostate epithelial cell line RWPE‐1, the AR‐null PC cell line PC‐3, the androgen‐dependent cell line LNCaP, and the CRPC cell lines C4‐2B and 22Rv1 were treated for 72 h with vehicle (DMSO), DOX [100 ng/ml (184 nM)], N‐9 [200 ng/ml (613 nM)], or the combination of DOX [100 ng/ml (184 nM)] and N‐9 [200 ng/ml (613 nM)]. C4‐2B and 22Rv1 cells were kept in 10% CSS media, and the other cell lines were kept in 10% FBS. Cell confluence was monitored using the Incucyte Zoom System. Data represent two independent experiments, with four to six replicates each, showing the mean ± s.e.m., and normalized to vehicle controls. Kruskal–Wallis test, (P‐value < 0.0001, two‐tailed) and Dunn's multiple comparisons test were performed. *P‐value < 0.05, **P‐value < 0.01, ***P‐value < 0.001.
The non‐tumorigenic prostate cell line RWPE‐1 and the CRPC cell line 22Rv1 were treated for 72 h with vehicle (DMSO) or the combination of DOX and N‐9 at 100 ng/ml and N‐9 200 ng/ml, respectively. Cell confluence was monitored using the Incucyte Zoom System and representative images are shown.
Similar articles
-
Vav3 enhances androgen receptor splice variant activity and is critical for castration-resistant prostate cancer growth and survival.Mol Endocrinol. 2012 Dec;26(12):1967-79. doi: 10.1210/me.2012-1165. Epub 2012 Sep 28. Mol Endocrinol. 2012. PMID: 23023561 Free PMC article.
-
Differential regulation of metabolic pathways by androgen receptor (AR) and its constitutively active splice variant, AR-V7, in prostate cancer cells.Oncotarget. 2015 Oct 13;6(31):31997-2012. doi: 10.18632/oncotarget.5585. Oncotarget. 2015. PMID: 26378018 Free PMC article.
-
Comprehensive Profiling of the Androgen Receptor in Liquid Biopsies from Castration-resistant Prostate Cancer Reveals Novel Intra-AR Structural Variation and Splice Variant Expression Patterns.Eur Urol. 2017 Aug;72(2):192-200. doi: 10.1016/j.eururo.2017.01.011. Epub 2017 Jan 16. Eur Urol. 2017. PMID: 28104311
-
Androgen receptor variant-driven prostate cancer: clinical implications and therapeutic targeting.Prostate Cancer Prostatic Dis. 2016 Sep;19(3):231-41. doi: 10.1038/pcan.2016.17. Epub 2016 May 17. Prostate Cancer Prostatic Dis. 2016. PMID: 27184811 Free PMC article. Review.
-
[Androgen receptor variants in prostate cancer].Med Sci (Paris). 2017 Aug-Sep;33(8-9):758-764. doi: 10.1051/medsci/20173308021. Epub 2017 Sep 18. Med Sci (Paris). 2017. PMID: 28945566 Review. French.
Cited by
-
Inhibition of the serine/threonine kinase BUB1 reverses taxane resistance in prostate cancer.iScience. 2023 Aug 18;26(9):107681. doi: 10.1016/j.isci.2023.107681. eCollection 2023 Sep 15. iScience. 2023. PMID: 37705955 Free PMC article.
-
Single Cell Gene Co-Expression Network Reveals FECH/CROT Signature as a Prognostic Marker.Cells. 2019 Jul 10;8(7):698. doi: 10.3390/cells8070698. Cells. 2019. PMID: 31295943 Free PMC article.
-
Multi-omics analysis defines 5-fluorouracil drug resistance in 3D HeLa carcinoma cell model.Bioresour Bioprocess. 2021 Dec 23;8(1):135. doi: 10.1186/s40643-021-00486-z. Bioresour Bioprocess. 2021. PMID: 38650282 Free PMC article.
-
Hypermethylation and Downregulation of UTP6 Are Associated With Stemness Properties, Chemoradiotherapy Resistance, and Prognosis in Rectal Cancer: A Co-expression Network Analysis.Front Cell Dev Biol. 2021 Aug 18;9:607782. doi: 10.3389/fcell.2021.607782. eCollection 2021. Front Cell Dev Biol. 2021. PMID: 34485268 Free PMC article.
-
The yin and yang of chromosomal instability in prostate cancer.Nat Rev Urol. 2024 Jun;21(6):357-372. doi: 10.1038/s41585-023-00845-9. Epub 2024 Feb 2. Nat Rev Urol. 2024. PMID: 38307951 Free PMC article. Review.
References
-
- Antonarakis ES, Lu C, Wang H, Luber B, Nakazawa M, Roeser JC, Chen Y, Mohammad TA, Chen Y, Fedor HL, Lotan TL, Zheng Q, De Marzo AM, Isaacs JT, Isaacs WB, Nadal R, Paller CJ, Denmeade SR, Carducci MA, Eisenberger MA et al (2014) AR‐V7 and resistance to enzalutamide and abiraterone in prostate cancer. N Engl J Med 371: 1028–1038 - PMC - PubMed
-
- Antonarakis ES, Lu C, Luber B, Wang H, Chen Y, Zhu Y, Silberstein JL, Taylor MN, Maughan BL, Denmeade SR, Pienta KJ, Paller CJ, Carducci MA, Eisenberger MA, Luo J (2017) Clinical significance of androgen receptor splice variant‐7 mRNA detection in circulating tumor cells of men with metastatic castration‐resistant prostate cancer treated with first‐and second‐line abiraterone and enzalutamide. J Clin Oncol 35: 2149–2156 - PMC - PubMed
-
- Arredouani MS, Lu B, Bhasin M, Eljanne M, Yue W, Mosquera JM, Bubley GJ, Li V, Rubin MA, Libermann TA, Sanda MG (2009) Identification of the transcription factor single‐minded homologue 2 as a potential biomarker and immunotherapy target in prostate cancer. Clin Cancer Res 15: 5794–5802 - PMC - PubMed
-
- Arredouani MS, Lu B, Sanda MG (2014) Gene Expression Omnibus GSE55945 (https://www.ncbi.nlm.nih.gov/geo/query/acc.cgi?acc=GSE55945).
Publication types
MeSH terms
Substances
Grants and funding
LinkOut - more resources
Full Text Sources
Other Literature Sources
Medical
Molecular Biology Databases
Research Materials
