. 2018 Sep 3;215(9):2355-2377.
doi: 10.1084/jem.20172158. Epub 2018 Aug 14.

TFEB enhances astroglial uptake of extracellular tau species and reduces tau spreading

Affiliations

TFEB enhances astroglial uptake of extracellular tau species and reduces tau spreading

Heidi Martini-Stoica et al. J Exp Med. .

Abstract

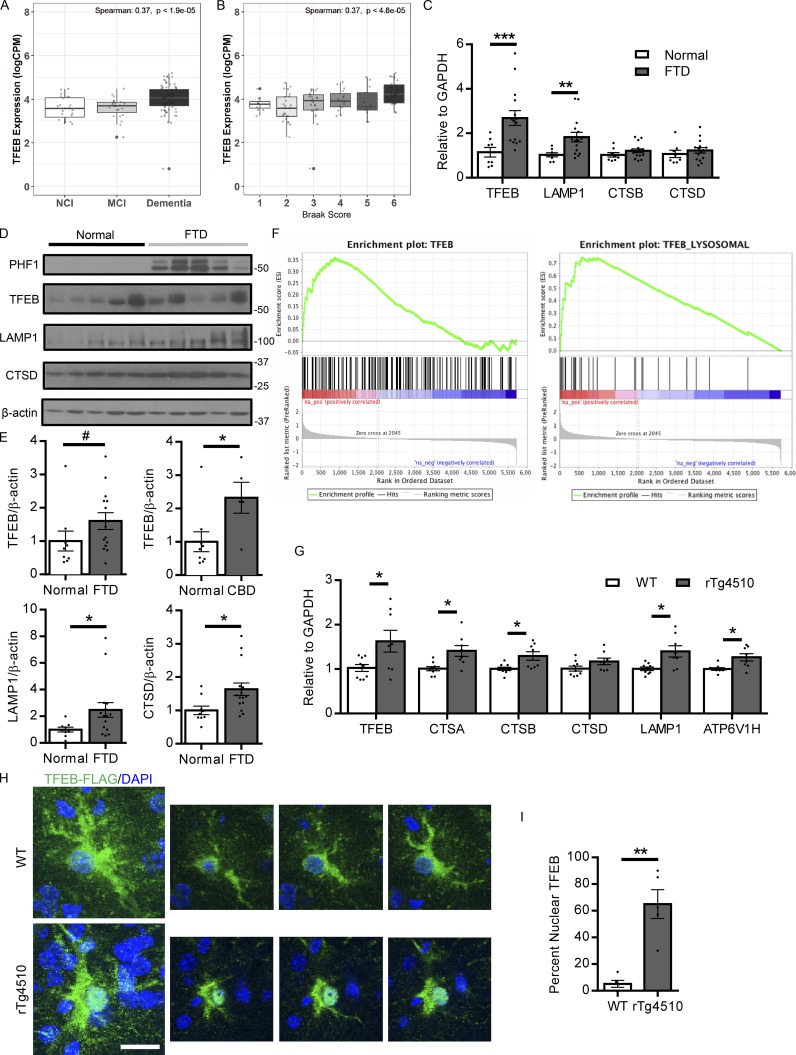
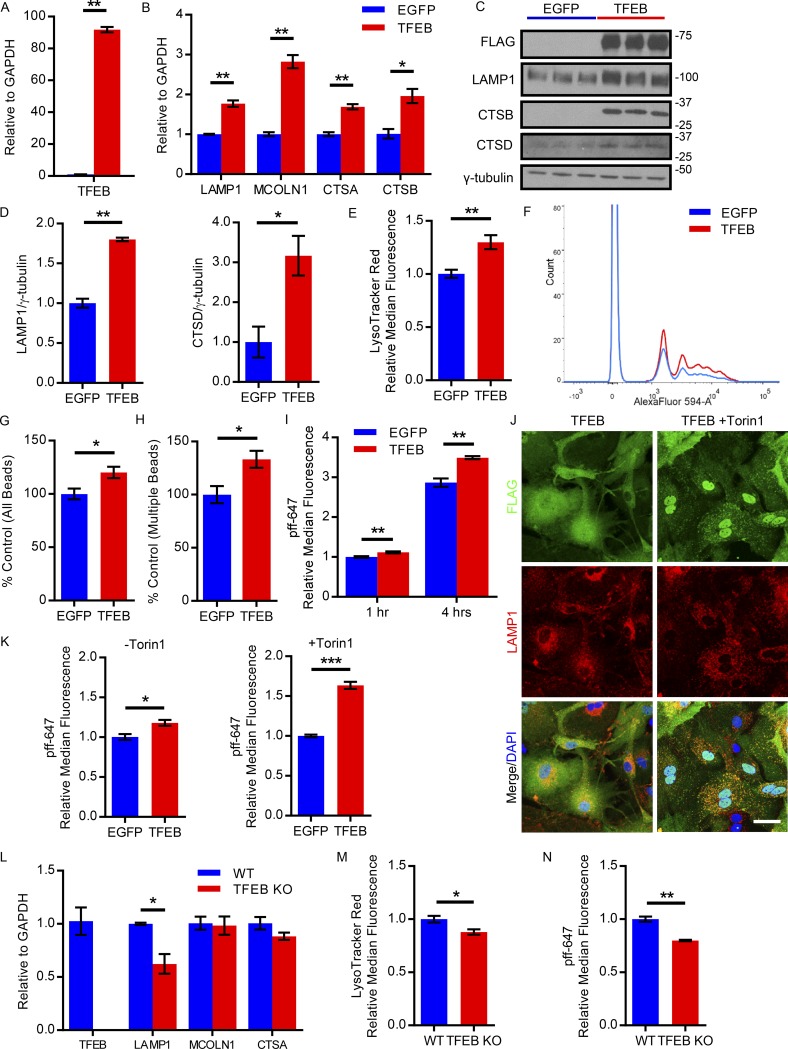
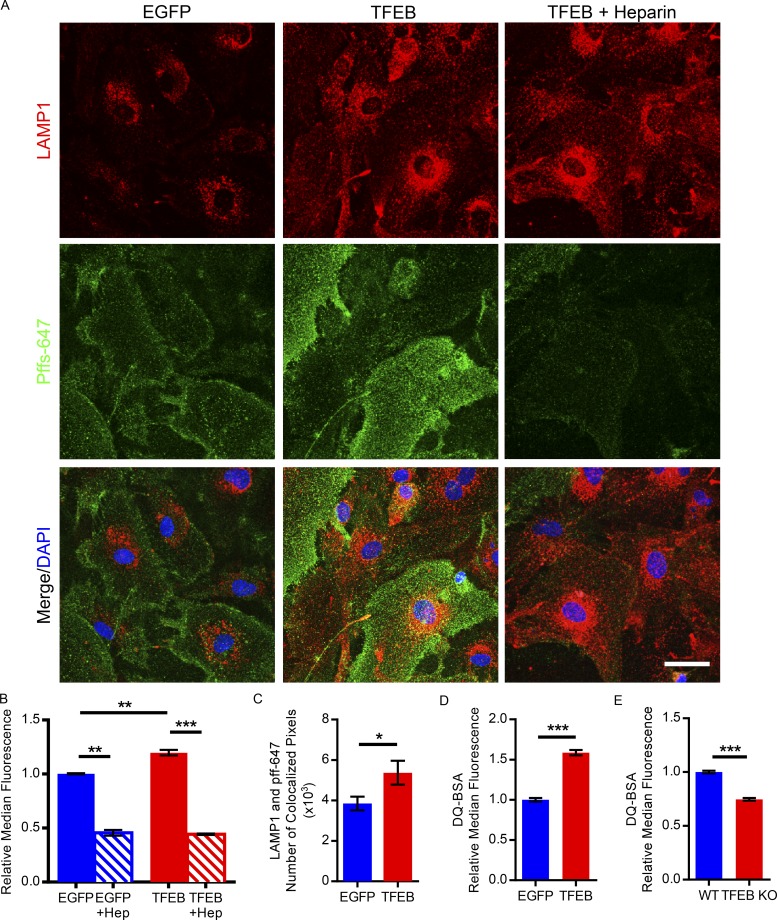
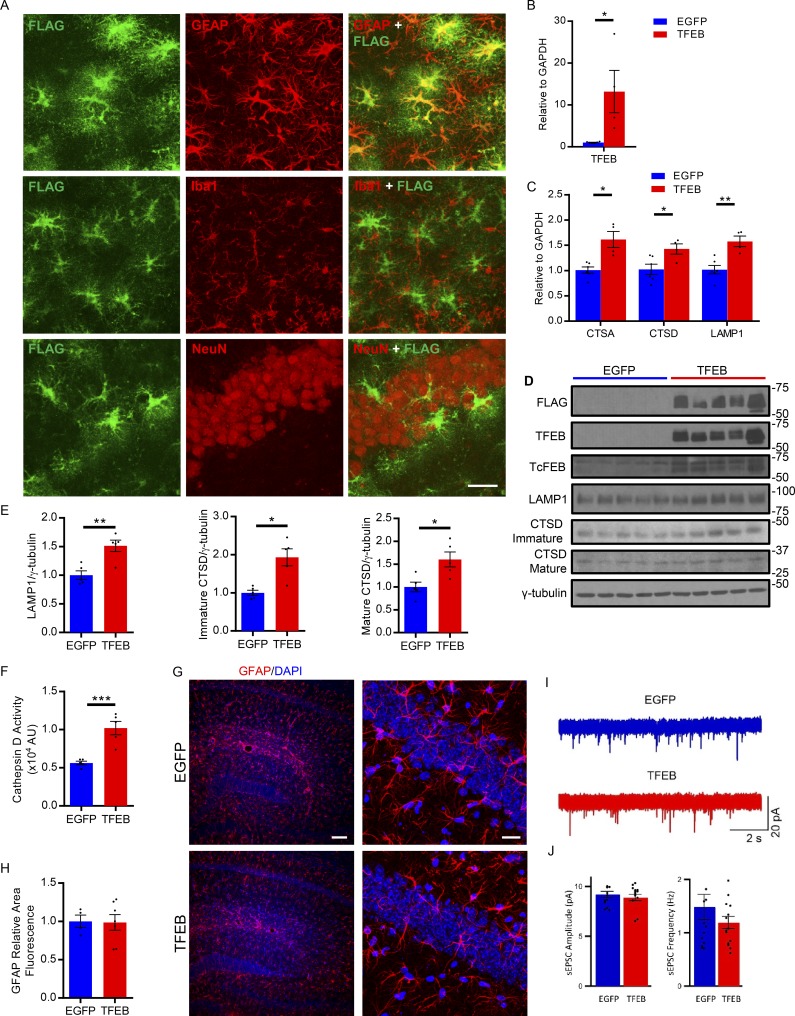
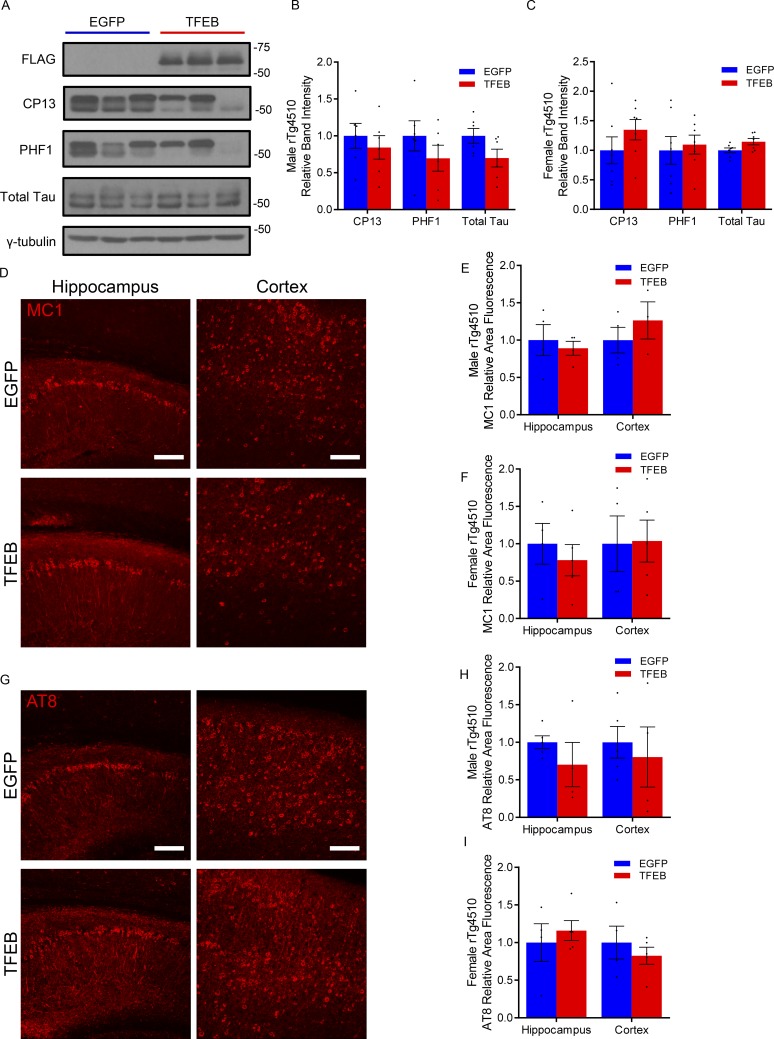
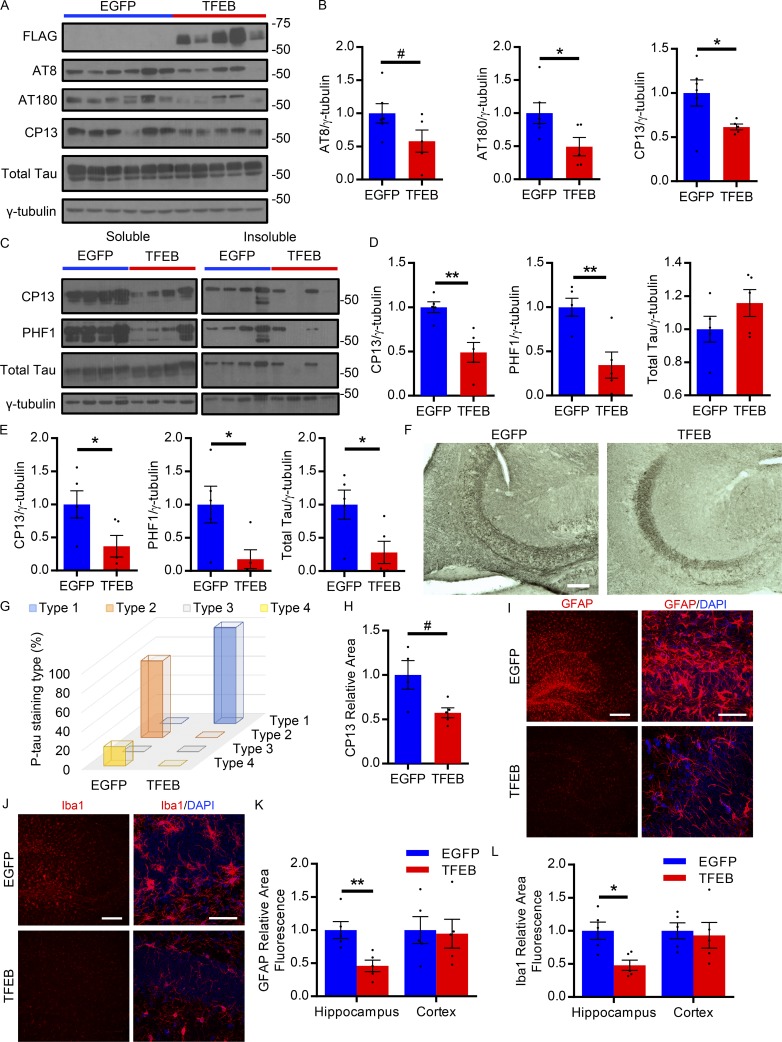
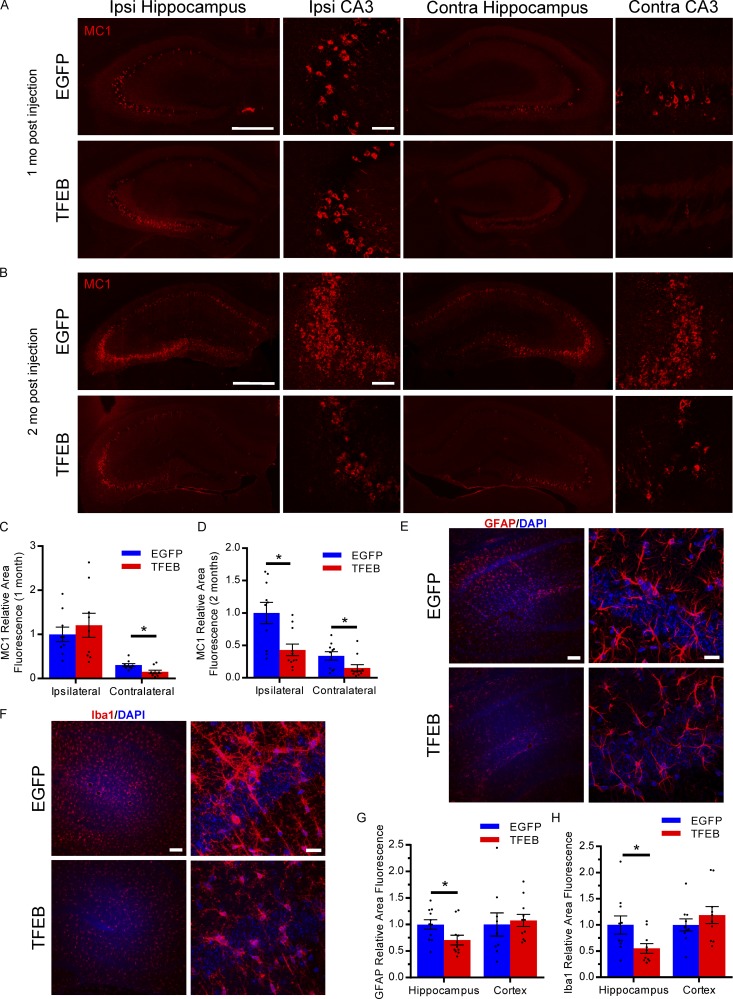
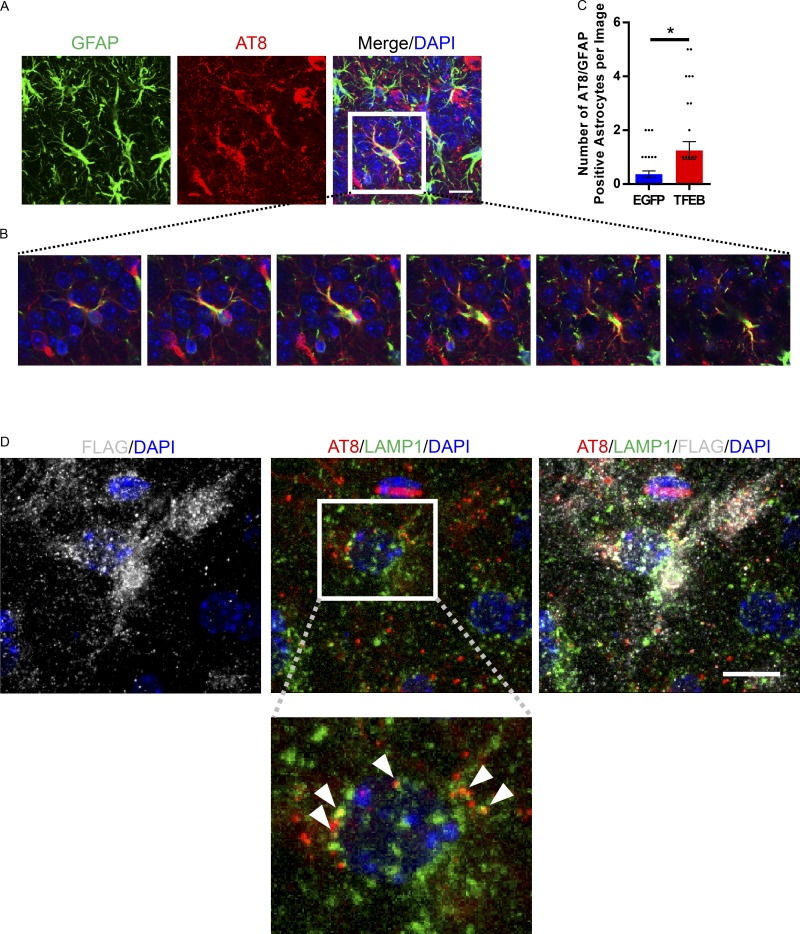
The progression of tau pathology in Alzheimer's disease follows a stereotyped pattern, and recent evidence suggests a role of synaptic connections in this process. Astrocytes are well positioned at the neuronal synapse to capture and degrade extracellular tau as it transits the synapse and hence could potentially have the ability to inhibit tau spreading and delay disease progression. Our study shows increased expression and activity of Transcription Factor EB (TFEB), a master regulator of lysosomal biogenesis, in response to tau pathology in both human brains with dementia and transgenic mouse models. Exogenous TFEB expression in primary astrocytes enhances tau fibril uptake and lysosomal activity, while TFEB knockout has the reverse effect. In vivo, induced TFEB expression in astrocytes reduces pathology in the hippocampus of PS19 tauopathy mice, as well as prominently attenuates tau spreading from the ipsilateral to the contralateral hippocampus in a mouse model of tau spreading. Our study suggests that astrocytic TFEB plays a functional role in modulating extracellular tau and the propagation of neuronal tau pathology in tauopathies such as Alzheimer's disease.


Figures

Figure 1.
Figure 1.
TFEB activity is enhanced in response to AD/tauopathy disease progression. (A) Human brain TFEB transcript levels stratified by clinical assessment of cognition from the MSSM cohorts in the AMP-AD reprocessed RNA-seq project (parahippocampal gyrus; n = 130). The three dementia groups are defined based on CERAD score (CDR): CDR = 0 is NCI, CDR = 0.5 is MCI, CDR ≥1 is Dementia. Performed once. (B) Human brain TFEB transcript levels stratified by Braak score (1–6) from the MSSM cohorts in AMP-AD reprocessed RNA-seq project (parahippocampal gyrus; n = 130). Spearman’s correlation coefficient is computed between the expression and dementia group status (A) or Braak score (B) and P value show the significance of the observed correlation computed using the asymptotic t approximation algorithm. Performed once. (C) qRT-PCR analysis of the transcriptional levels of TFEB and its lysosomal target genes in the frontal cortex of FTD or normal human subjects. n = 15 FTD, 8 normal cases. Student’s t test, experiments technically replicated twice. (D and E) Representative Western blot with quantitation (E) of TFEB and its lysosomal targets LAMP1 and CTSD, as well as phospho tau levels indicated by phospho tau antibody PHF1 in normal versus FTD human subjects. n = 15 FTD, 9 normal cases. #P = 0.14. Student’s t test; experiment technically replicated twice. (F) GSEA of transcriptomic changes in the brains of 4-mo-old wild-type versus rTg4510 mice. The left panel shows enrichment of TFEB transcriptional targets (ES: 0.36, P value: 0.0096), while the right panel demonstrates enrichment of TFEB lysosomal transcriptional targets (ES: 0.72; P value: <0.001). n = 4/group. Performed once. (G) qRT-PCR of TFEB regulated lysosomal genes in astrocytes from 4.5-mo-old wild-type versus rTg4510 mice. n = 8/group. Student’s t test; pooled from three independent experiments. CTSA, Cathepsin A; CTSB, Cathepsin B. (H and I) Representative confocal images of FLAG (green) and DAPI (blue) staining in the forebrain of P3 AAV-GFAP-TFEB injected wild-type or rTg4510 mice at 4 mo of age with quantification (I). Bar, 10 µm. n = 5/group with 5 images/animal; Student’s t test, representative of two independently performed experiments. Molecular mass indicated in kilodaltons. Error bars designate SEM. *, P < 0.05; **, P < 0.01; ***, P < 0.001.
Figure 2.
Figure 2.
TFEB enhances lysosomal biogenesis and uptake of tau fibrils in primary astrocytes. (A and B) qRT-PCR analysis of the transcriptional levels of TFEB and its lysosomal target genes (B) in primary astrocytes transduced with AAV-GFAP-EGFP or AAV-GFAP-TFEB, the latter expressed as a 3×FLAG fusion protein. n = 3/group; Student’s t test, representative of three independently performed experiments. (C and D) Western blot with quantitation (D) of TFEB lysosomal targets in primary astrocytes transduced with AAV-GFAP-EGFP or AAV-GFAP-TFEB. TFEB expression was detected by an anti-FLAG antibody. n = 3/group; Student’s t test, representative of three independently performed experiments. (E) Flow cytometry analysis of LysoTracker red staining in primary astrocytes transduced with AAV-GFAP-EGFP or AAV-GFAP-TFEB. n = 4/group; Student’s t test, representative of three independently performed experiments. (F) Representative tracing flow cytometry analysis of red fluorescent latex bead uptake in primary astrocytes transduced with AAV-GFAP-EGFP or AAV-GFAP-TFEB following 1-h incubation. n = 4/group; representative of three independently performed experiments. (G and H) Flow cytometry analysis of red fluorescent bead uptake in primary astrocytes transduced with AAV-GFAP-EGFP or AAV-GFAP-TFEB showing total number of cells taking up beads and total number of cells taking up multiple beads (H). n = 4/group; Student’s t test, representative of three independently performed experiments. (I) Flow cytometry analysis of AlexaFluor-647–conjugated tau fibril uptake in primary astrocytes transduced with AAV-GFAP-EGFP or AAV-GFAP-TFEB following 1 or 4 h of fibril incubation. n = 4/group; Student’s t test, representative of three independently performed experiments. (J) Representative confocal images of TFEB (FLAG, green), DAPI (blue), and LAMP1 (red) costaining in basal conditions (TFEB) versus 1-h treatment with 250 nM Torin1 (TFEB + Torin1). Bar, 20 µm. n = 4/group, representative of two independently performed experiments. (K) Flow cytometry analysis of dye-conjugated tau fibril uptake in primary astrocytes transduced with AAV-GFAP-EGFP or AAV-GFAP-TFEB following 1-h incubation with fibrils in basal conditions (−Torin1) or 3 h of 250 nM Torin1 treatment (+Torin1). n = 4/group; Student’s t test, representative of two independently performed experiments. (L) qRT-PCR analysis of the transcriptional levels of TFEB and its lysosomal target genes in primary astrocytes from nestin-cre tcfeb knockout (TFEB KO) or wild-type pups. (n = 4/group; Student’s t test, representative of two independently performed experiments). (M) Flow cytometry analysis of LysoTracker red staining in primary astrocytes from TFEB KO or wild-type pups. n = 4/group; Student’s t test, representative of two independently performed experiments. (N) Flow cytometry analysis of AlexaFluor-647–conjugated tau fibril uptake in primary astrocytes from TFEB KO or wild-type pups following 3 h of fibril incubation. (n = 4/group; Student’s t test, representative of two independently performed experiments). Molecular mass indicated in kilodaltons. Error bars designate SEM. *, P < 0.05; **, P < 0.01; ***, P < 0.001.
Figure 3.
Figure 3.
TFEB enhances uptake of tau fibrils via macropinocytosis and trafficking to the lysosome in primary astrocytes. (A) Representative confocal images of AlexaFluor-647–conjugated tau fibrils (green) and LAMP1 costaining (red) in primary astrocytes transduced with AAV-GFAP-EGFP or AAV-GFAP-TFEB. Also depicted are primary astrocytes transduced with AAV-GFAP-TFEB treated with 100 µg/ml; 18 U/ml heparin. Bar, 20 µm. (n = 3/group; representative of two independently performed experiments). (B) Flow cytometry analysis of dye-conjugated tau fibril uptake in primary astrocytes transduced with AAV-GFAP-EGFP or AAV-GFAP-TFEB following 1-h incubation with or without heparin (100 µg/ml; 18 U/ml) treatment in each group. n = 4/group; Student’s t test, representative of two independently performed experiments. (C) Analysis of colocalization based on number of colocalized pixels of LAMP1 and AlexaFluor-647–conjugated tau fibrils in primary astrocytes transduced with AAV-GFAP-EGFP or AAV-GFAP-TFEB. n = 12 confocal images/group; Student’s t test, representative of two independently performed experiments. (D) Flow cytometry analysis of DQ-BSA uptake and cleavage in the lysosomal acidic compartment of primary astrocytes transduced with AAV-GFAP-EGFP or AAV-GFAP-TFEB following three hours of incubation with DQ-BSA. n = 4/group; Student’s t test, representative of two independently performed experiments. (E) Flow cytometry analysis of DQ-BSA uptake and cleavage in the lysosomal acidic compartment of primary astrocytes from TFEB KO or wild-type pups following 3 h of incubation with DQ-BSA. n = 4/group; Student’s t test, representative of two independently performed experiments. Error bars designate SEM. *, P < 0.05; **, P < 0.01; ***, P < 0.001.
Figure 4.
Figure 4.
AAV-GFAP-TFEB specifically targets astrocytes and enhances lysosomal gene expression in vivo. (A) Representative confocal images demonstrating expression of TFEB with GFAP, Iba-1, and NeuN (red; bottom) in the hippocampus of wild-type mice injected ICV at P3 with AAV-GFAP-TFEB viral particles. Bar, 20 µm. n = 3, representative of two independently performed experiments. (B and C) qRT-PCR analysis of TFEB and its lysosomal target genes (C) from P3-injected AAV-GFAP-EGFP or AAV-GFAP-TFEB wild-type hippocampus samples at 3 mo of age. n = 6/group; Student’s t test, representative of two independently performed experiments. (D and E) Western blot with quantitation (E) of TFEB lysosomal targets LAMP1 and CTSD from the hippocampus of P3-injected AAV-GFAP-EGFP or AAV-GFAP-TFEB wild-type mice at 3 mo of age. n = 5/group; Student’s t test, representative of two independently performed experiments. (F) CTSD enzyme activity assay from hippocampal homogenate of P3-injected AAV-GFAP-EGFP or AAV-GFAP-TFEB wild-type mice at 3 mo of age. n = 5/group; Student’s t test, representative of two independently performed experiments. (G) Representative fluorescent confocal images of GFAP immunostaining (red) of the hippocampus in 7–9-mo-old wild-type mice P3-injected with AAV-GFAP-EGFP or AAV-GFAP-TFEB at low (left) and high (right) magnification. Bars, 100 µm and 20 µm, respectively. n = 5–7; representative of two independently performed experiments. (H) Area fluorescence quantitation of GFAP immunostaining in the hippocampus of 7–9-mo-old wild-type mice. n = 5 EGFP/7 TFEB; Student’s t test, representative of two independently performed experiments. (I) sEPSC sample traces from one granule neuron in P3-injected AAV-GFAP-EGFP or AAV-GFAP-TFEB wild-type mice at 9 mo of age. (J) Mean sEPSC amplitude and frequency showed no difference between P3-injected AAV-GFAP-EGFP (n = 14 neurons/3 mice) or AAV-GFAP-TFEB (n = 16 neurons/3 mice) wild-type mice at 9 mo of age (Student’s t test; representative of two independently performed experiments). Molecular mass indicated in kilodaltons. Error bars designate SEM. *, P < 0.05; **, P < 0.01; ***, P < 0.001.
Figure 5.
Figure 5.
Astroglial TFEB does not impact tau pathology in rTg4510 mice. (A and B) Representative Western blot with quantitation (B) of total and phosphorylated tau species using antibodies CP13 and PHF1 from the hippocampus of male 4-mo-old rTg4510 mice injected ICV with AAV-GFAP-EGFP or AAV-GFAP-TFEB at P3. n = 6, 7/group; Student’s t test, representative of two independently performed experiments. (C) Quantitation of Western blot for female mice. n = 6/group; Student’s t test, representative of two independently performed experiments. (D–G) Representative confocal images of MC1 and AT8 (E) immunostaining with quantitation (F and G) from the cortex and hippocampus of AAV-GFAP-EGFP– or AAV-GFAP-TFEB–injected rTg4510 mice. Bar, 75 µm. n = 4/group; Student’s t test, representative of two independently performed experiments. (H and I) Quantitation of MC1 and AT8 (I) immunostaining for female mice. n = 4/group; Student’s t test, representative of two independently performed experiments. Molecular mass indicated in kilodaltons. Error bars indicate SEM.
Figure 6.
Figure 6.
Astroglial TFEB reduces tau pathology in the hippocampus of PS19 mice. (A and B) Western blot with quantification (B) of total and phosphorylated tau species using antibodies AT8, AT180, and CP13 from the hippocampus of 9-mo-old PS19 mice injected ICV with AAV-GFAP-EGFP or AAV-GFAP-TFEB at P3. n = 6, 5/group. #, P = 0.09; Student’s t test, representative of two independently performed experiments. (C–E) Western blot with quantification of total and phosphorylated tau species using antibodies CP13 and PHF1 in soluble (D) and insoluble (E) fractions from the hippocampus of 9-mo-old AAV-injected PS19 mice. n = 5/group; Student’s t test, experiment technically replicated twice. (F) Representative images of CP13 immunostaining in the CA3 of the hippocampus in 9-mo-old AAV-injected PS19 mice. Bar, 100 µm. n = 5/group; representative of two independently performed experiments. (G) Distribution of the four phospho-tau staining types in 9-mo-old AAV-injected PS19 mice. n = 5/group; representative of two independently performed experiments. (H) Quantification of CP13 immunostaining area in the cortex of 9-mo-old AAV-injected PS19 mice. n = 5/group. #, P = 0.07; Student’s t test, representative of two independently performed experiments. (I and J) Representative fluorescent confocal images of GFAP (I) and Iba1 (J) immunostaining (red) of the dentate gyrus of 9-mo-old AAV-injected PS19 mice at low (left) and high (right) magnification. Bars, 200 µm and 50 µm, respectively. n = 5/group, representative of two independently performed experiments. (K and L) Area fluorescence quantitation of GFAP (K) and Iba1 (L) immunostaining of 9-mo-old AAV-injected PS19 mice. n = 5/group; Student’s t test, representative of two independently performed experiments. Molecular mass indicated in kilodaltons. Error bars designate SEM. *, P < 0.05; **, P < 0.01.
Figure 7.
Figure 7.
Astroglial TFEB reduces tau spreading in PS19 mice. (A and B) Representative fluorescent images of MC1 immunostaining (red) of the ipsilateral and contralateral hippocampus of PS19 mice with P3 ICV injection of AAV-GFAP-EGFP or AAV-GFAP-TFEB at 1 mo (A) and 2 mo (B) after unilateral tau fibril injection. Bars: 500 µm for whole hippocampus; 40 µm for CA3. n = 7–11/group; representative of two independently performed experiments for 1 mo; 2 mo technically replicated twice. (C and D) Area fluorescence quantitation of MC1 immunostaining of the ipsilateral and contralateral hippocampus of PS19 mice 1 mo (C) and 2 mo (D) after tau fibril injection. n = 7–11/group; Student’s t test, representative of two independently performed experiments for 1 mo; 2 mo technically replicated twice. (E and F) Representative fluorescent confocal images of GFAP (E) and Iba1 (F) immunostaining (red) of the hippocampus of PS19 mice 2 mo after tau fibril injection at low (left) and high (right) magnification. Bars, 100 µm and 20 µm, respectively. n = 10/group; technically replicated twice. (G and H) Area fluorescence quantitation of GFAP (G) and Iba1 (H) immunostaining of PS19 mice 2 mo after tau fibril injection. (n = 10/group; Student’s t test, technically replicated twice). Error bars designate SEM. *, P < 0.05.
Figure 8.
Figure 8.
Astroglial TFEB increases phospho tau present in astrocytes in a tau spreading mouse model. (A) Representative confocal image of AT8 (red), GFAP (green), and DAPI (blue) staining from the contralateral CA3 hippocampus of AAV-GFAP-TFEB–injected tau spreading mouse 2 mo after tau fibril injection. Bar, 10 µm. n = 4/group; representative of two independently performed experiments. (B) Z-stack confocal images from merged image shown in A. (C) Quantification of the number of AT8 positive astrocytes in the hippocampus of the tau spreading mouse model injected ICV at P3 with AAV-GFAP-EGFP or AAV-GFAP-TFEB. n = 40 sections/group, 4 mice/group; Student’s t test, representative of two independently performed experiments. (D) Representative confocal images of AT8 (red), LAMP1 (green), FLAG (gray), and DAPI (blue) staining from the hippocampus of AAV-GFAP-TFEB–injected tau spreading mouse 2 mo after tau fibril injection. Arrows indicate colocalization of AT8 and LAMP1 within the FLAG-positive cell. Bar, 10 µm. n = 4/group; representative of two independently performed experiments. Error bars designate SEM. *, P < 0.05.

References

    1. Asai H., Ikezu S., Tsunoda S., Medalla M., Luebke J., Haydar T., Wolozin B., Butovsky O., Kügler S., and Ikezu T.. 2015. Depletion of microglia and inhibition of exosome synthesis halt tau propagation. Nat. Neurosci. 18:1584–1593. 10.1038/nn.4132 - DOI - PMC - PubMed
    1. Ayuso E., Mingozzi F., Montane J., Leon X., Anguela X.M., Haurigot V., Edmonson S.A., Africa L., Zhou S., High K.A., et al. 2010. High AAV vector purity results in serotype- and tissue-independent enhancement of transduction efficiency. Gene Ther. 17:503–510. 10.1038/gt.2009.157 - DOI - PubMed
    1. Barres B.A. 2008. The mystery and magic of glia: a perspective on their roles in health and disease. Neuron. 60:430–440. 10.1016/j.neuron.2008.10.013 - DOI - PubMed
    1. Basak J.M., Verghese P.B., Yoon H., Kim J., and Holtzman D.M.. 2012. Low-density lipoprotein receptor represents an apolipoprotein E-independent pathway of Aβ uptake and degradation by astrocytes. J. Biol. Chem. 287:13959–13971. 10.1074/jbc.M111.288746 - DOI - PMC - PubMed
    1. Braak H., and Braak E.. 1995. Staging of Alzheimer’s disease-related neurofibrillary changes. Neurobiol. Aging. 16:271–278, discussion :278–284. 10.1016/0197-4580(95)00021-6 - DOI - PubMed

Publication types

MeSH terms

Substances