. 2018 Aug 28;115(35):E8246-E8255.
doi: 10.1073/pnas.1802620115. Epub 2018 Aug 14.

Oligodendrocyte precursor survival and differentiation requires chromatin remodeling by Chd7 and Chd8

Affiliations

Oligodendrocyte precursor survival and differentiation requires chromatin remodeling by Chd7 and Chd8

Corentine Marie et al. Proc Natl Acad Sci U S A. .

Abstract

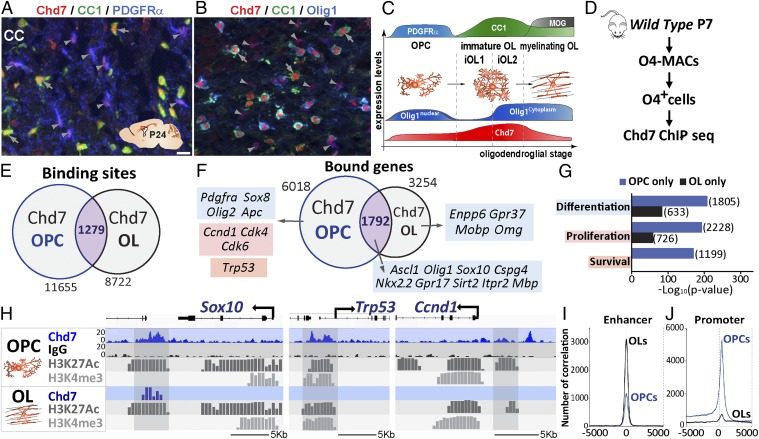
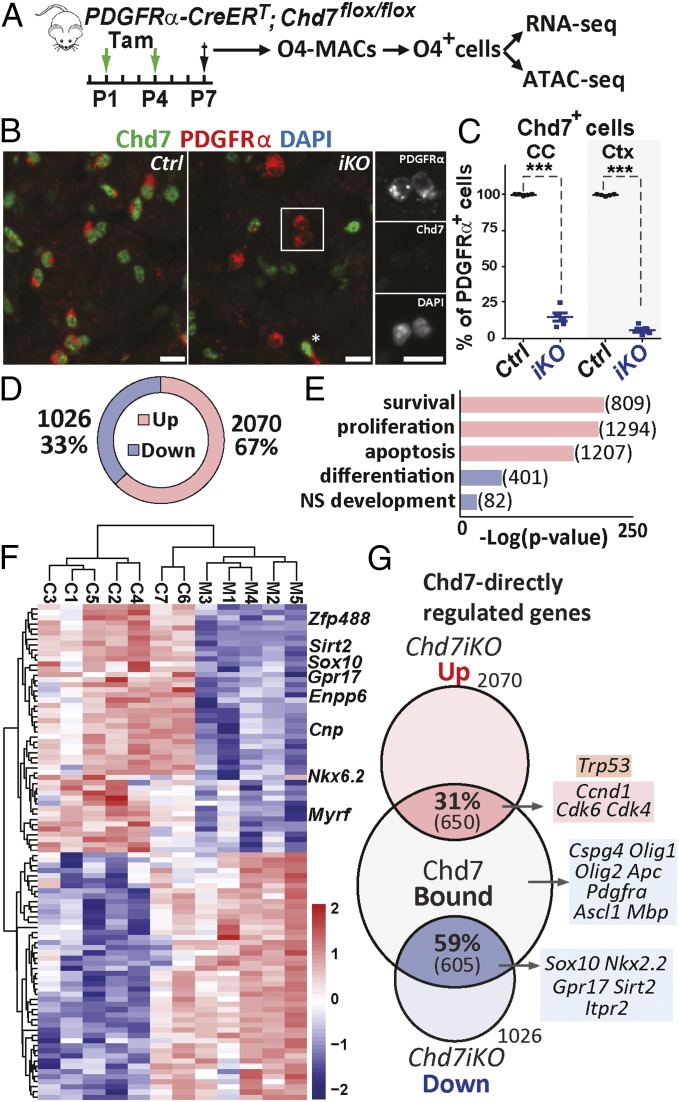
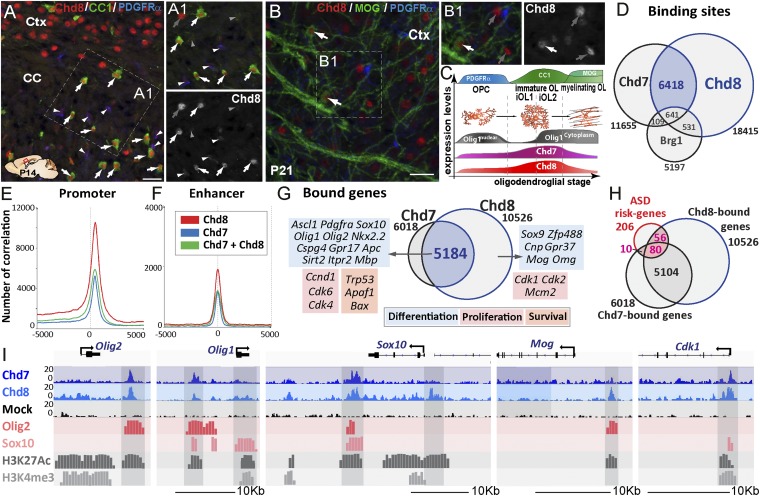
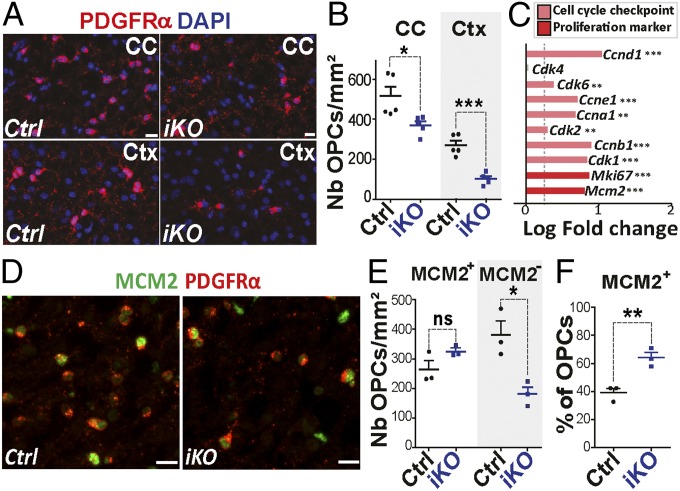
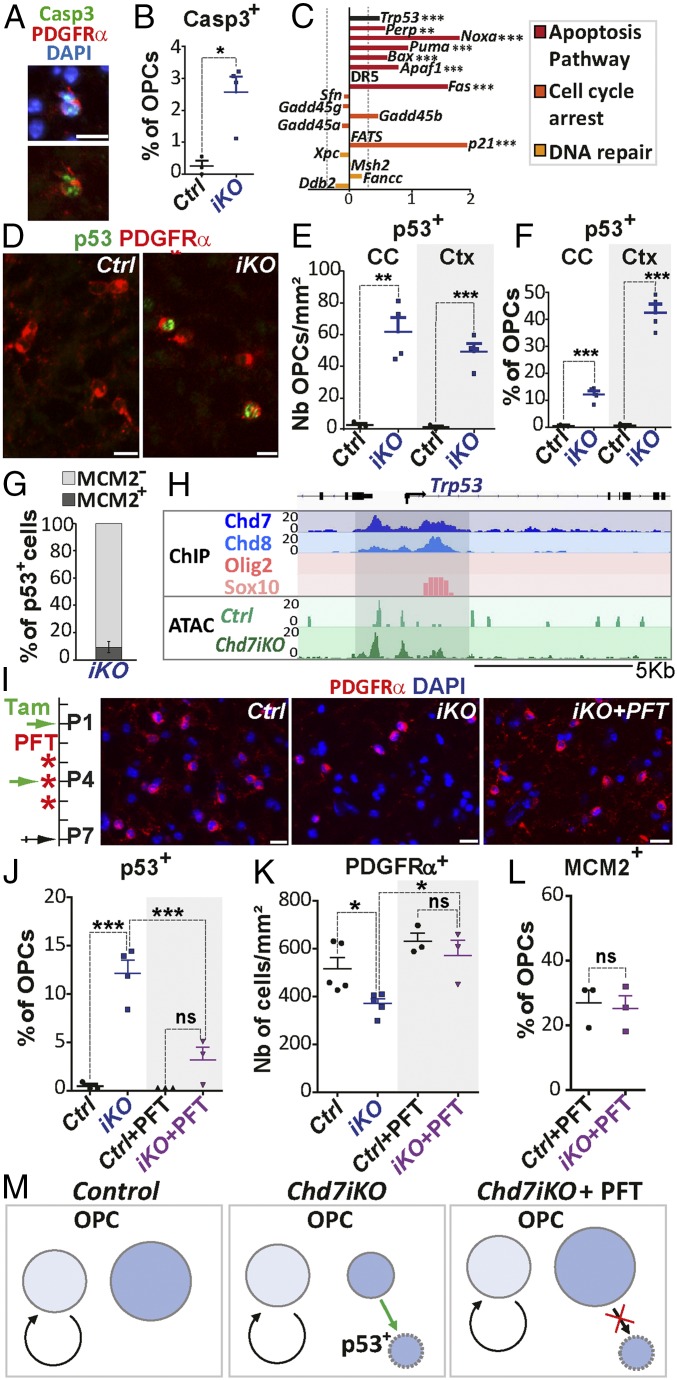
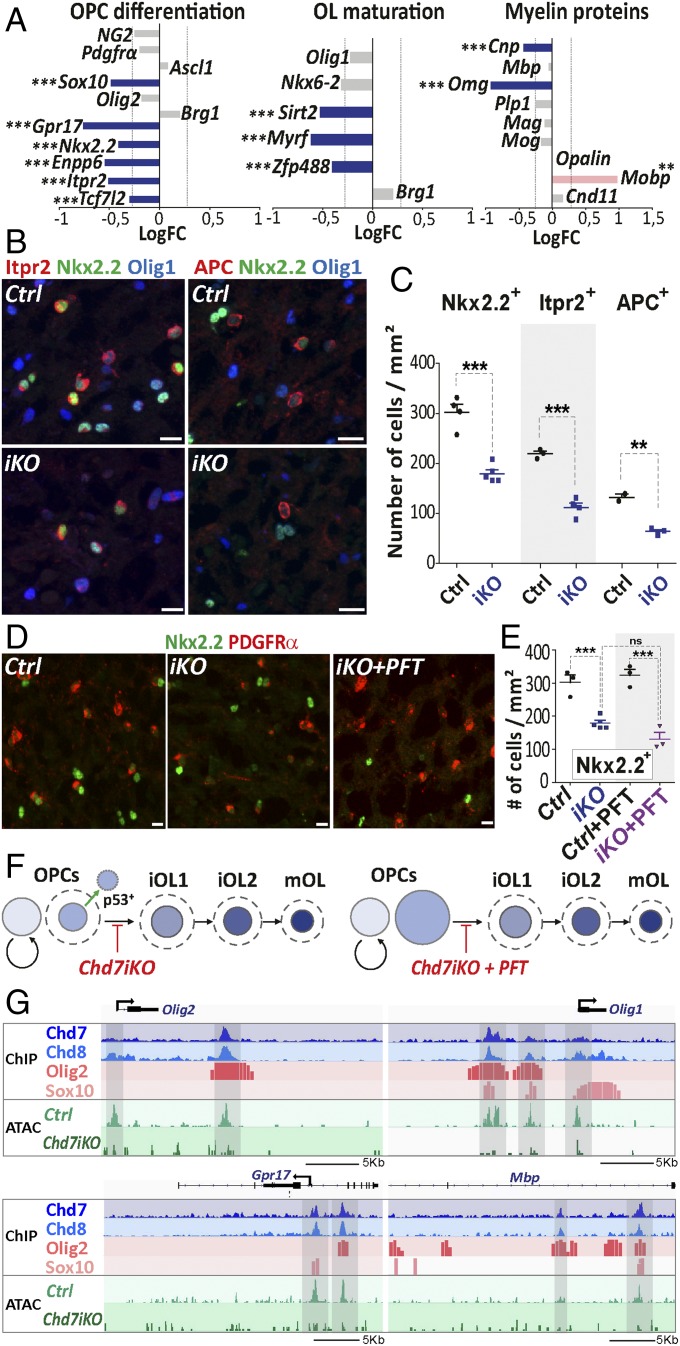
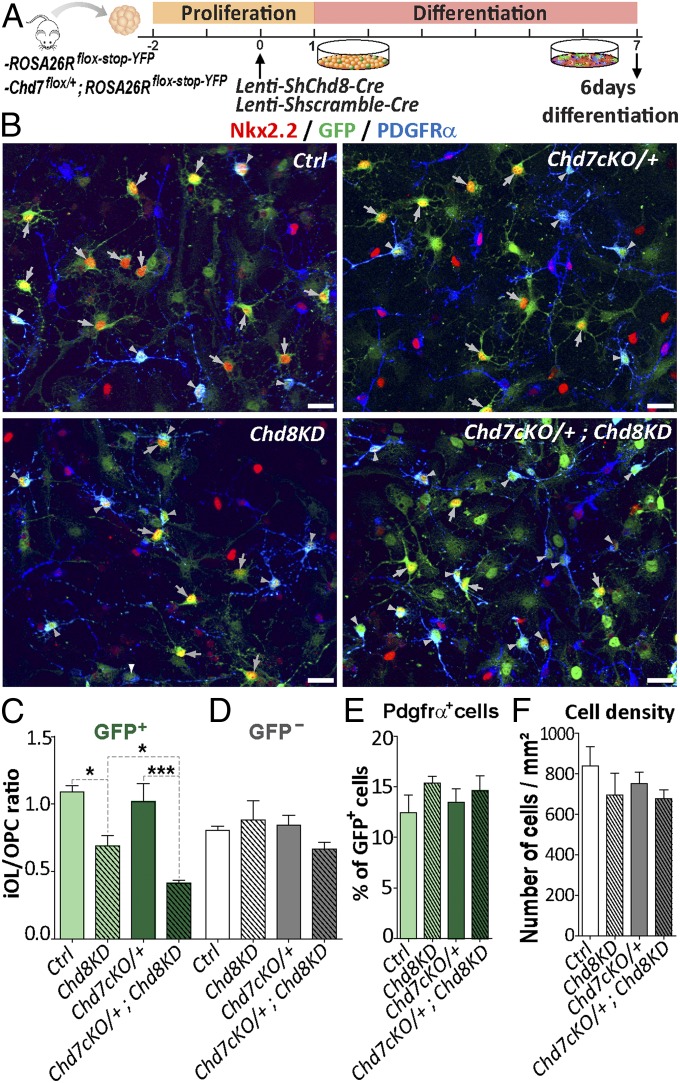
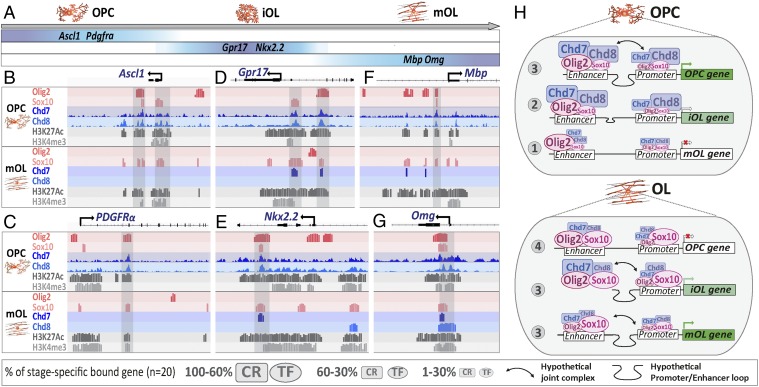
Oligodendrocyte precursor cells (OPCs) constitute the main proliferative cells in the adult brain, and deregulation of OPC proliferation-differentiation balance results in either glioma formation or defective adaptive (re)myelination. OPC differentiation requires significant genetic reprogramming, implicating chromatin remodeling. Mounting evidence indicates that chromatin remodelers play important roles during normal development and their mutations are associated with neurodevelopmental defects, with CHD7 haploinsuficiency being the cause of CHARGE syndrome and CHD8 being one of the strongest autism spectrum disorder (ASD) high-risk-associated genes. Herein, we report on uncharacterized functions of the chromatin remodelers Chd7 and Chd8 in OPCs. Their OPC-chromatin binding profile, combined with transcriptome and chromatin accessibility analyses of Chd7-deleted OPCs, demonstrates that Chd7 protects nonproliferative OPCs from apoptosis by chromatin closing and transcriptional repression of p53 Furthermore, Chd7 controls OPC differentiation through chromatin opening and transcriptional activation of key regulators, including Sox10, Nkx2.2, and Gpr17 However, Chd7 is dispensable for oligodendrocyte stage progression, consistent with Chd8 compensatory function, as suggested by their common chromatin-binding profiles and genetic interaction. Finally, CHD7 and CHD8 bind in OPCs to a majority of ASD risk-associated genes, suggesting an implication of oligodendrocyte lineage cells in ASD neurological defects. Our results thus offer new avenues to understand and modulate the CHD7 and CHD8 functions in normal development and disease.

Keywords: CHARGE; autism spectrum disorder; chromatin remodeling; oligodendrocyte; transcription regulation.


Conflict of interest statement

The authors declare no conflict of interest.

Figures

Fig. 1.
Fig. 1.
Chd7 bind to genes involved in OPCs proliferation, differentiation, and survival. (A and B) Immunostaining of Chd7 with PDGFRα and CC1 (A) or Olig1 and CC1 (B) in the CC of P24 mice. Gray arrowheads show OPCs and gray arrows show OLs. (Scale bar, 10 μm.) (C) Scheme representing expression levels of different markers depending on OL stage. (D) Diagram representing MACSorting of O4+ cells of P7 wild-type mice followed by Chd7 ChIP-seq. (E and F) Venn diagrams depicting the overlap of Chd7-binding sites (E) and bound genes (F) in OPCs and OLs, with examples of genes involved in OPC differentiation (blue), cell death (orange), and cell cycle (red). (G) Barplot representing the GO analysis of the OPC- or OL-only Chd7-bound genes. (H) Representative ChIP-seq tracks for Chd7 and control IgG together with active epigenetic marks (H3K27ac and H3K4me3) of Trp53, Ccnd1, and Sox10 genes in OPCs and OLs. (I and J) Graph showing the number of correlations of Chd7 peaks in OPCs (blue) and OLs (black) compared with the position in enhancer regions (I) and promoter regions (J).
Fig. 2.
Fig. 2.
Chd7-regulated genes involved in OPCs proliferation, differentiation, and survival. (A) Diagram representing tamoxifen (Tam) administration to control (Ctrl) and Chd7iKO (iKO) mice at P1 and P4 followed by MACS-sorting of O4+ cells at P7. Cells are then used for either RNA-seq or ATAC-seq. (B) Immunostaining of P7 brain sections showing that all PDGFRα+ OPCs express Chd7 in the CC of Ctrl mice, while only a few OPCs maintain Chd7 expression in iKO mice. Star shows a Chd7-expressing OPC in iKO. (Scale bars, 10 μm.) (C) Quantification of Chd7+ OPCs as a percentage of total PDGFRα+ cells in the CC and cortex (Ctx) of P7 Ctrl and iKO mice. Data are presented as mean ± SEM (n = 5). Exact P values can be found in Dataset S2. ***P < 0.001. (D) Pie chart showing the relative percentage and number of genes that were significantly up-regulated or down-regulated in P7 iKO O4+ cells compared with Ctrl (fold-change > 1.2; P < 0.05). (E) GO analysis of the up-regulated (red) and down-regulated (blue) genes in Chd7iKO cells compared with Ctrl. Numbers indicate the number of genes of each category. (F) Heatmap representing the expression of 100 most different genes in Ctrl and iKO O4+ cells (n = 7 Ctrl and 5 iKO). (G) Venn diagram depicting the overlap of Chd7-binding genes in OPCs with down-regulated (blue) or up-regulated (red) genes in iKO cells with examples of Chd7-bound genes involved in OL differentiation (blue), cell death (orange), and cell cycle (red).
Fig. 3.
Fig. 3.
Chd8 binds together with Chd7 to OPC differentiation, proliferation, and survival genes. (A) Chd8 immunolabeling of P14 brain sections showing Chd8 expression in all maturing OLs (CC1high-expressing cells, arrows) of the CC, as well as in neurons of the cortex (Ctx). (A1) Detail of the Inset in A showing that, beside the high Chd8 expression in maturing OLs (white arrows) and neurons (gray arrows), a low level of Chd8 expression is detected in few OPCs (PDGFRα+ cells, white arrowheads) but is hardly detectable in astrocytes (CC1low-expressing cells, gray arrowheads). (Scale bar, 20 μm.) (B) Immunofluorescence at P21 showing young mature MOG+ OLs still expressing Chd8 (white arrows). (B1) Detail of the Inset shown in B; gray arrows correspond to Chd8+ neurons. (Scale bar, 20 μm.) (C) Summary representation of Chd8 and Chd7 expression at different stages of the OL cell lineage, as identified by PDGFRα, CC1, and MOG expression. (D) Venn diagrams depicting the overlap of Chd7-, Chd8-, and Brg1-binding sites in OPCs. (E and F) Graph showing the number of correlations of Chd7 (blue), Chd8 (red), and Chd7-Chd8 (green) peaks in OPCs compared with the position in promoter regions (E) or enhancer regions (F). (G) Overlap of Chd7- and Chd8-bound genes in OPCs with examples of genes involved in OL cell differentiation (blue), cell death (orange), and cell cycle (red). (H) Overlap between ASD-risk genes and Chd7- and Chd8-bound genes in OPCs. (I) Representative ChIP-seq tracks for Chd8 and control IgG together with Olig2, Sox10, Chd7, and active epigenetic marks (H3K27ac and H3K4me3) in Olig2, Olig1, Sox10, Mog, and Cdk1 gene regions in OPCs.
Fig. 4.
Fig. 4.
Chd7 LOF in OPCs does not affect cell proliferation. (A) Immunolabeling of PDGFRα+ cells in the CC and cortex (Ctx) of P7 Control (Ctrl) and Chd7iKO (iKO) mice. (Scale bars, 10 μm.) (B) Quantification of PDGFRα+ cells (nb/mm2) in the CC and Ctx of P7 Ctrl and iKO mice. Data are presented as mean ± SEM (n = 5). (C) Barplot representing the log fold-change (LogFC) of genes involved in cell cycle and proliferation between iKO and Ctrl mice. Dashed gray line represent FC = 1.2 (n = 7). (D) Immunostaining of MCM2 and PDGFRα in the CC from P7 Ctrl and iKO mice. (Scale bars, 10 μm.) (E) Quantification of the density of MCM2+ and MCM2 PDGFRα+-OPCs (nb/mm2) in the CC of P7 Ctrl and iKO mice. Data are presented as mean ± SEM (n = 3). (F) Quantification of MCM2+ cells as a percentage of total PDGFRα+ cells in the CC of P7 Ctrl and iKO mice. Data are presented as mean ± SEM (n = 3). Exact P values can be found in Dataset S2. *P < 0.05, **P < 0.01, and ***P < 0.001.
Fig. 5.
Fig. 5.
Chd7 promotes OPC survival through p53 down-regulation. (A) Immunostaining of Casp3 and PDGFRα in the CC of P7 iKO mice. (Scale bar, 10 μm.) (B) Quantification of Casp3+ OPCs as a percentage of OPCs in P7 Ctrl and iKO mice. Data are presented as mean ± SEM (n = 3 Ctrl and 4 iKO). (C) Barplot representing the LogFC of Trp53 and p53 target-genes involved in apoptosis pathway (red), cell-cycle arrest (orange), or DNA repair (yellow) between iKO and Ctrl mice. Dashed gray line represents FC = 1.2 (n = 7 Ctrl and 5 iKO). (D) Immunostaining of p53 and PDGFRα in the CC from P7 Ctrl and iKO mice. (Scale bars, 10 μm.) (E and F) Quantification of p53+ OPCs (nb/mm2, E) or as a percentage of OPCs (F) in the CC and Ctx of P7 Ctrl and iKO mice. Data are presented as mean ± SEM (n = 3 Ctrl and 4 iKO). (G) Quantification of MCM2+ and MCM2 cells as a percentage of total p53+ cells in the CC of iKO P7 mice. Data are presented as mean ± SEM (n = 3 Ctrl and 4 iKO). (H) Representative tracks for Trp53 locus integrating: (i) ChIP-seq data for Olig2 and Sox10, Chd7, and Chd8 in OPCs and; (ii) ATAC data from Ctrl and iKO P7 OPCs. (I, Left) Diagram representing tamoxifen (Tam) administration at P1 and P4 and PFT injection at P3, P4, and P5 followed by tissue collection at P7. (Right) Immunostaining of PDGFRα in the CC from P7 Ctrl, iKO and iKO+PFT mice. (Scale bars, 10 μm.) (J) Quantification of p53+ cells as a percentage of OPCs in the CC of P7 Ctrl, iKO, Ctrl+PFT, and iKO+PFT mice. Data are presented as mean ± SEM (n = 3 Ctrl, 4 iKO, 3 Ctrl+PFT and 3 iKO+PFT). (K) Quantification of PDGFRα+ cells (nb/mm2) in the CC of P7 Ctrl, iKO, Ctrl+PFT and iKO+PFT mice. Data are presented as mean ± SEM (n= 5 Ctrl, 5 iKO, 3 Ctrl+PFT and 3 iKO+PFT). (L) Quantification of MCM2+ cells as a percentage of OPCs in the CC of P7 Ctrl+PFT and iKO+PFT mice. Data are presented as mean ± SEM (n = 3). (M) Scheme representing Chd7 function in OPC survival. Proliferative OPCs (light blue), noncycling OPCs (blue) in Ctrl, iKO, and iKO+PFT mice. Exact P values can be found in Dataset S2. *P < 0.05, **P < 0.01, and ***P < 0.001.
Fig. 6.
Fig. 6.
Chd7 promotes the expression of genes involved in OPC differentiation and maturation. (A) Barplot of the LogFC of genes involved in OPC differentiation, OL maturation, or coding for myelin proteins between P7Chd7iKO (iKO) and Ctrl. The dashed gray line represents fold-change = 1.2 (n = 7 Ctrl and 5 iKO). (B) Immunostaining of Itpr2 and APC together with Nkx2.2 and Olig1 in the CC from P7 control (Ctrl) and iKO (iKO) mice. (Scale bars, 10 μm.) (C) Quantification of Nkx2.2+, Itpr2+, and APC+ cells (nb/mm2) in the CC of P7 Ctrl and iKO mice. Data are presented as mean ± SEM (n = 4 Ctrl and 5 iKO). (D) Immunostaining of PDGFRα and Nkx2.2 in the CC from P7 Ctrl, iKO, and iKO+PFT mice. (Scale bars, 10 μm.) (E) Quantification of Nkx2.2+ cells (nb/mm2) in the CC of P7 Ctrl, iKO, Ctrl+PFT and iKO+PFT mice. Data are presented as mean ± SEM (n = 3 Ctrl, 5 iKO, 3 Ctrl+PFT and 3 iKO+PFT). (F) Summary representation of OL cell lineage progression in P7 iKO and iKO+PFT, mice. Circle size is proportional to the size of OL lineage cell-type population, as quantified in the CC. Dotted lines: OL population size in Ctrl. (G) Representative tracks for Olig1, Olig2, Gpr17, and Mbp locus integrating: (i) ChIP data for main oligodendroglial TFs (Olig2 and Sox10) and chromatin remodeling factors (Chd7, Chd8) in OPCs and; (ii) ATAC data from Ctrl and iKO P7 OPCs. Exact P values can be found in Dataset S2. *P < 0.05, **P < 0.01, and ***P < 0.001.
Fig. 7.
Fig. 7.
OPC differentiation requires both Chd7 and Chd8 remodelers. (A) Diagram representing transduction protocol used on neural stem cells (NSCs) with a lentivirus-expressing Cre and a scramble shRNA or a shRNA against Chd8 and followed by fixation after 6 d of differentiation. (B) Immunostaining of Nkx2.2 and PDGFRα together with GFP in Ctrl (ROSA26Rstop-floxed-YFP +scramble), Chd8KD (ROSA26Rstop-floxed-YFP +Chd8 shRNA), Chd7cKO/+ (Chd7Flox/+;ROSA26Rstop-floxed-YFP +scramble), or Chd7cKO/+;Chd8KD (Chd7Flox/+;ROSA26Rstop-floxed-YFP +Chd8 shRNA) conditions. White arrowheads represent PDGFRα+-GFP+ OPCs and gray arrowheads represent Nkx2.2+-GFP+ iOLs. (Scale bars, 20 μm.) (C and D) Ratio between Nkx2.2+-GFP+ iOLs and PDGFRα+-GFP+ OPCs (C) and between Nkx2.2+-GFP iOLs and PDGFRα+-GFP OPCs (D) in Ctrl, Chd8KD, Chd7cKO/+, and Chd7cKO/+;Chd8KD conditions. Data are presented as mean ± SEM (n = 4). (E) Quantification of PDGFRα+-GFP+ cells as a percentage of total GFP+ cells in Ctrl, Chd8KD, Chd7cKO/+, and Chd7cKO/+;Chd8KD conditions. Data are presented as mean ± SEM (n = 3). (F) Quantification of cells (nb/mm2) in Ctrl, Chd8KD, Chd7cKO/+, and Chd7cKO/+;Chd8KD conditions. Data are presented as mean ± SEM (n = 3). Exact P values can be found in Dataset S2. *P < 0.05, **P < 0.01, and ***P < 0.001.
Fig. 8.
Fig. 8.
Chd7/Chd8 and Olig2/Sox10 bind to regulatory elements of active stage-specific genes in oligodendroglia. (A) Diagram representing a set of genes with timely controlled expression (data from ref. 35) divided in three groups: OPC genes (Ascl1 and Pdgfrα), iOL genes (Nkx2.2 and Gpr17), and mOL genes (Mbp and Omg). (BG) Schematic representation from Genomatix genome browser of Ascl1 (B), Pdgfrα (C), Gpr17 (D), Nkx2.2 (E), Mbp (F), and Omg (G) locus integrating ChIP-seq data for main oligodendroglial TFs (Olig2 and Sox10), chromatin remodeling factors (Chd7, Chd8), and active epigenetic marks (H3K27ac and H3K4me3) in OPCs and OLs. (H) Synthesis representation of the dynamic cooperation between TFs (Sox10, Olig2) and chromatin remodelers (Chd7, Chd8) for the timely regulation of OPC- and OL-gene expression with genes not yet expressed (1), genes starting to express (2), expressed genes (3), and genes not expressed anymore (4).

Similar articles

Cited by

References

    1. Fünfschilling U, et al. Glycolytic oligodendrocytes maintain myelin and long-term axonal integrity. Nature. 2012;485:517–521. - PMC - PubMed
    1. Lee Y, et al. Oligodendroglia metabolically support axons and contribute to neurodegeneration. Nature. 2012;487:443–448. - PMC - PubMed
    1. Mount CW, Monje M. Wrapped to adapt: Experience-dependent myelination. Neuron. 2017;95:743–756. - PMC - PubMed
    1. Spassky N, et al. Multiple restricted origin of oligodendrocytes. J Neurosci. 1998;18:8331–8343. - PMC - PubMed
    1. Tekki-Kessaris N, et al. Hedgehog-dependent oligodendrocyte lineage specification in the telencephalon. Development. 2001;128:2545–2554. - PubMed

Publication types

MeSH terms