. 2018 Sep 28;293(39):15221-15232.
doi: 10.1074/jbc.RA118.004823. Epub 2018 Aug 14.

Highly efficient cellular uptake of a cell-penetrating peptide (CPP) derived from the capsid protein of porcine circovirus type 2

Affiliations

Highly efficient cellular uptake of a cell-penetrating peptide (CPP) derived from the capsid protein of porcine circovirus type 2

Wanting Yu et al. J Biol Chem. .

Abstract

Porcine circovirus type 2 (PCV2) is one of the smallest, nonenveloped, single-stranded DNA viruses. The PCV2 capsid protein (Cap) is the sole viral structural protein and main antigenic determinant. Previous sequence analysis has revealed that the N terminus of the PCV2 Cap contains a nuclear localization signal (NLS) enriched in positively charged residues. Here, we report that PCV2's NLS can function as a cell-penetrating peptide (CPP). We observed that this NLS can carry macromolecules, e.g. enhanced GFP (EGFP), into cells when they are fused to the NLS, indicating that it can function as a CPP, similar to the classical CPP derived from HIV type 1 transactivator of transcription protein (HIV TAT). We also found that the first 17 residues of the NLS (NLS-A) have a key role in cellular uptake. In addition to entering cells via multiple endocytic processes, NLS-A was also rapidly internalized via direct translocation enabled by increased membrane permeability and was evenly distributed throughout cells when its concentration in cell cultures was ≥10 μm Of note, cellular NLS-A uptake was ∼10 times more efficient than that of HIV TAT. We inferred that the externalized NLS of the PCV2 Cap may accumulate to a high concentration (≥10 μm) at a local membrane area, increasing membrane permeability to facilitate viral entry into the cell to release its genome into a viral DNA reproduction center. We conclude that NLS-A has potential as a versatile vehicle for shuttling foreign molecules into cells, including pharmaceuticals for therapeutic interventions.

Keywords: Circoviridae; capsid protein; cell-penetrating peptide (CPP); cellular uptake; endocytosis; intracellular trafficking; membrane; membrane permeability; nuclear localization signal (NLS); permeability; porcine circovirus virus (PCV); protein delivery; transport vector.


Conflict of interest statement

The authors declare that they have no conflicts of interest with the contents of this article

Figures

Figure 1.
Figure 1.
Comparative sequence alignments of amino acid residues. A, primary structure alignment of the NLSs of PCV Caps. The NLS sequences from 21 PCV isolates collected from GenBankTM were aligned. The right column shows the genotype, subtype, and GenBank accession number of each sequence. Red indicates strictly conserved residues among all genotypes. A hyphen (“-”) stands for a gap in the alignment. B, primary structure alignment of these NLSs of the Caps derived from six species of circovirus (UniProt protein IDs are indicated in the right column). Arginine is labeled in red. C, a comparison of NLS-A and -B with two known CPPs. Arginine is labeled in red. Note that a conserved CRAC motif (VXXXXXYXXR) was found in NLS-B.
Figure 2.
Figure 2.
NLS–EGFP recombinant proteins entered both PK15 cells and Sf9 cells. A, PK15 cells were incubated with 4 μg/ml NLS–EGFP (left) or EGFP (middle) for 1 h and washed three times with PBS before imaging with a dual-channel confocal laser-scanning microscope (Nikon TiE). A third test with Opti-MEM incubation only was used as a treatment control (right). Green indicates EGFP signal in the cells, and cell nuclei (blue) are indicated by Hoechst. B, bar graph summarizing the percentage of the PK15 cells with intracellular fluorescence under the above three incubation treatments (n = 4; error bars represent S.D.; ***, p < 0.001). C, bar graph summarizing fluorescence intensity of the PK15 cells under the above three incubation treatments (n = 4; error bars represent S.D.; ***, p < 0.001). D, Sf9 cells were incubated with NLS–EGFP (left) or EGFP (middle) for 1 h and washed three times with PBS before imaging with a dual-channel confocal laser-scanning microscope (Nikon TiE). Another test with Opti-MEM incubation only was used as a treatment control (right). Green indicates EGFP signal in the cells, and cell nuclei (blue) are indicated by Hoechst. E, bar graph summarizing the percentage of the Sf9 cells with intracellular fluorescence under the above three incubation treatments (n = 4; error bars represent S.D.; ***, p < 0.001). F, bar graph summarizing fluorescence intensity of the Sf9 cells under the above three incubation treatments (n = 4; error bars represent S.D.; ***, p < 0.001). All scale bars represent 10 μm. a.u., arbitrary units.
Figure 3.
Figure 3.
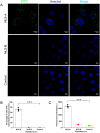
FITC-conjugated NLS-A entered PK15 cells. A, PK15 cells were incubated with 6 μm FITC-conjugated NLS-A (upper row) or 6 μm FITC-conjugated NLS-B (middle row) for 30 min and washed three times with PBS before imaging with a dual-channel confocal laser-scanning microscope (Nikon TiE). A third test with Opti-MEM incubation only was used as a treatment control (bottom row). Green indicates FITC signal in the cells, and cell nuclei (blue) are indicated by Hoechst. B, bar graph summarizing the percentage of the PK15 cells with FITC fluorescence under the above three incubation treatments (n = 4; error bars represent S.D.; ***, p < 0.001). C, bar graph summarizing fluorescence intensity of the PK15 cells under the above three incubation treatments (n = 4; error bars represent S.D.; ***, p < 0.001). All scale bars represent 10 μm. a.u., arbitrary units.
Figure 4.
Figure 4.
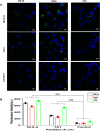
Cellular uptake of FITC-conjugated NLS-A and FITC-conjugated HIV-TAT. A, PK15, HeLa, and NIH3T3 cells were incubated with FITC-conjugated NLS-A (upper row) or FITC-conjugated HIV-TAT (middle row) for 30 min and washed three times with PBS before imaging with a dual-channel confocal laser-scanning microscope (Nikon TiE). A third test with buffer only was used as a treatment control (bottom row). Green indicates FITC signal in the cells, and cell nuclei (blue) are indicated by Hoechst. B, bar graph summarizing the fluorescence intensity of the PK15, HeLa, and NIH3T3 cells under the above three incubation treatments (n = 4; error bars represent S.D.; ***, p < 0.001). All scale bars represent 10 μm. a.u., arbitrary units.
Figure 5.
Figure 5.
Cellular uptake of NLS-A is concentration-dependent. A, PK15 cells were incubated with serial concentrations of FITC-conjugated NLS-A (2, 6, 10, 20, and 40 μm) for 30 min at 37 °C and washed three times with PBS before imaging with a dual-channel confocal laser scanning microscope (Nikon TiE). Green indicates FITC signal in the cells, and cell nuclei (blue) are indicated by Hoechst. B, PK15 cells were incubated with serial concentrations of FITC-conjugated NLS-A (2, 6, 10, 20, and 40 μm) for 30 min at 37 °C. After the cells were trypsinized and washed, the cellular FITC fluorescence intensity of each treatment was analyzed by flow cytometry (BD FACSVerse). Flow cytometry results were processed by FlowJo software. C, bar graph summarizing the fluorescence intensity of the PK15 cells under the incubation treatments with the indicated NLS-A concentration (n = 4; error bars represent S.D.). D, PK15 cells under treatment of a high concentration of NLS-A (40 μm) were further stained by PI for viability test. All scale bars represent 10 μm. a.u., arbitrary units.
Figure 6.
Figure 6.
Rapid entry of the NLS-A into PK15 cells by penetrating the membranes. A, time lapse of NLS-A internalization after PK15 cells were treated with 40 μm peptide. Images were acquired at 5-s intervals. Green represents FITC-conjugated NLS-A in cells. B, bar graph summarizing the mean fluorescence intensity at each time point (n = 100; error bars represent S.D.) C–F, GUVs with encapsulated atto565 dye (red) in the absence of NLS-A (C) or the presence of the FITC-conjugated NLS-A (20 μm) (D). As a control, FITC alone (20 μm) was added into the GUV solution (E). F, ratios of GUVs containing FITC fluorescence (green). Data are represented as the mean ± S.D. (error bars) of 100 individual GUVs from 10 microscopic fields. ***, p < 0.001. Note that confocal images were collected after 1-h incubation of FITC-conjugated NLS-A, FITC alone, or buffer with GUV solutions, respectively. Membranes were visualized by DiI staining. All scale bars represent 10 μm. a.u., arbitrary units.
Figure 7.
Figure 7.
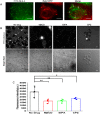
Cellular uptake of NLS-A via multiple endocytosis pathways. A, distributions of NLS-A (left) and Rab7 (middle) in PK15 cells. Colocalizations of NLS-A (6 μm) and Rab7 are indicated by arrows (right). Scale bars, 10 μm. B, effects of various inhibitors on cellular uptake of NLS-A (6 μm). Signals (top panel) indicate internalization of the NLS-A in PK15 cells. In the bottom panel, cells were examined with bright-field microscopy. Scale bars, 10 μm. C, mean fluorescence intensity per cell among four groups was analyzed by flow cytometry (*, p < 0.05; **, p < 0.01; error bars represent S.D.). a.u., arbitrary units; CPZ, chlorpromazine; EIPA, N-(ethyl-N-isopropyl)-amiloride; MβCD, methyl-β-cyclodextrin.
Figure 8.
Figure 8.
Cellular uptake of NLS-A is more efficient than HIV TAT at various concentrations. PK15 cells were incubated with increasing concentrations of NLS-A or HIV TAT (x axis) at 37 °C for 30 min and subjected to flow cytometry analysis. The y axis represents the average fluorescence intensity per group. Data are represented as the mean ± S.D. (error bars) of four independent experiments (**, p < 0.01; ***, p < 0.001). a.u., arbitrary units.

Similar articles

Cited by

References

    1. Tischer I., Gelderblom H., Vettermann W., and Koch M. A. (1982) A very small porcine virus with circular single-stranded DNA. Nature 295, 64–66 10.1038/295064a0 - DOI - PubMed
    1. Segalés J., Kekarainen T., and Cortey M. (2013) The natural history of porcine circovirus type 2: from an inoffensive virus to a devastating swine disease? Vet. Microbiol. 165, 13–20 10.1016/j.vetmic.2012.12.033 - DOI - PubMed
    1. Tischer I., Rasch R., and Tochtermann G. (1974) Characterization of papovavirus-and picornavirus-like particles in permanent pig kidney cell lines. Zentralbl. Bakteriol. Orig. A 226, 153–167 - PubMed
    1. Palinski R., Piñeyro P., Shang P., Yuan F., Guo R., Fang Y., Byers E., and Hause B. M. (2017) A novel porcine circovirus distantly related to known circoviruses is associated with porcine dermatitis and nephropathy syndrome and reproductive failure. J. Virol. 91, e01879–16 10.1128/JVI.01879-16 - DOI - PMC - PubMed
    1. Phan T. G., Giannitti F., Rossow S., Marthaler D., Knutson T. P., Li L., Deng X., Resende T., Vannucci F., and Delwart E. (2016) Detection of a novel circovirus PCV3 in pigs with cardiac and multi-systemic inflammation. Virol. J. 13, 184 10.1186/s12985-016-0642-z - DOI - PMC - PubMed

Publication types

MeSH terms