. 2018 Aug 14;9(1):3245.
doi: 10.1038/s41467-018-05438-4.

Revealing circadian mechanisms of integration and resilience by visualizing clock proteins working in real time

Affiliations

Revealing circadian mechanisms of integration and resilience by visualizing clock proteins working in real time

Tetsuya Mori et al. Nat Commun. .

Abstract

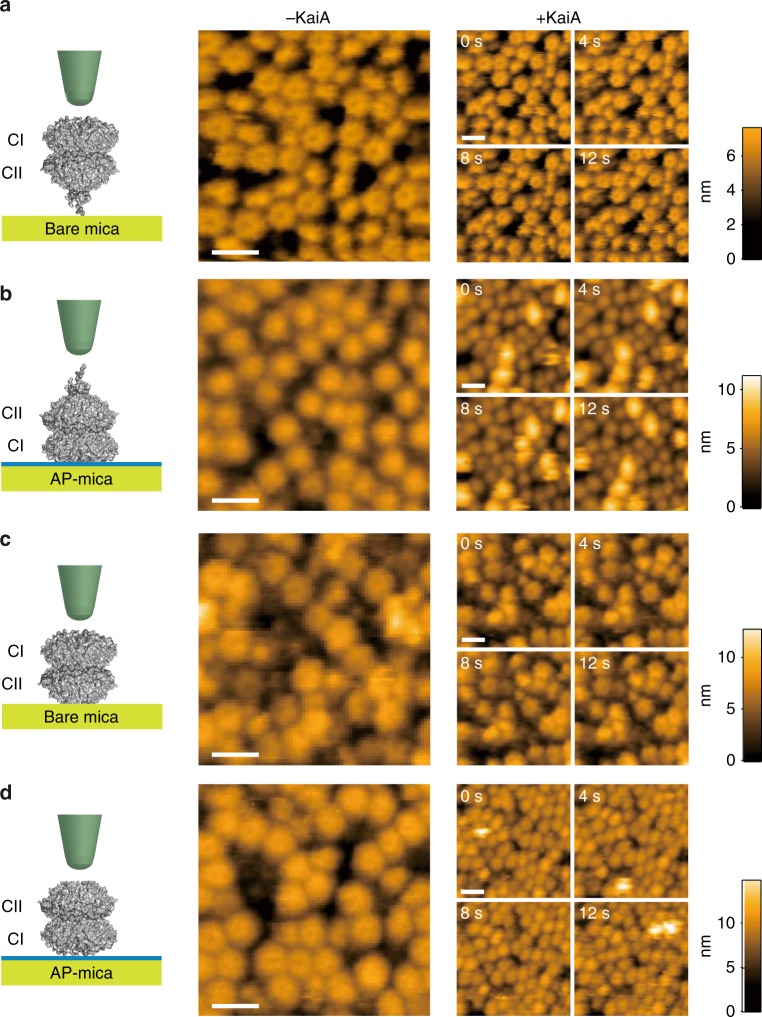
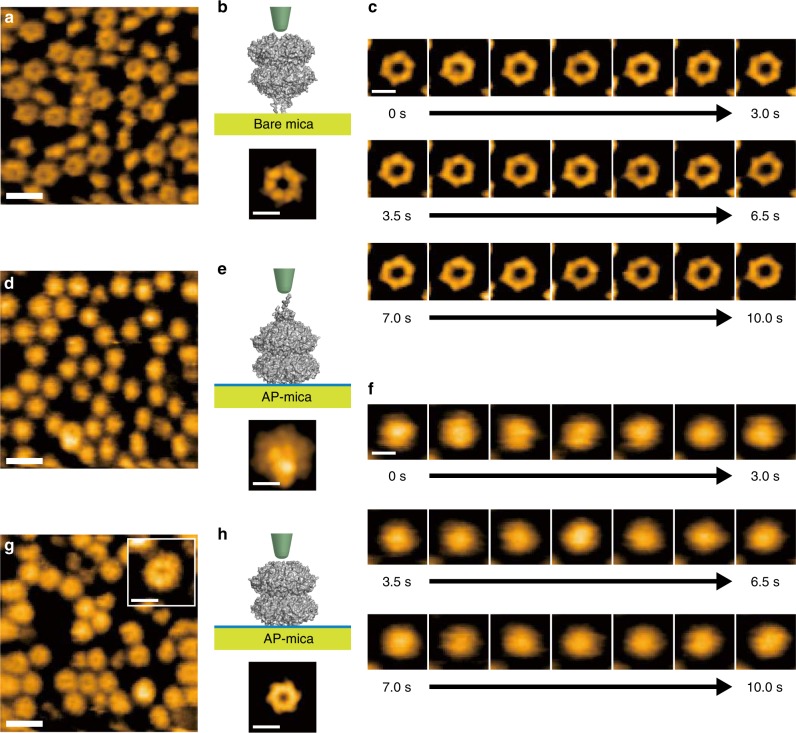
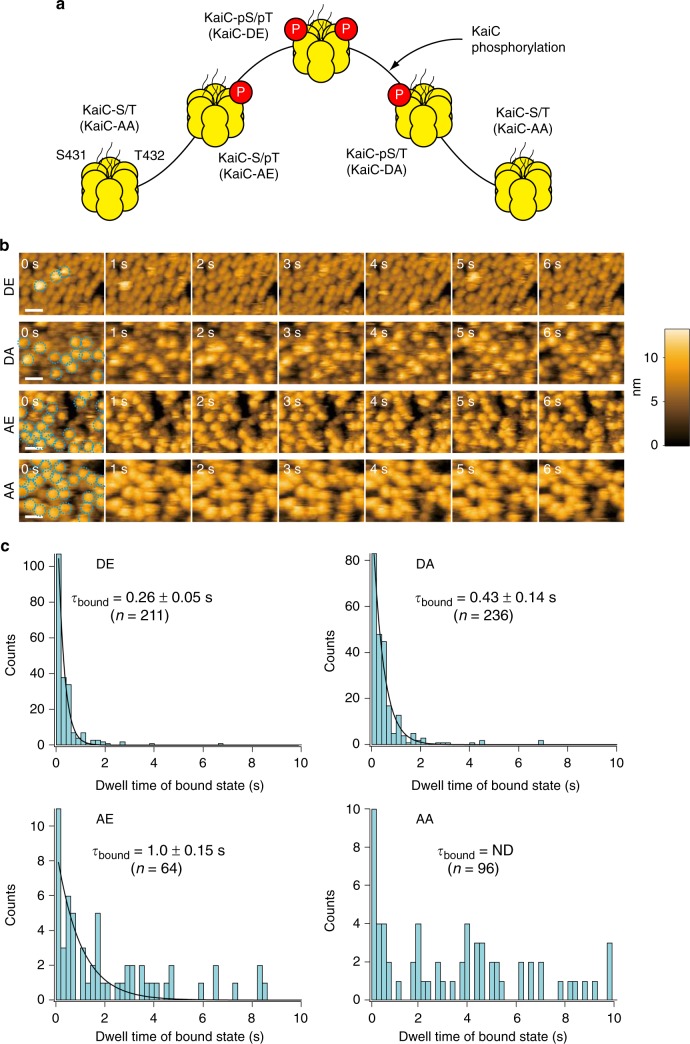
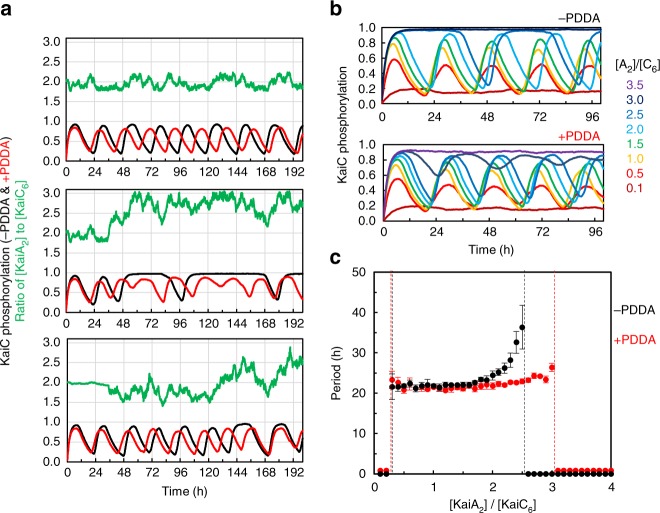
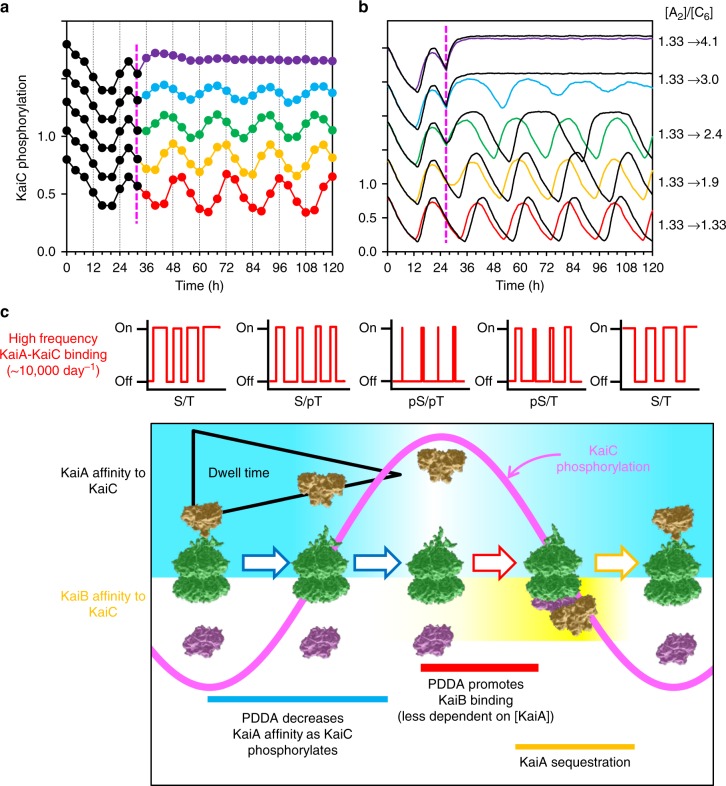
The circadian clock proteins KaiA, KaiB, and KaiC reconstitute a remarkable circa-24 h oscillation of KaiC phosphorylation that persists for many days in vitro. Here we use high-speed atomic force microscopy (HS-AFM) to visualize in real time and quantify the dynamic interactions of KaiA with KaiC on sub-second timescales. KaiA transiently interacts with KaiC, thereby stimulating KaiC autokinase activity. As KaiC becomes progressively more phosphorylated, KaiA's affinity for KaiC weakens, revealing a feedback of KaiC phosphostatus back onto the KaiA-binding events. These non-equilibrium interactions integrate high-frequency binding and unbinding events, thereby refining the period of the longer term oscillations. Moreover, this differential affinity phenomenon broadens the range of Kai protein stoichiometries that allow rhythmicity, explaining how the oscillation is resilient in an in vivo milieu that includes noise. Therefore, robustness of rhythmicity on a 24-h scale is explainable by molecular events occurring on a scale of sub-seconds.


Conflict of interest statement

The authors declare no competing interests.

Figures

Fig. 1
Fig. 1
Orientation-specific immobilization of KaiCWT and interaction with KaiA. a KaiCWT on bare mica without (middle) and with (right) the addition of KaiA. b KaiCWT on AP-mica without (middle) and with (right) the addition of KaiA. c KaiC with deletion of C-terminal tentacles (KaiC-ΔC) on bare mica without (middle) and with (right) the addition of KaiA. d KaiC with deletion of C-terminal tentacles (KaiC-ΔC) on AP-mica without (middle) and with (right) the addition of KaiA. All images shown in the middle and the right columns were acquired at a frame rate of 1 fps and 1.25 fps, respectively. The images on the right columns are shown every 4 s. Scale bar = 15 nm. Also see Supplementary Movies 1–4
Fig. 2
Fig. 2
HS-AFM images of KaiCWT hexamers. a HS-AFM images of native KaiCWT hexamers immobilized on bare mica. Scale bar = 15 nm. b Simulated AFM image of KaiC (bottom) viewed from the N-terminal side. This construction was made using a hypothetical probe with a radius of 0.5 nm and a cone angle of 10°, as illustrated (top). Scale bar = 5 nm. c Time lapse images of KaiCWT hexamers attached to bare mica, which visualizes the N-terminal side of KaiC hexamers in the presence of 2 mM Mg2+-ATP. Images were acquired at a frame rate of 2 fps and images taken every 0.5 s are shown. Scale bar = 5 nm. d HS-AFM image of native KaiCWT hexamers immobilized on AP-mica. Scale bar = 15 nm. e Simulated AFM image of KaiC (bottom) viewed from the C-terminal side. This construction was made using a hypothetical probe with a radius of 0.5 nm and a cone angle of 10°, as illustrated (top). Scale bar = 5 nm. f Time lapse images of KaiC hexamers attached to AP-mica. The images show the C-terminal side of KaiCWT hexamers in the presence of 2 mM Mg2+-ATP. Imaging was carried out at a frame rate of 2 fps and images every 0.5 s are shown. Scale bar = 5 nm. g HS-AFM images of KaiC-ΔC hexamers (in which the C-terminal tentacles are truncated), immobilized on bare mica. Scale bar = 15 nm. The insert is an enlarged image (scale bar within insert = 5 nm). h Simulated AFM image of KaiC-ΔC (bottom) viewed from the C-terminal side without the tentacles. This construction was made using a hypothetical probe with a radius of 0.5 nm and a cone angle of 10°, as illustrated (top). Also see Supplementary Movies 5–12
Fig. 3
Fig. 3
KaiC phospho-status modulates the binding affinity of KaiA for KaiC. a Circadian cycling of the phosphorylation state of KaiC. KaiC harbors two phosphorylation sites: S431 and T432 that undergo the sequential phosphorylation order shown over the circadian cycle,, where ‘p’ means the site is phosphorylated (e.g., ‘S/pT’ means that T432 is phosphorylated, but S431 is not). The phosphomimics for each stage in the phosphorylation cycle are shown in parentheses (e.g., ‘KaiC-AE’ is the phosphomimic for the ‘S/pT’ phosphoform of KaiC). b Various phospho-mimics of KaiC were attached to AP-mica in the CII-end up (C-terminal-up) orientation. KaiA was added to the observation solution and then the dynamic interaction between KaiA and the KaiC phospho-mimics was monitored by HS-AFM in the absence of ATP. The following phospho-mimics were used: DE, KaiC-DE (mimic of pS/pT); DA, KaiC-DA (mimic of pS/T); AE, KaiC-AE (mimic of S/pT), and KaiC-AA (mimic of S/T). Concentration of KaiA, 1 μM. Frame rate, 1 fps. Scale bars = 20 nm. Also see Supplementary Movies 13–16. c Dwell time analysis for KaiA-bound state of phospho-mimics of KaiC observed by HS-AFM. The AFM images used in this analysis were captured at 10 fps. Each black solid line overlaid on the corresponding histogram of dwell time was obtained by fitting the histogram to a first order reaction model with a time constant (τbound) shown, except for the case of AA, where the value of τbound could not be determined (ND)
Fig. 4
Fig. 4
KaiA’s affinity to KaiC oscillates with the KaiC phosphorylation rhythm in vitro. a KaiA’s bound state lifetime (τbound) depends on KaiCWT phosphostatus over a 51-h time course of the in vitro cycle of phosphorylation. Purified KaiA (to a final concentration of 1.9 μM) was added to KaiC immobilized onto AP-mica and dynamics were observed by HS-AFM. See Supplementary Fig. 5 for dwell time data at each phase. Parallel samples were collected and immunoblotted to confirm KaiC phospho-status (blue) at each timepoint (Supplementary Fig. 6). KaiA–KaiC binding lifetime τbound was calculated from the bound-state dwell time analysis (red). b Correlation between the extent of KaiC phosphorylation and KaiA’s bound state lifetime (τbound). c, d Dwell time analysis of KaiA’s bound state lifetime c at the peak phase of phosphorylation cycle (24-h timepoint in a) or d at the trough phosphorylation phase (15-h timepoint in a). Dwell time analysis at each time point is shown in Supplementary Fig. 5, and a replicate experiment is shown in Supplementary Fig. 7
Fig. 5
Fig. 5
The values of τbound and τunbound depend upon KaiC’s phospho-status. a HS-AFM images of KaiC and KaiA interaction. Native KaiC hexamers (KaiCWT) that were approximately 81% phosphorylated (upper panels) or approximately 27% phosphorylated (lower panels) were immobilized on AP-mica surfaces and KaiA was added (final concentration of 0.4 µM) to the observation buffer. Images were acquired at a frame rate of 1 fps (upper) and 1.25 fps (lower). Brighter spots show KaiA bound to surface-immobilized KaiC. Scale bars = 30 nm. Also see Supplementary Movies 17, 18. b Dwell time analysis for KaiA-bound and KaiA-unbound states of hyperphosphorylated (81%; top) and hypo-phosphorylated (27%; bottom) KaiC. Each black line overlaid on the corresponding histogram of dwell time was obtained by fitting the histogram to a first order reaction model with a time constant (τbound or τunbound) shown. ‘n’ shown in each graph indicates the number of detected events used for the analysis
Fig. 6
Fig. 6
PDDA enhances resilience to variations in Kai protein stoichiometry. a Simulated effect of PDDA on oscillatory consistency. Three examples of simulated randomly changing variation of KaiA concentration (green) on KaiC phosphorylation patterns +PDDA (red) versus −PDDA (black). Concentrations of KaiC and KaiB were held constant as [KaiA] was varied. b Representative KaiC phosphorylation as the ratio of concentrations of KaiA dimer to KaiC hexamer was varied from the beginning of the time course without subsequent changes in KaiA, KaiB, or KaiC concentrations. Simulations were performed in the absence of PDDA (−PDDA, top) and with PDDA activated (+PDDA, bottom). The scale of [KaiA]: [KaiC] is shown to the right ([A2]/[C6]). In the case of −PDDA, the top two simulations ([A2]/[C6] = 3.0 and 3.5) coincide. c Range of allowed oscillatory regime (dashed vertical lines) and estimated oscillatory period as KaiA dimer to KaiC hexamer ratio ([KaiA2]/[KaiC6]) was varied with (+PDDA, red) or without PDDA (−PDDA, black). Simulations performed as shown in b. Absence of oscillations is indicated as period = 0. Error bars are ±S.D.
Fig. 7
Fig. 7
In silico and in vitro tests of PDDA enhancement of resilience. a Experimental confirmation of the simulation’s prediction of the effects of an acute KaiA concentration increase during the in vitro oscillation. KaiA concentrations were augmented at hour 32 by the addition of a concentrated KaiA solution to a KaiABC cycling reaction. The traces are vertically offset for clarity. The ordinal scale for each trace is the same as for the control reaction (bottom trace, black/red). b Simulation of predictions for the experimental test in a, where the ratio of KaiA dimer to KaiC hexamer ([A2]:[C6]) was increased from 1.33 to 1.9, 2.4, 3.0 or 4.1 at hour 27. Depicted are KaiC phosphorylation patterns resulting from KaiA steps during the dephosphorylation phase with PDDA (+PDDA, colored traces) as compared to the absence of PDDA (−PDDA, black traces). The [A2]/[C6] values at the far right apply to the experimental data (a) and the simulations (b). The traces are vertically offset for clarity as in a. c Model of PDDA’s action. During the phosphorylation phase of KaiC (S/T→S/pT→pS/pT), PDDA causes KaiA affinity for KaiC to decrease progressively, resulting in a shorter dwell time. Therefore, KaiC phosphostatus feeds back upon KaiA/KaiC interaction, changing the pattern of high-frequency KaiA/KaiC binding events and slowing its own rate of phosphoryation. This affects the kD of KaiA-stimulated KaiC phosphorylation, thereby influencing the period of the oscillation during the phosphorylation half-cycle. Moreover, PDDA facilitates the pS/pT→pS/T transition (by reducing the pS/T→pS/pT back reaction), enhancing KaiB association and the entry into the dephosphorylation half-cycle. This makes the overall oscillating reaction less sensitive to KaiA:KaiC stoichiometry and thus more resilient to fluctuations of the concentrations of the Kai proteins. KaiC, green; KaiA, gold; KaiB, purple

Similar articles

Cited by

References

    1. Dunlap, J. C., DeCoursey, P. J. & Loros, J. J. Chronobiology: Biological Timekeeping. (Sinauer Associates, Sunderland, MA, 2003).
    1. Mihalcescu I, Hsing W, Leibler S. Resilient circadian oscillator revealed in individual cyanobacteria. Nature. 2004;430:81–85. doi: 10.1038/nature02533. - DOI - PubMed
    1. Chabot JR, Pedraza JM, Luitel P, van Oudenaarden A. Stochastic gene expression out-of-steady-state in the cyanobacterial circadian clock. Nature. 2007;450:1249–1252. doi: 10.1038/nature06395. - DOI - PubMed
    1. Qin X, Byrne M, Xu Y, Mori T, Johnson CH. Coupling of a core post-translational pacemaker to a slave transcription/translation feedback loop in a circadian system. PLoS Biol. 2010;8:e1000394. doi: 10.1371/journal.pbio.1000394. - DOI - PMC - PubMed
    1. Elowitz MB, Leibler S. A synthetic oscillatory network of transcriptional regulators. Nature. 2000;403:335–338. doi: 10.1038/35002125. - DOI - PubMed

Publication types