. 2018 Aug 14;8(1):12088.
doi: 10.1038/s41598-018-30623-2.

Strong increase in the autofluorescence of cells signals struggle for survival

Affiliations

Strong increase in the autofluorescence of cells signals struggle for survival

Jérémy Surre et al. Sci Rep. .

Abstract

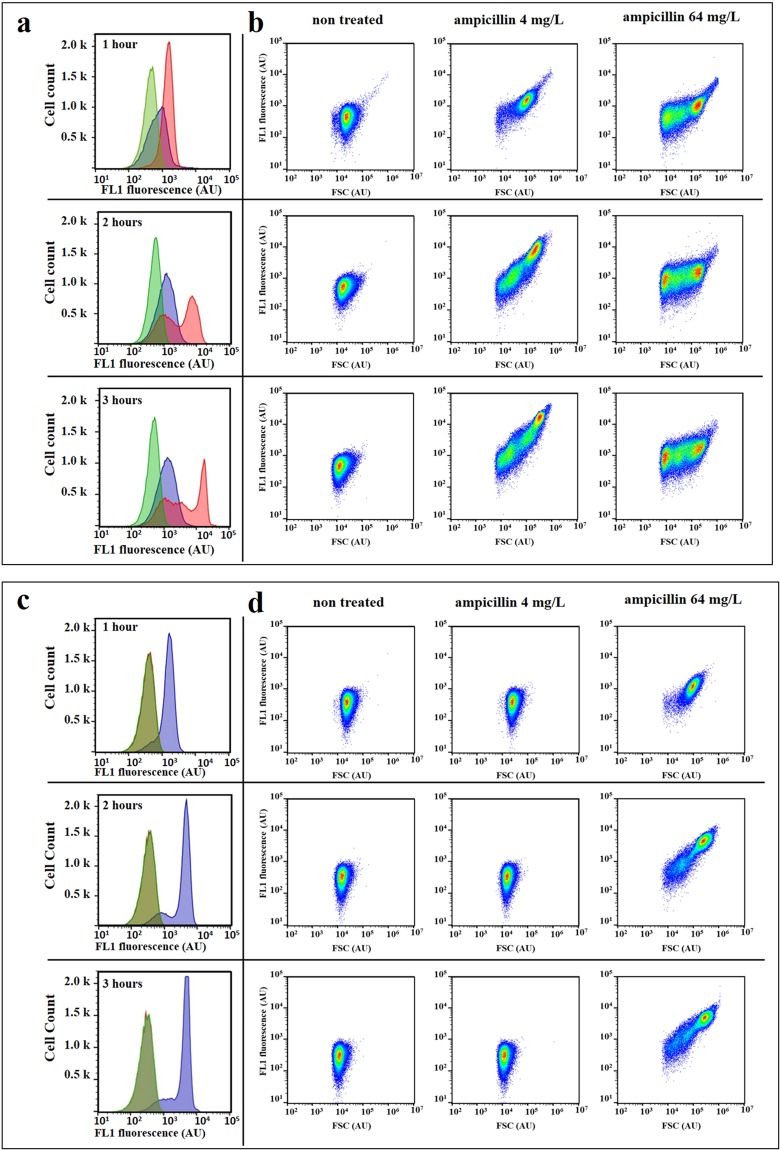
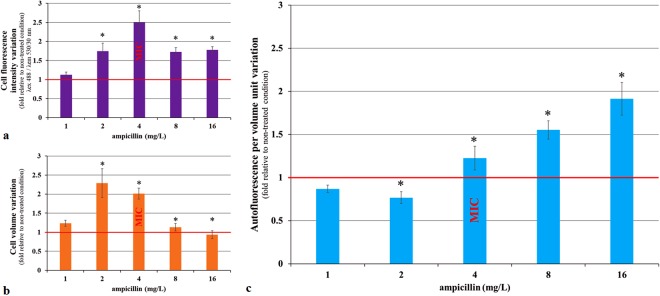
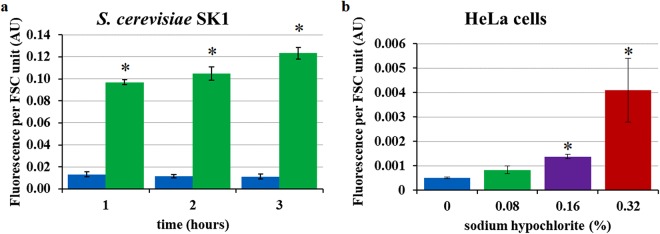
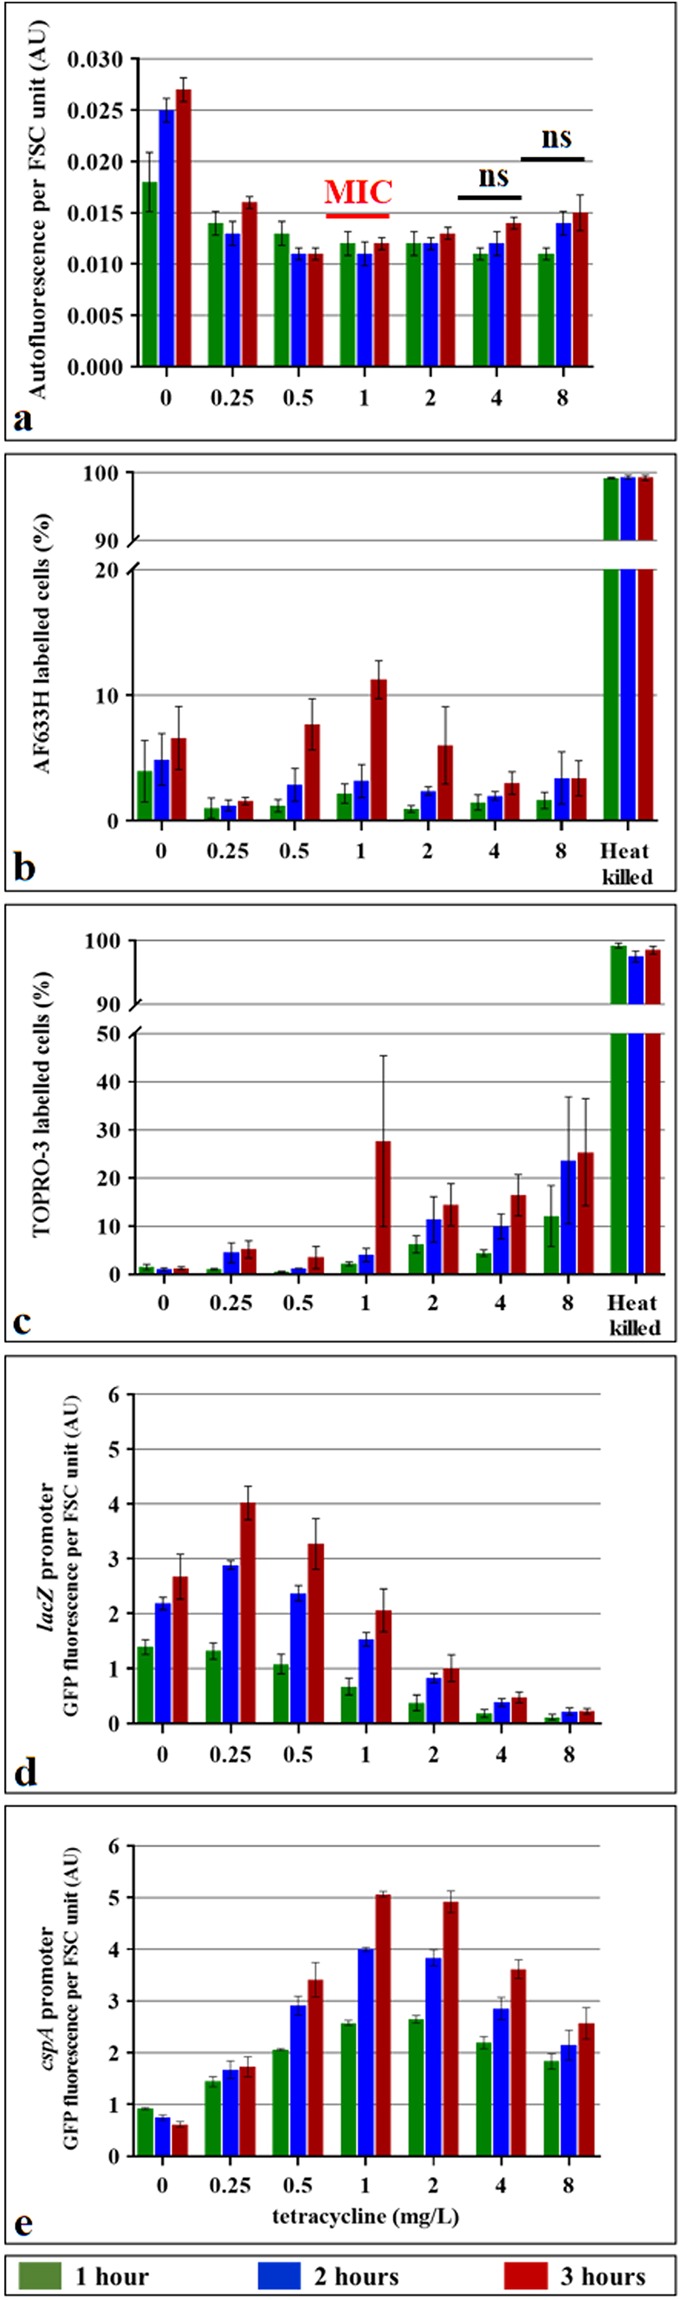
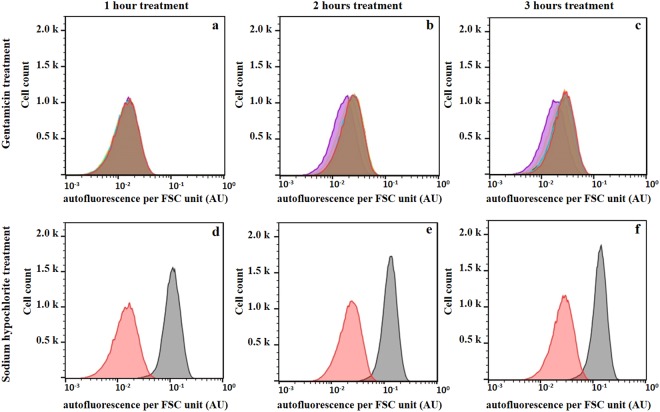
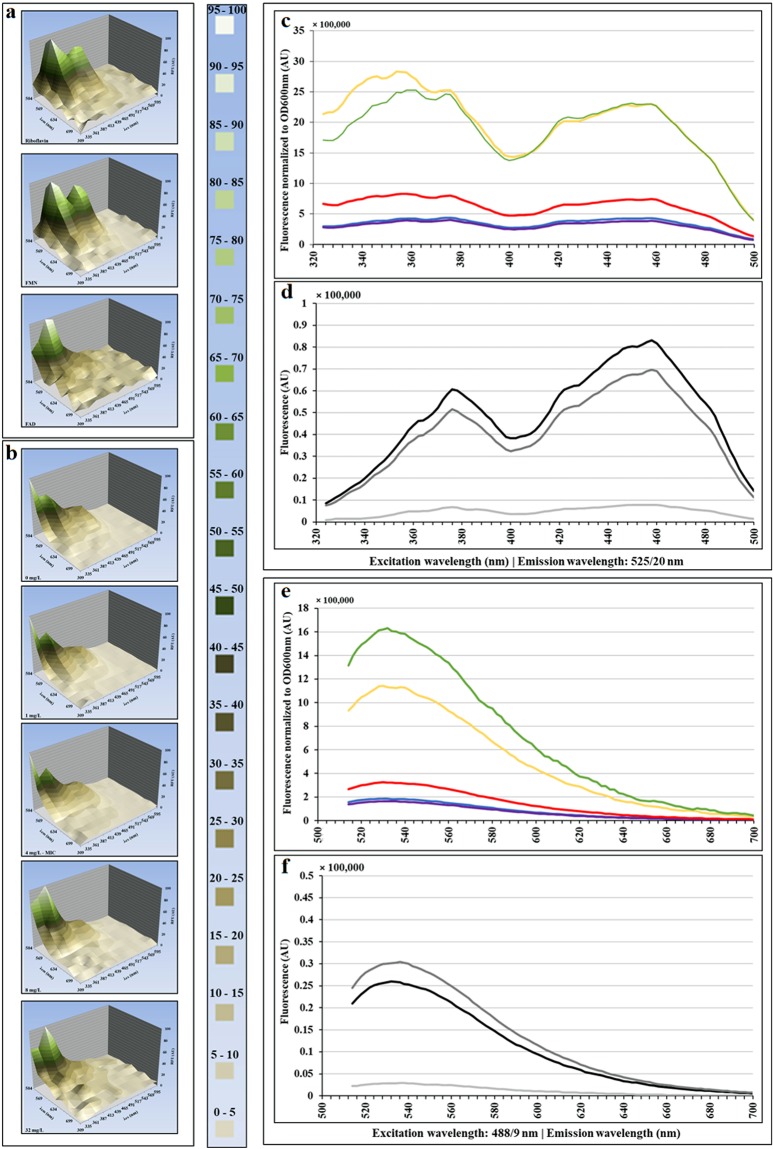
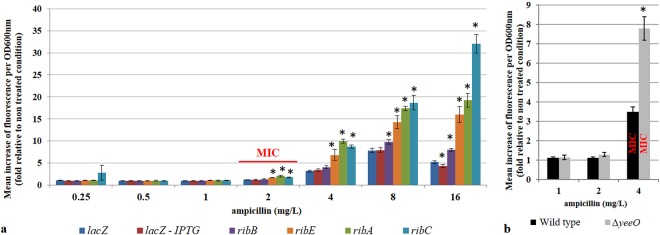
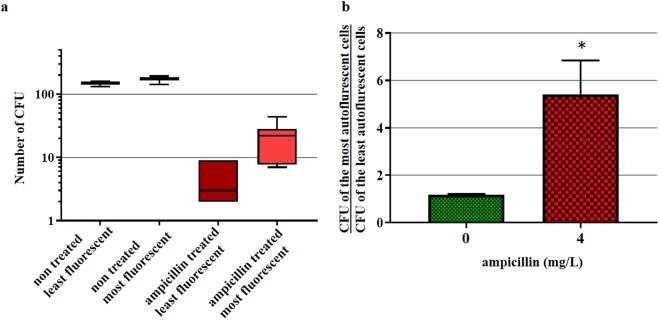
Prokaryotic and eukaryotic cells exhibit an intrinsic natural fluorescence due to the presence of fluorescent cellular structural components and metabolites. Therefore, cellular autofluorescence (AF) is expected to vary with the metabolic states of cells. We examined how exposure to the different stressors changes the AF of Escherichia coli cells. We observed that bactericidal treatments increased green cellular AF, and that de novo protein synthesis was required for the observed AF increase. Excitation and emission spectra and increased expression of the genes from the flavin biosynthesis pathway, strongly suggested that flavins are major contributors to the increased AF. An increased expression of genes encoding diverse flavoproteins which are involved in energy production and ROS detoxification, indicates a cellular strategy to cope with severe stresses. An observed increase in AF under stress is an evolutionary conserved phenomenon as it occurs not only in cells from different bacterial species, but also in yeast and human cells.


Conflict of interest statement

The authors declare no competing interests.

Figures

Figure 1
Figure 1
Effect of ampicillin treatment on the forward light scattering and autofluorescence intensity of E. coli cells. E. coli 7705035 [MIC = 4 mg/L; (a) and (b)] and 8812112 [MIC = 64 mg/L; (c) and (d)] cells were treated with a range of ampicillin concentrations for 3 hours of the exponential growth. Autofluorescence and forward light scattering signal (FSC) of treated cells and non-treated control were measured after 1, 2 and 3 hours of incubation using the Gallios flow cytometer. (a) and (c) The change in the distribution profiles of the cellular autofluorescence (λex 488 nm/λem 525/20 nm) over time, for the ampicillin concentrations: 0 (green), 4 (red) and 64 mg/L (blue). (b) and (d) 2-dimensional representation of the FSC and FL1 (λex 488 nm/λem 525/20 nm) of each event (n = 50,000) at 1, 2 and 3 hours of treatment with 0, 4, and 64 mg/L of ampicillin. This figure presents results of one representative experiment which was independently repeated three times. The overlap of green and red produces the khaki area.
Figure 2
Figure 2
Change in the autofluorescence, volume and autofluorescence per volume unit of E. coli cells after 2 hours of ampicillin treatment. E. coli 7705035 cells were treated, with a range of ampicillin concentrations during exponential growth. After 2 hours of treatment, images of 20,000 cells per condition were collected using the ImageStream flow cytometer system. (a) The cell autofluorescence intensity (λex 488 nm/λem 530/30 nm). (b) The cell volume. (c) The autofluorescence intensity per volume unit. For each cell, the fluorescence was normalized by the cell volume. Data are represented as a variation relative to a non-treated control. Each value represents the mean (+/−standard error) of the median values of four independent experiments. The asterisk represents significant differences in the ampicillin 1 versus ampicillin 0 (reference) condition according to 1-way ANOVA Dunn’s comparison test p value < 0.05.
Figure 3
Figure 3
Sodium hypochlorite-induced autofluorescence increase in eukaryotic cells. Yeast and human cells were treated with sodium hypochlorite and their autofluorescence was assessed by flow cytometry (λex 488/λem 525/20 nm). (a) S. cerevisiae SK1 strain. (b) HeLa human cervical cancer cells. Non-treated (blue). Sodium hypochlorite 0.08% (green), 0.16% (violet), 0.32% (red). S. cerevisiae was treated with 0.08% sodium hypochlorite for 1, 2 and 3 hours, while HeLa cells were treated with sodium hypochlorite for 1 hour. The asterisk represents significant differences relative to the non-treated controls according to the unpaired t-test; p value < 0.05. Each value represents the mean (+/−standard error) of the median values of three independent experiments.
Figure 4
Figure 4
Effect of tetracycline treatment on the autofluorescence, protein synthesis and viability of E. coli cells. E. coli 7705035 cells were treated with a range of tetracycline concentrations for 3 hours of the exponential growth. The MIC of this strain is 1 mg/L of tetracycline. Autofluorescence (a) and cell viability were assessed using AF633H (b) and TOPRO-3 (c) dyes and flow cytometer. As a control for staining of dead cells, cells were killed by incubation at 65 °C for 30 min. The impact of tetracycline on protein synthesis was assessed using lacZ (d) and cspA (e) promoters which were fused to the gene coding for the fast folding green fluorescent protein (GFP). cspA is known to be induced by protein synthesis inhibiting antibiotics, while lacZ should be repressed. Exponentially growing E. coli cells carrying plasmids with these reporter fusions, as well as promoter-less control plasmid, were incubated with IPTG and a range of tetracycline concentrations for 3 hours. Background autofluorescence was removed by subtracting the promoter-less autofluorescence. GFP fluorescence and FSC of each cell was monitored with the flow cytometer and cell autofluorescence or GFP fluorescence was normalized by the FSC. Values represent the mean (+/−standard error) of the median values of three independent experiments.
Figure 5
Figure 5
Effects of gentamicin and sodium hypochlorite treatment on the autofluorescence of E. coli cells. E. coli 7705035 cells were treated with a range of gentamicin concentrations corresponding to 0 (red), 0.125 (light blue), 0.25 (orange), 0.5 (MIC; light green), 1 (dark green), 2 (brown) and 4 mg/L (violet) or 0.08% sodium hypochlorite (grey) for 3 hours of the exponential growth. Autofluorescence and FSC of treated cells and untreated control were measured after 1, 2 and 3 hours of incubation using a flow cytometer. Cell autofluorescence was normalized by the FSC signal to obtain the autofluorescence per FSC unit. (a), (b) and (c) 1, 2 and 3 hours of gentamicin treatment respectively. The overlap of red, light blue, orange, light green and dark green produces the brown area. (d), (e) and (f) 1, 2 and 3 hours of sodium hypochlorite treatment respectively. This figure presents results of representative experiments, which were independently repeated 4 times.
Figure 6
Figure 6
Comparison of excitation and emission spectra of ampicillin-treated E. coli cells and purified flavonoid compounds. E. coli 7705035 cells [MIC = 4 mg/L] growing exponentially in M9 medium supplemented with glucose, were treated with a range of ampicillin concentrations for 6 hours. After 6 hours of treatment, the excitation and emission spectra of treated cells were established and compared with the spectra of FAD, FMN and riboflavin. Three-dimensional representation of fluorescence spectra of flavins (a) and E. coli (b). (c) and (e): excitation and emission spectra of E. coli cells treated with ampicillin, normalized to the optical density at 600 nm. The colors represent ampicillin concentrations: 0 (blue line), 1 (violet line), 4 (red line), 8 (yellow line) and 32 mg/L (green line). (d) and (f): excitation and emission spectra of 10 µM purified flavonoid compounds: FAD, FMN and riboflavin. The colors represent: light grey for FAD, black for FMN and dark grey for riboflavin. This figure presents results of representative experiments, which were independently repeated 4 times.
Figure 7
Figure 7
Expression of rib genes in ampicillin-treated E. coli cells. (a) The promoters of lacZ (dark blue), ribA (green), ribB (violet), ribC (light blue) and ribE (orange) genes were fused to the gene coding for the fast-folding green fluorescent protein (GFP). The promoter of the lacZ gene was induced with IPTG (red). E. coli MG1655 strains (MIC ampicillin = 2 mg/L) carrying plasmids with these transcription reporter fusions were grown with a range of ampicillin concentrations. After 3 hours of incubation, GFP fluorescence (λex 488/9/λem 525/20 nm) and OD600 nm of treated cells and non-treated control were measured using a fluorimeter. The fluorescence increase was calculated using the non-treated control of each strain as reference. (b) Wild type BW25113 strain and its ∆yeeO derivative were treated with a range of ampicillin concentrations during exponential growth. Autofluorescence (λex 440/9/λem 525/20 nm) and OD600nm of treated cells and non-treated controls were measured using a fluorimeter. To calculate the increase in the autofluorescence due to ampicillin treatment, autofluorescence of treated cells was first normalized by OD600nm and then by the normalized autofluorescence of the non-treated controls of each strain. Each value represents the mean (+/−standard error) of the fluorescence increase from six independent experiments. The asterisk represents significant differences with the lacZ control according to unpaired t-test p value: < 0.05.
Figure 8
Figure 8
Autofluorescence as a predictor of the survival of ampicillin-treated E. coli cells. E. coli 7705035 cells were incubated with 4 mg/L ampicillin (MIC). After 2 hours of incubation, the autofluorescence of treated and non-treated control cells was analyzed using the S3e cell sorter. 200 of the least and 200 of the most autofluorescent cells were sorted and plated on LB agar. After overnight growth, colony-forming units (CFU) were counted to assess the bacterial survival. (a) Box plot of the CFUs. (b) The mean ratio (+/−standard error) between the number of CFUs of the most and the least fluorescent cells of treated and non-treated control cells per experiment. Presented data are from six independent experiments. The asterisk represents significant difference according to paired T-test p value: 0.034.

References

    1. Billinton N, Knight AW. Seeing the wood through the trees: A review of techniques for distinguishing green fluorescent protein from endogenous autofluorescence. Analytical Biochemistry. 1984;291:175–197. doi: 10.1006/abio.2000.5006. - DOI - PubMed
    1. Croce AC, Bottiroli G. Autofluorescence spectroscopy and imaging: a tool for biomedical research and diagnosis. Eur J Histochem. 2014;58:2461. doi: 10.4081/ejh.2014.2461. - DOI - PMC - PubMed
    1. Georgakoudi I, Quinn KP. Optical imaging using endogenous contrast to assess metabolic state. Annu Rev Biomed Eng. 2012;14:351–367. doi: 10.1146/annurev-bioeng-071811-150108. - DOI - PubMed
    1. Monici M. Cell and tissue autofluorescence research and diagnostic applications. Biotechnol Annu Rev. 2005;11:227–256. doi: 10.1016/S1387-2656(05)11007-2. - DOI - PubMed
    1. Buryakina TY, et al. Metabolism of HeLa cells revealed through autofluorescence lifetime upon infection with enterohemorrhagic Escherichia coli. J Biomed Opt. 2012;17:101503. doi: 10.1117/1.JBO.17.10.101503. - DOI - PubMed

Publication types

MeSH terms