. 2018 Aug 14;8(1):12128.
doi: 10.1038/s41598-018-30649-6.

Unbiased shRNA screening, using a combination of FACS and high-throughput sequencing, enables identification of novel modifiers of Polycomb silencing

Affiliations

Unbiased shRNA screening, using a combination of FACS and high-throughput sequencing, enables identification of novel modifiers of Polycomb silencing

Kenichi Nishioka et al. Sci Rep. .

Abstract

Polycomb silencing is an important and rapidly growing field that is relevant to a broad range of aspects of human health, including cancer and stem cell biology. To date, the regulatory mechanisms for the fine-tuning of Polycomb silencing remain unclear, but it is likely that there is a series of unidentified factors that functionally modify or balance the silencing. However, a practical gene screening strategy for identifying such factors has not yet been developed. The failure of screening strategies used thus far is probably due to the effect of the loss-of-function phenotypes of these factors on cell cycle progression. Here, by applying fluorescence-activated cell sorter (FACS) and high-throughput sequencing (HTS) technology in a large-scale lentivirus-mediated shRNA screening, we obtained a consecutive dataset from all shRNAs tested, which highlighted a substantial number of genes that may control Polycomb silencing. We consider that this unbiased strategy can readily be applied to a wide range of studies to uncover novel regulatory layers for expression of genes of interest.


Conflict of interest statement

The authors declare no competing interests.

Figures

Figure 1
Figure 1
Characterisation of mouse F9 cells for screening purposes. (A) A scatter plot of candidate reporter genes in F9 cells. Upon RA treatment, 28 Polycomb-target genes were strongly upregulated. X-axis, log2-fold change (log2-fc) in gene expression after RA treatment; Y-axis, mean log2- count per million (log2-cpm) representing relative expression levels. (B) RT-qPCR of Col4a1 mRNA expression in differentiating F9 cells. RA was titrated in the presence of db-cAMP. Data presented as mean ± s.d. relative to Gapdh mRNA expression. (C) Immunofluorescence analysis of type IV collagen expression before (−) or after (+) RA-induced differentiation. Bars, 50 µm. (D) RT-qPCR f Col4a1 and Hoxb4 mRNA expression at the indicated RA concentration. Data presented as mean ± s.d. relative to Gapdh mRNA expression. *P < 0.05. (E) ChIP-qPCR analysis of histone H3K27me3, H3K4me3 or H2AK119ub levels in chromatin containing the indicated gene promoter regions (around +300 bases from the transcription start site) in the presence or absence of RA. Data presented as mean ± s.d. relative to input. ChIP signals from the promoter region of Il2ra (control region) were indicated by interrupted lines. *P < 0.05. (F) Conventional RT-PCR of indicated mRNA expression in either Suz12 or Ring1b knockdown (KD) cells. (G) Western blot analysis of KD cells using the indicated antibodies. (H) RT-qPCR of Col4a1 mRNA expression in the indicated KD cells. Data presented as mean ± s.d. relative to Gapdh mRNA expression. *P < 0.05. (I) Immunofluorescence analysis of type IV collagen expression in the indicated KD cells. Bars, 50 µm.
Figure 2
Figure 2
Outline of our screening strategy. (A) Lentiviral transduced F9 cells (>2 × 108 cells) were subjected to FACS, and then the input fraction (2 × 107 cells) and the Allexa488-high-intensity fraction (2 × 107 cells) were pooled in each replicate. Genomic DNA was processed for HTS library generation, and 2 × 107 reads for each fraction were sequenced. Scatter plot representing each shRNA construct in the high-intensity fraction against input. X-axis, normalised representation of input; Y-axis, log2-fc of normalised high-intensity fraction against input. Red spots represent shRNA constructs that changed significantly relative to the input (P < 0.01), of which the upper group was used in this study (Supplementary Table S1). The resulting 1,276 raw candidate genes were subjected to in silico filtering, with 434 final candidate genes extracted (Supplementary Tables S2–S4). (B) A Venn diagram representing the relationships among the extracted candidate genes and their expression in F9 cells and ESCs. The 434 final candidate genes (shown in red) were subjected to further verification analysis for Polycomb-group enrichment (see Fig. 3A), with Edf1 (Mbf1) and Setd5 selected for further characterisation. Data are summarised in Supplementary Table S3.
Figure 3
Figure 3
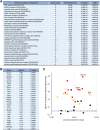
Evaluation and verification of our screening strategy. (A) The 434 final candidate genes (Supplementary Table S3) were analysed using the PANTHER classification system with regard to cellular component enrichment. The top 30 terms ranked according to fold enrichment are shown. (B) Screening results of the representative shRNA constructs for each Polycomb group gene or its related gene are listed. (C) Scatter plot of 25 of a part of genes listed in (B), with significantly enriched shRNA constructs represented by coloured spots (orange, P < 0.05; red, P < 0.01). PRC2 core components are labelled.
Figure 4
Figure 4
Examples of newly identified genes. (A) A graphical summary of a novel function of Mbf1, the Drosophila counterpart of mammalian Edf1. Mbf1 is a known nuclear coactivator promoting an interaction between an activator and a transcriptional preinitiation complex under stress conditions. We recently reported that cytosolic Mbf1 protects E(z) mRNA from Pacman attack under non-stress conditions, thereby ensuring robust Polycomb silencing. (B and C) HTS analyses of (B) Prdm5 and (C) Setd5. Left panel, Venn diagrams analysing the impact of the differentially expressed genes (DEG) in each knockout (KO) in the ESC modules. DEG, |log2-fc| > 1 and P < 0.01. Statistical analysis of the relationship between the PRC module against either the Myc module or the Core module was done by the Chi-square test. Prdm5, P < 10−134; Setd5, P < 10−98. Right panel, metagene analyses of the histone H3K27me3 level in the indicated genomic region by plotting log2-fold enrichment (log2-fe) against input data. PRC-Module, Kim et al.; Bivalent Genes, Mikkelsen et al..

Similar articles

Cited by

References

    1. Grossniklaus U, Paro R. Transcriptional silencing by polycomb-group proteins. Cold Spring Harb Perspect Biol. 2014;6:a019331. doi: 10.1101/cshperspect.a019331. - DOI - PMC - PubMed
    1. Schuettengruber B, Bourbon HM, Di Croce L, Cavalli G. Genome Regulation by Polycomb and Trithorax: 70 Years and Counting. Cell. 2017;171:34–57. doi: 10.1016/j.cell.2017.08.002. - DOI - PubMed
    1. Piunti A, Shilatifard A. Epigenetic balance of gene expression by Polycomb and COMPASS families. Science. 2016;352:aad9780. doi: 10.1126/science.aad9780. - DOI - PubMed
    1. Comet I, Riising EM, Leblanc B, Helin K. Maintaining cell identity: PRC2-mediated regulation of transcription and cancer. Nat Rev Cancer. 2016;16:803–810. doi: 10.1038/nrc.2016.83. - DOI - PubMed
    1. Gao Z, et al. PCGF homologs, CBX proteins, and RYBP define functionally distinct PRC1 family complexes. Mol Cell. 2012;45:344–356. doi: 10.1016/j.molcel.2012.01.002. - DOI - PMC - PubMed

Publication types

Substances

LinkOut - more resources