. 2019 Jun:93:1-63.
doi: 10.1016/j.simyco.2018.06.001. Epub 2018 Jul 31.

Taxonomy of Aspergillus section Flavi and their production of aflatoxins, ochratoxins and other mycotoxins

Affiliations

Taxonomy of Aspergillus section Flavi and their production of aflatoxins, ochratoxins and other mycotoxins

J C Frisvad et al. Stud Mycol. 2019 Jun.

Abstract

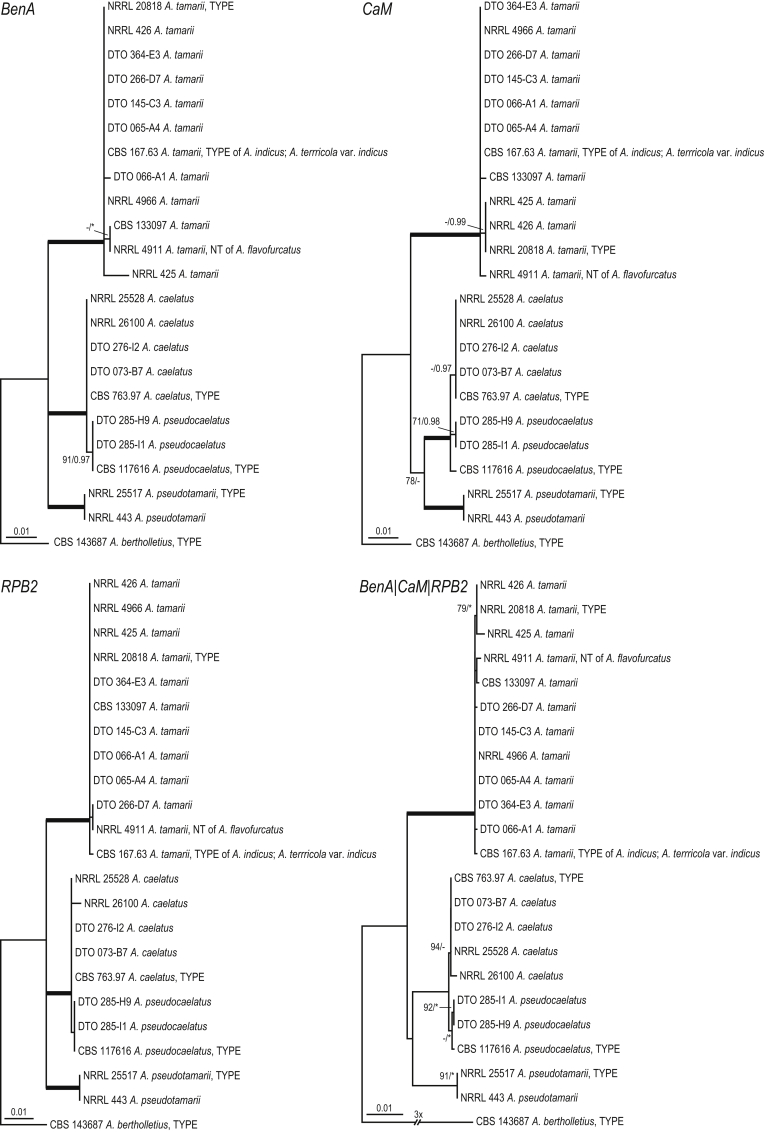
Aflatoxins and ochratoxins are among the most important mycotoxins of all and producers of both types of mycotoxins are present in Aspergillus section Flavi, albeit never in the same species. Some of the most efficient producers of aflatoxins and ochratoxins have not been described yet. Using a polyphasic approach combining phenotype, physiology, sequence and extrolite data, we describe here eight new species in section Flavi. Phylogenetically, section Flavi is split in eight clades and the section currently contains 33 species. Two species only produce aflatoxin B1 and B2 (A. pseudotamarii and A. togoensis), and 14 species are able to produce aflatoxin B1, B2, G1 and G2: three newly described species A. aflatoxiformans, A. austwickii and A. cerealis in addition to A. arachidicola, A. minisclerotigenes, A. mottae, A. luteovirescens (formerly A. bombycis), A. nomius, A. novoparasiticus, A. parasiticus, A. pseudocaelatus, A. pseudonomius, A. sergii and A. transmontanensis. It is generally accepted that A. flavus is unable to produce type G aflatoxins, but here we report on Korean strains that also produce aflatoxin G1 and G2. One strain of A. bertholletius can produce the immediate aflatoxin precursor 3-O-methylsterigmatocystin, and one strain of Aspergillus sojae and two strains of Aspergillus alliaceus produced versicolorins. Strains of the domesticated forms of A. flavus and A. parasiticus, A. oryzae and A. sojae, respectively, lost their ability to produce aflatoxins, and from the remaining phylogenetically closely related species (belonging to the A. flavus-, A. tamarii-, A. bertholletius- and A. nomius-clades), only A. caelatus, A. subflavus and A. tamarii are unable to produce aflatoxins. With exception of A. togoensis in the A. coremiiformis-clade, all species in the phylogenetically more distant clades (A. alliaceus-, A. coremiiformis-, A. leporis- and A. avenaceus-clade) are unable to produce aflatoxins. Three out of the four species in the A. alliaceus-clade can produce the mycotoxin ochratoxin A: A. alliaceus s. str. and two new species described here as A. neoalliaceus and A. vandermerwei. Eight species produced the mycotoxin tenuazonic acid: A. bertholletius, A. caelatus, A. luteovirescens, A. nomius, A. pseudocaelatus, A. pseudonomius, A. pseudotamarii and A. tamarii while the related mycotoxin cyclopiazonic acid was produced by 13 species: A. aflatoxiformans, A. austwickii, A. bertholletius, A. cerealis, A. flavus, A. minisclerotigenes, A. mottae, A. oryzae, A. pipericola, A. pseudocaelatus, A. pseudotamarii, A. sergii and A. tamarii. Furthermore, A. hancockii produced speradine A, a compound related to cyclopiazonic acid. Selected A. aflatoxiformans, A. austwickii, A. cerealis, A. flavus, A. minisclerotigenes, A. pipericola and A. sergii strains produced small sclerotia containing the mycotoxin aflatrem. Kojic acid has been found in all species in section Flavi, except A. avenaceus and A. coremiiformis. Only six species in the section did not produce any known mycotoxins: A. aspearensis, A. coremiiformis, A. lanosus, A. leporis, A. sojae and A. subflavus. An overview of other small molecule extrolites produced in Aspergillus section Flavi is given.

Keywords: A. Nováková; A. vandermerwei Frisvad; Aflatoxins; Arzanlou & Samson; Aspergillus; Aspergillus aflatoxiformans Frisvad; Aspergillus aspearensis Houbraken; Aspergillus austwickii Frisvad; Aspergillus cerealis Houbraken; Aspergillus neoalliaceus A. Nováková; Aspergillus pipericola Frisvad; Aspergillus subflavus Hubka; Cyclopiazonic acid; Ezekiel; Ezekiel & Samson; Frisvad; Frisvad & Houbraken; Hubka; Samson; Samson & Houbraken; Section Flavi; Tenuazonic acid.


Figures

Fig. 1
Fig. 1
Phylogeny inferred from a concatenated nucleotide data set (partial BenA, CaM and RPB2 sequences) using ML analysis showing the relationship of species accommodated in Aspergillus section Flavi. The bar indicates the number of substitutions per site. The BI posterior probabilities values and bootstrap percentages of the ML analysis are presented at the node (BS/pp). Values less than 70 % bootstrap support in the ML analysis and less than 0.95 posterior probability in the Bayesian analysis are indicated with a hyphen. Branches with high support (> 95 % bs; 1.00 pp) are thickened and the BS and pp values indicated with an asterisks.
Fig. 2
Fig. 2
ML Phylogeny showing the relationship of species accommodated in the A. flavus-clade (left, BenA; right, CaM). The bar indicates the number of substitutions per site. The BI posterior probabilities values and bootstrap percentages of the ML analysis are presented at the node (BS/pp). Values less than 70 % bootstrap support in the ML analysis and less than 0.95 posterior probability in the Bayesian analysis are indicated with a hyphen. Branches with high support (> 95 % bs; 1.00 pp) are thickened and the BS and pp values indicated with an asterisks.
Fig. 3
Fig. 3
Phylogeny showing the relationship of species accommodated in the A. flavus-clade (left, RPB2; right, combined data set of BenA, CaM and RPB2). The bar indicates the number of substitutions per site. The BI posterior probabilities values and bootstrap percentages of the ML analysis are presented at the node (BS/pp). Values less than 70 % bootstrap support in the ML analysis and less than 0.95 posterior probability in the Bayesian analysis are indicated with a hyphen. Branches with high support (> 95 % bs; 1.00 pp) are thickened and the BS and pp values indicated with an asterisks.
Fig. 4
Fig. 4
Phylogeny showing the relationship of species accommodated in the A. tamarii-clade. The bar indicates the number of substitutions per site. The BI posterior probabilities values and bootstrap percentages of the ML analysis are presented at the node (BS/pp). Values less than 70 % bootstrap support in the ML analysis and less than 0.95 posterior probability in the Bayesian analysis are indicated with a hyphen. Branches with high support (> 95 % bs; 1.00 pp) are thickened and the BS and pp values indicated with an asterisks.
Fig. 5
Fig. 5
Phylogeny showing the relationship of species accommodated in the A. nomius-clade. The bar indicates the number of substitutions per site. The BI posterior probabilities values and bootstrap percentages of the ML analysis are presented at the node (BS/pp). Values less than 70 % bootstrap support in the ML analysis and less than 0.95 posterior probability in the Bayesian analysis are indicated with a hyphen. Branches with high support (> 95 % bs; 1.00 pp) are thickened and the BS and pp values indicated with an asterisks.
Fig 6
Fig 6
ML Phylogeny showing the relationship of species accommodated in the A. alliaceus-clade (left, BenA; right, CaM). The bar indicates the number of substitutions per site. The BI posterior probabilities values and bootstrap percentages of the ML analysis are presented at the node (BS/pp). Values less than 70 % bootstrap support in the ML analysis and less than 0.95 posterior probability in the Bayesian analysis are indicated with a hyphen. Branches with high support (> 95 % bs; 1.00 pp) are thickened and the BS and pp values indicated with an asterisks.
Fig. 7
Fig. 7
Phylogeny showing the relationship of species accommodated in the A. alliaceus-clade (left, RPB2; right, combined data set of BenA, CaM and RPB2). The bar indicates the number of substitutions per site. The BI posterior probabilities values and bootstrap percentages of the ML analysis are presented at the node (BS/pp). Values less than 70 % bootstrap support in the ML analysis and less than 0.95 posterior probability in the Bayesian analysis are indicated with a hyphen. Branches with high support (> 95 % bs; 1.00 pp) are thickened and the BS and pp values indicated with an asterisks.
Fig. 8
Fig. 8
Phylogeny showing the relationship of species accommodated in the A. leporis-clade. The bar indicates the number of substitutions per site. The BI posterior probabilities values and bootstrap percentages of the ML analysis are presented at the node (BS/pp). Values less than 70 % bootstrap support in the ML analysis and less than 0.95 posterior probability in the Bayesian analysis are indicated with a hyphen. Branches with high support (> 95 % bs; 1.00 pp) are thickened and the BS and pp values indicated with an asterisks.
Fig. 9
Fig. 9
Left to right: 7 d old colonies on CYA, CYA 37 °C, CYA 42 °C, YES, MEA, DG18; top to bottom: A. aflatoxiformans CBS 143679, A. alliaceus CBS 542.65, A. arachidicola CBS 117610, A. aspearensis CBS 143672, A. austwickii CBS 143677, A. avenaceus CBS 109.46, A. bertholletius CBS 143687, A. caelatus CBS 763.97.
Fig. 10
Fig. 10
Left to right: 7 d old colonies on CYA, CYA 37 °C, CYA 42 °C, YES, MEA, DG18; top to bottom: A. cerealis CBS 143674, A. coremiiformis CBS 553.77, A. flavus DTO 258-C9, A. hancockii CBS 142002, A. lanosus CBS 650.74, A. leporis CBS 129235, A. luteovirescens DTO 073-C2 (=NRRL 29235), A. minisclerotigenes DTO 045-F5 (=FRR 4937).
Fig. 11
Fig. 11
Left to right: 7 d old colonies on CYA, CYA 37 °C, CYA 42 °C, YES, MEA, DG18; top to bottom: A. mottae CBS 130016, A. neoalliaceus DTO 326-E7 (=CCF 5413), A. nomius DTO 247-G8, A. novoparasiticus CBS 126849, A. oryzae CBS 100925, A. parasiticus CBS 100926, A. pipericola CBS 143680, A. pseudocaelatus CBS 117616.
Fig. 12
Fig. 12
Left to right: 7 d old colonies on CYA, CYA 37 °C, CYA 42 °C, YES, MEA, DG18; top to bottom: A. pseudonomius CBS 119388, A. pseudotamarii CBS 766.97, A. sergii CBS 130017, A. sojae CBS 100928, A. subflavus CBS 143683, A. tamarii DTO 266-D7, A. togoensis CBS 272.89, A. vandermerwei DTO 368-C2 (= IBT 20468).
Fig. 13
Fig. 13
Sclerotia production by various species belonging to A. flavus-clade. A. A. flavus DTO 281-H8; B. A. flavus DTO 282-A1; C. A. aflatoxiformans CBS 135404; D. A. austwickii CBS 143677; E. A. minisclerotigenes DTO 045-F5; F. A. mottae CBS 130016; G. A. parasiticus DTO 285-G9; H. A. sergii CBS 130017; I. A. subflavus CBS 143683; J. A. cerealis CBS 143675; K. A. pipericola CBS 143680. Scale bar = 500 μm.
Fig. 14
Fig. 14
Sclerotia production by species belonging to Aspergillus section Flavi (and outside the A. flavus-clade; see Fig. 13). A. A. alliaceus CBS 143682; B. A. neoalliaceus CBS 143681; C. A. hancockii CBS 142004; D. A. leporis CBS 129203; E. A. aspearensis CBS 143672; F. A. nomius CBS 260.88; G. A. pseudonomius DTO 267-H7; H. A. caelatus DTO 285-I1; I. A. pseudotamarii CBS 766.97; J. A. bombycis DTO 238-E5. Scale bar = 1000 μm.
Fig. 15
Fig. 15
Aspergillus aflatoxiformans CBS 143679T. A. 7 d old colonies: top row left to right, obverse CYA, obverse MEA, YES and OA; bottom row left to right, reverse CYA, reverse MEA, DG18 and CREA. B. Sclerotia on MEA. C–F. Conidiophores and conidia. G. Conidia. Scale bars: B = 500 μm; C = 100 μm; D = 20 μm; E–G = 10 μm.
Fig. 16
Fig. 16
Aspergillus aspearensis CBS 143672T. A. 7 d old colonies: top row left to right, obverse CYA, obverse MEA, YES and OA; bottom row left to right, reverse CYA, reverse MEA, DG18 and CREA. B–F. Conidiophores and conidia. G. Conidia. Scale bars: B = 20 μm; C–G = 10 μm.
Fig. 17
Fig. 17
Aspergillus austwickii CBS 143677T. A. 7 d old colonies: top row left to right, obverse CYA, obverse MEA, YES and OA; bottom row left to right, reverse CYA, reverse MEA, DG18 and CREA. B. Sclerotia on MEA. C–F. Conidiophores and conidia. G. Conidia. Scale bars: B = 500 μm; C = 100 μm; D = 20 μm; E–G = 10 μm.
Fig. 18
Fig. 18
Aspergillus cerealis CBS 143674T. A. 7 d old colonies: top row left to right, obverse CYA, obverse MEA, YES and OA; bottom row left to right, reverse CYA, reverse MEA, DG18 and CREA. B. Sclerotia on MEA. C–F. Conidiophores and conidia. G. Conidia. Scale bars: B = 500 μm; C = 100 μm; D = 20 μm; E–G = 10 μm.
Fig. 19
Fig. 19
Aspergillus neoalliaceus CBS 143681T. A. 7 d old colonies: top row left to right, obverse CYA, obverse MEA, YES and OA; bottom row left to right, reverse CYA, reverse MEA, DG18 and CREA. B. Sclerotia on MEA. C–F. Conidiophores and conidia. G. Conidia. Scale bars: B = 500 μm; C = 100 μm; D = 20 μm; E–G = 10 μm.
Fig. 20
Fig. 20
Aspergillus pipericola CBS 143680T. A. 7 d old colonies: top row left to right, obverse CYA, obverse MEA, YES and OA; bottom row left to right, reverse CYA, reverse MEA, DG18 and CREA. B. Sclerotia on MEA. C–F. Conidiophores and conidia. G. Conidia. Scale bars: B = 500 μm; C = 20 μm; D, E = 10 μm; F–G = 10 μm.
Fig. 21
Fig. 21
Aspergillus subflavus CBS 143683T. A. 7 d old colonies: top row left to right, obverse CYA, obverse MEA, YES and OA; bottom row left to right, reverse CYA, reverse MEA, DG18 and CREA. B. Sclerotia on MEA. C–F. Conidiophores and conidia. G. Conidia. Scale bars: B = 500 μm; C = 100 μm; D = 20 μm; E–G = 10 μm.
Fig. 22
Fig. 22
Aspergillus vandermerwei CBS 612.78T. A. 7 d old colonies: top row left to right, obverse CYA, obverse MEA, YES and OA; bottom row left to right, reverse CYA, reverse MEA, DG18 and CREA. B. Conidial head on MEA. C–F. Conidiophores and conidia. G. Conidia. Scale bars: B = 500 μm; C = 100 μm; D = 50 μm; E–G = 10 μm.

References

    1. Adler M., Wintersteiner O. A reinvestigation of flavacidin, the penicillin produced by Aspergillus flavus. Journal of Biological Chemistry. 1948;176:873–891. - PubMed
    1. Amaike S., Keller N.P. Aspergillus flavus. Annual Review of Phytopathology. 2011;49:107–133. - PubMed
    1. Amare M.G., Keller N.P. Molecular mechanisms of Aspergillus flavus secondary metabolism and development. Fungal Genetics and Biology. 2014;66:11–18. - PubMed
    1. Ammar H.A.M., Srour A.Y., Ezzat S.M. Identification and characterization of genes involved in kojic acid biosynthesis in Aspergillus flavus. Annals of Microbiology. 2017;67:691–702.
    1. Arnstein H.R.V., Cook A.H. The penicillin produced by Aspergillus parasiticus. British Journal of Experimental Pathology. 1947;28:94–98. - PMC - PubMed

LinkOut - more resources