

Polymorphism studies on microRNA targetome of thalassemia
- PMID: 30108424
- PMCID: PMC6077818
- DOI: 10.6026/97320630014252
Polymorphism studies on microRNA targetome of thalassemia
Abstract
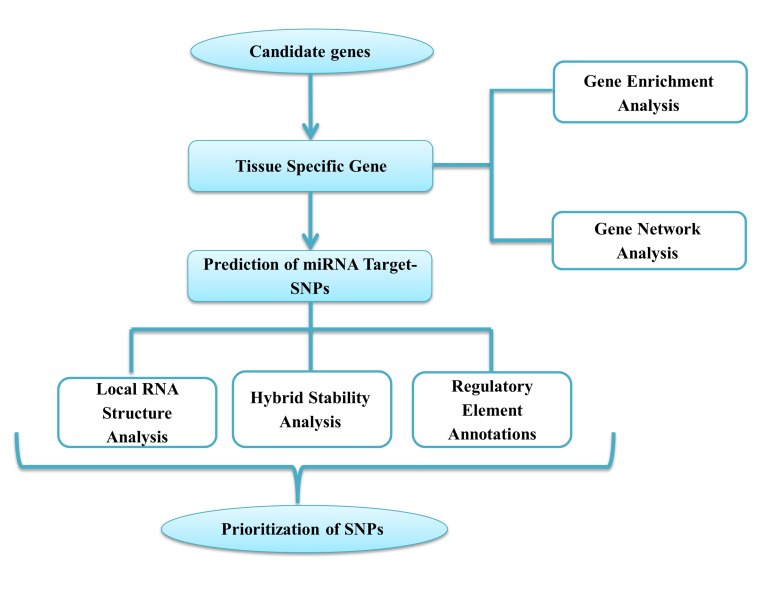
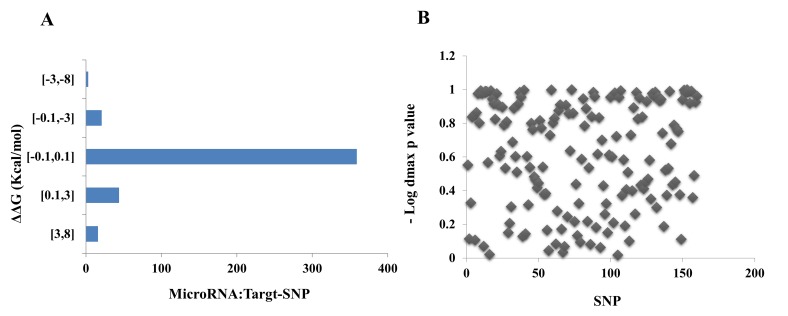
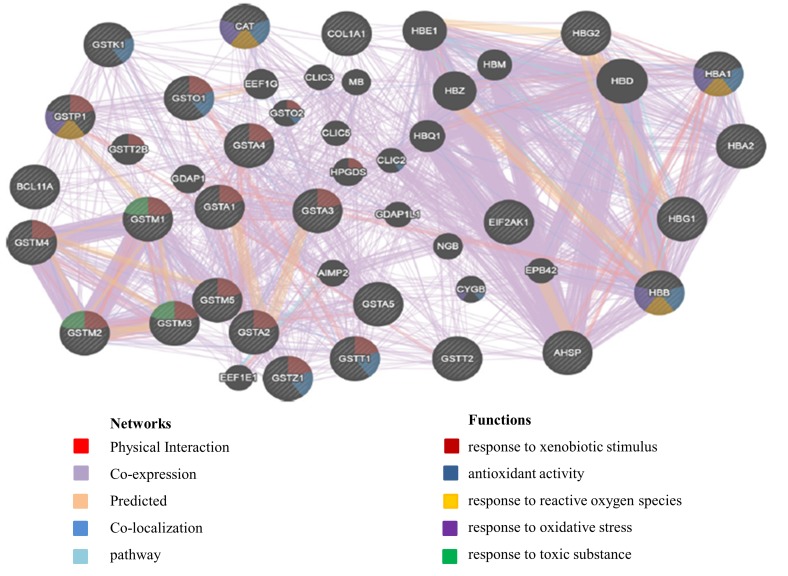
Thalassemia is one of the most prevalent hemoglobin disorders. It is caused by the decreased or absent synthesis of one globin chain that leads to moderate to severe hemolytic anemia in clinical complications. Some genetic factors cause these phenotypic variations by the alteration of gene expression. MicroRNAs (miRNAs) are post-transcriptional regulators in gene expression. Therefore, variations in 3'-untranslated region (3'-UTR) of target genes may affect gene expression. It is of interest to evaluate the impact of noncoding SNPs in thalassemia related genes on miRNA: mRNA interactions in the severity of thalassemia. Polymorphisms that alter miRNA: mRNA interactions were predicted using PolymiRTS and Mirsnpscore tools. Then, the effect of predicted target SNPs on thermodynamic stability, local RNA structure and regulatory elements was investigated using RNAhybrid, RNAsnp and RegulomeDB, respectively. The molecular functions and the Biological process of candidate genes were extracted and interaction network was created. Forty-six SNPs were predicted to affect 188 miRNA interactions. These results suggest that 3'-UTR SNP may affect gene expression and cause phenotypic variation in thalassemia patients.
Keywords: MicroRNA; polymorphism; thalassemia.
Figures
Similar articles
-
Genetic polymorphism in untranslated regions of PRKCZ influences mRNA structure, stability and binding sites.BMC Cancer. 2024 Sep 13;24(1):1147. doi: 10.1186/s12885-024-12900-8. BMC Cancer. 2024. PMID: 39272077 Free PMC article.
-
Investigation of UTR Variants by Computational Approaches Reveal Their Functional Significance in PRKCI Gene Regulation.Genes (Basel). 2023 Jan 18;14(2):247. doi: 10.3390/genes14020247. Genes (Basel). 2023. PMID: 36833174 Free PMC article.
-
Genetic variations and miRNA-target interactions contribute to natural phenotypic variations in Populus.New Phytol. 2016 Oct;212(1):150-60. doi: 10.1111/nph.14040. Epub 2016 Jun 6. New Phytol. 2016. PMID: 27265357
-
Potential Use of MicroRNA Technology in Thalassemia Therapy.J Clin Med Res. 2024 Sep;16(9):411-422. doi: 10.14740/jocmr5245. Epub 2024 Aug 22. J Clin Med Res. 2024. PMID: 39346566 Free PMC article. Review.
-
Deciphering the vascular labyrinth: role of microRNAs and candidate gene SNPs in brain AVM development - literature review.Neurol Res. 2020 Dec;42(12):1043-1054. doi: 10.1080/01616412.2020.1796380. Epub 2020 Jul 28. Neurol Res. 2020. PMID: 32723034 Review.
Cited by
-
Investigating the Molecular Mechanism of Quercetin Protecting against Podocyte Injury to Attenuate Diabetic Nephropathy through Network Pharmacology, MicroarrayData Analysis, and Molecular Docking.Evid Based Complement Alternat Med. 2022 May 16;2022:7291434. doi: 10.1155/2022/7291434. eCollection 2022. Evid Based Complement Alternat Med. 2022. PMID: 35615688 Free PMC article.
-
Association of Polymorphisms in miRNA Processing Genes With Type 2 Diabetes Mellitus and Its Vascular Complications in a Southern Chinese Population.Front Endocrinol (Lausanne). 2019 Jul 12;10:461. doi: 10.3389/fendo.2019.00461. eCollection 2019. Front Endocrinol (Lausanne). 2019. PMID: 31354628 Free PMC article.
References
LinkOut - more resources
Full Text Sources
Other Literature Sources