Differentially Altered NMDAR Dependent and Independent Long-Term Potentiation in the CA3 Subfield in a Model of Anti-NMDAR Encephalitis
- PMID: 30108497
- PMCID: PMC6079239
- DOI: 10.3389/fnsyn.2018.00026
Differentially Altered NMDAR Dependent and Independent Long-Term Potentiation in the CA3 Subfield in a Model of Anti-NMDAR Encephalitis
Abstract
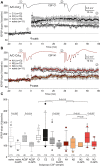
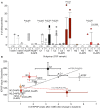
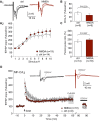
Purpose: Autoantibodies against NMDA receptors (NMDAR) in the cerebrospinal fluid (CSF) from anti-NMDAR encephalitis patients have been suggested to be pathogenic since in previous studies using patient CSF, NMDAR-dependent processes such as long-term potentiation (LTP) were compromised. However, autoantibodies may represent a family of antibodies targeted against different epitopes, and CSF may contain further autoantibodies. Here, we tested the specificity of the autoantibody by comparing NMDAR-dependent and NMDAR-independent LTP within the same hippocampal subfield, CA3, using CSF samples from four anti-NMDAR encephalitis patients and three control patients. Methods: We performed a stereotactic injection of patient-derived cell-free CSF with proven presence or absence of NMDAR-antibodies into the rat hippocampus in vivo. Hippocampal brain slices were prepared 1-8 days after intrahippocampal injection, and NMDAR-dependent LTP at the associational-commissural (A/C) fiber-CA3 synapse was compared to NMDAR-independent LTP at the mossy fiber (MF)-CA3 synapse. Results: The LTP magnitude at A/C fiber-CA3 synapses in slices from control-CSF-treated animals (168 ± 8% n = 54) was significantly higher than LTP in slices from NMDAR-CSF-treated animals (139 ± 9%, n = 40; P = 0.015), although there was some variation between the individual CSF samples. We found residual LTP in NMDAR-CSF-treated tissue which could be abolished by the NMDAR inhibitor D-AP5. Moreover, the CA3 field excitatory postsynaptic potential (fEPSP) was followed by epileptiform afterpotentials in 5% of slices (4/78) from control-CSF-treated animals, but in 26% of slices (12/46) from NMDAR-CSF-treated animals (P = 0.002). Application of the LTP-inducing paradigm increased the proportion of slices with epileptiform afterpotentials, but D-AP5 significantly reduced the occurrence of epileptiform afterpotentials only in NMDAR-CSF-treated, but not in control tissue. At the MF synapse, no significant difference in LTP values of control-CSF and in NMDAR-CSF-treated tissue was observed indicating that NMDAR-independent MF-LTP is intact in NMDAR-CSF-treated tissue. Conclusion: These findings indicate that anti-NMDAR containing CSF impairs LTP at the A/C fiber-CA3 synapse, although there is substantial variation among CSF samples suggesting different epitopes among patient-derived antibodies. The differential inhibition of LTP at this synapse in contrast to the MF-CA3 synapse suggests the specificity and underlines the pathophysiological role of the NMDAR-antibody.
Keywords: LTP; NMDA receptor; associational-commissural fibers; epileptiform afterpotentials; mossy fibers.
Figures


Similar articles
-
GluN2B inhibition rescues impaired potentiation and epileptogenicity at associational-commissural CA3 synapses in a model of anti-NMDAR encephalitis.Neurosci Lett. 2023 Jan 31;795:137031. doi: 10.1016/j.neulet.2022.137031. Epub 2022 Dec 24. Neurosci Lett. 2023. PMID: 36574811
-
Long-Term-But Not Short-Term-Plasticity at the Mossy Fiber-CA3 Pyramidal Cell Synapse in Hippocampus Is Altered in M1/M3 Muscarinic Acetylcholine Receptor Double Knockout Mice.Cells. 2023 Jul 19;12(14):1890. doi: 10.3390/cells12141890. Cells. 2023. PMID: 37508553 Free PMC article.
-
Effects of mineralocorticoid and glucocorticoid receptors on long-term potentiation in the CA3 hippocampal field.Brain Res. 1999 Dec 18;851(1-2):204-14. doi: 10.1016/s0006-8993(99)02188-5. Brain Res. 1999. PMID: 10642845
-
Interactions among paired-pulse facilitation and post-tetanic and long-term potentiation in the mossy fiber-CA3 pathway in rat hippocampus.Synapse. 1996 Aug;23(4):302-11. doi: 10.1002/(SICI)1098-2396(199608)23:4<302::AID-SYN8>3.0.CO;2-B. Synapse. 1996. PMID: 8855515
-
Cognitive enhancers and hippocampal long-term potentiation in vitro.Behav Brain Res. 1997 Feb;83(1-2):45-9. doi: 10.1016/s0166-4328(97)86044-5. Behav Brain Res. 1997. PMID: 9062659 Review.
Cited by
-
N-methyl-D-aspartate receptor hypofunction as a potential contributor to the progression and manifestation of many neurological disorders.Front Mol Neurosci. 2023 Jun 15;16:1174738. doi: 10.3389/fnmol.2023.1174738. eCollection 2023. Front Mol Neurosci. 2023. PMID: 37396784 Free PMC article. Review.
-
Stereotactically Injected Kv1.2 and CASPR2 Antisera Cause Differential Effects on CA1 Synaptic and Cellular Excitability, but Both Enhance the Vulnerability to Pro-epileptic Conditions.Front Synaptic Neurosci. 2020 Mar 25;12:13. doi: 10.3389/fnsyn.2020.00013. eCollection 2020. Front Synaptic Neurosci. 2020. PMID: 32269520 Free PMC article.
-
Single-nucleus RNA sequencing unveils critical regulators in various hippocampal neurons for anti-N-methyl-D-aspartate receptor encephalitis.Brain Pathol. 2023 Jul;33(4):e13156. doi: 10.1111/bpa.13156. Epub 2023 Mar 21. Brain Pathol. 2023. PMID: 36942475 Free PMC article.
-
Antigenic Targets of Patient and Maternal Autoantibodies in Autism Spectrum Disorder.Front Immunol. 2019 Jul 19;10:1474. doi: 10.3389/fimmu.2019.01474. eCollection 2019. Front Immunol. 2019. PMID: 31379804 Free PMC article. Review.
-
Distinct Effects of Stereotactically Injected Human Cerebrospinal Fluid Containing Glutamic Acid Decarboxylase Antibodies into the Hippocampus of Rats on the Development of Spontaneous Epileptic Activity.Brain Sci. 2020 Feb 22;10(2):123. doi: 10.3390/brainsci10020123. Brain Sci. 2020. PMID: 32098388 Free PMC article.
References
LinkOut - more resources
Full Text Sources
Other Literature Sources
Miscellaneous

