. 2018 Jul 31:9:1787.
doi: 10.3389/fimmu.2018.01787. eCollection 2018.

Interleukin-33 Contributes to the Induction of Th9 Cells and Antitumor Efficacy by Dectin-1-Activated Dendritic Cells

Affiliations

Interleukin-33 Contributes to the Induction of Th9 Cells and Antitumor Efficacy by Dectin-1-Activated Dendritic Cells

Jintong Chen et al. Front Immunol. .

Abstract

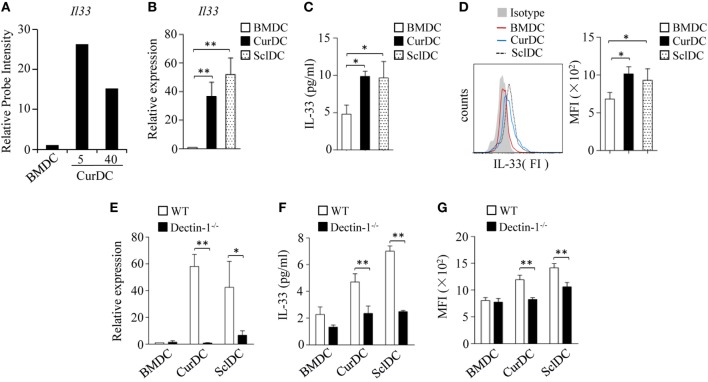
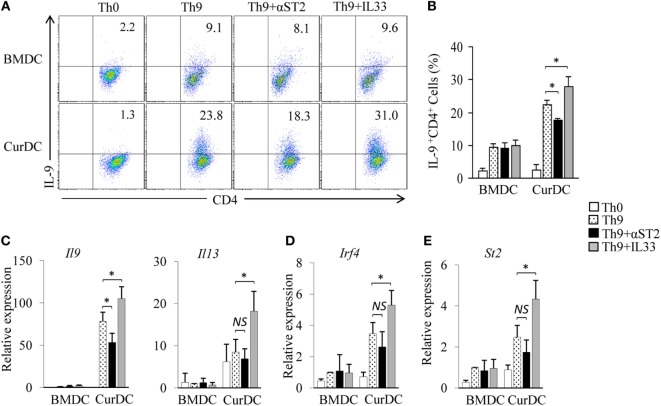
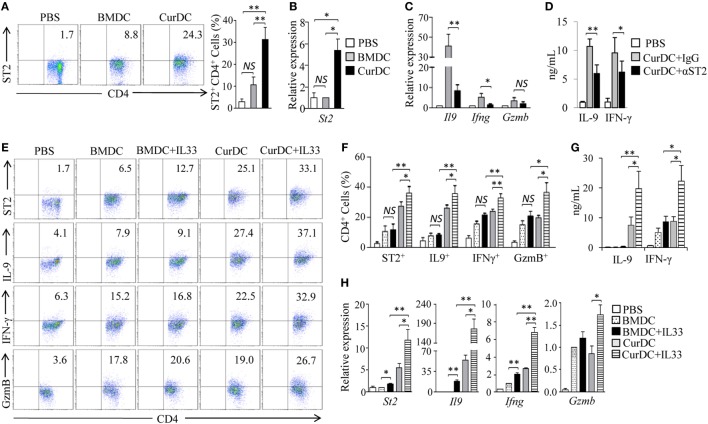
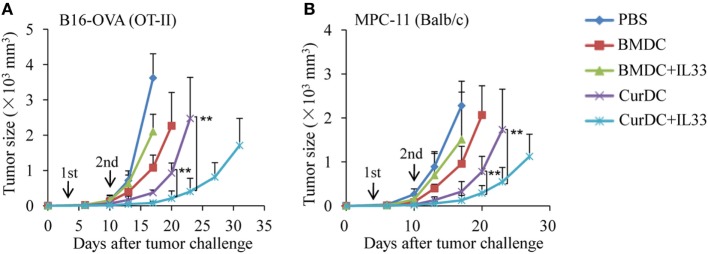
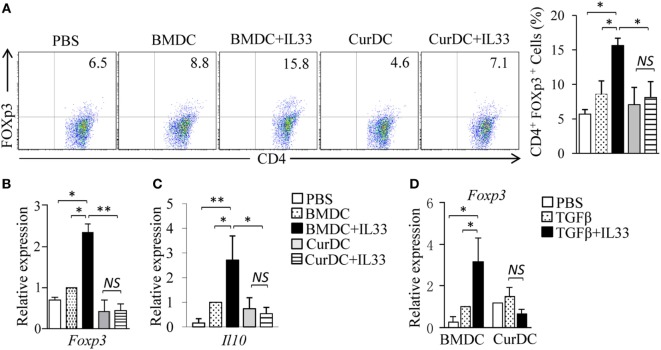
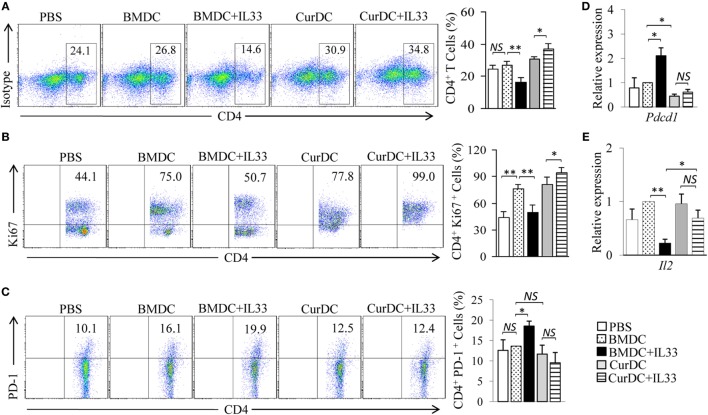
We recently discovered that dectin-1-activated dendritic cells (DCs) drive potent T helper (Th) 9 cell responses and antitumor immunity. However, the underlying mechanisms need to be further defined. The cytokine microenvironment is critical for Th cell differentiation. Here, we show that dectin-1 activation enhances interleukin (IL)-33 expression in DCs. We found that blocking IL-33/ST2 inhibits dectin-1-activated DC-induced Th9 cell differentiation. More importantly, the addition of IL-33 further promotes Th9 cell priming and antitumor efficacy induced by dectin-1-activated DCs. Mechanistically, in addition to the promotion of Th9 and Th1 cells, dectin-1-activated DCs combined with IL-33 abolish the activity of IL-33 in the induction of regulatory T cells. Furthermore, the combined treatment of dectin-1-activated DCs and IL-33 increases the frequencies of CD4+ T cells by fostering their proliferation and inhibiting their exhaustive differentiation. Thus, our results demonstrate the important role of IL-33 in dectin-1-activated DC-induced Th9 cell differentiation and antitumor efficacy, and suggest that the combination of dectin-1-activated DCs and IL-33 may present a new effective modality of DC-based vaccines in tumor immunotherapy.

Keywords: Th9; cancer immunotherapy; dectin-1; dendritic cells; interleukin-33.


Figures

Figure 1
Figure 1
Dectin-1 signaling stimulates interleukin (IL)-33 expression in dendritic cells (DCs). (A) Relative abundance of Il33 mRNA levels in DCs extracted from microarray gene expression data. Mouse DCs matured by TNF-α/IL-1β (BMDC), or Curdlan (CurDC) at doses of 5 and 40 µg/mL for 48 h were analyzed by microarrays. The probe intensity of Il33 in BMDCs was set at 1. (B–D) Mouse immature DCs were matured by TNF-α/IL-1β, Curdlan, or Scleroglucan (SclDC) for 48 h. (B) Quantitative polymerase chain reaction (qPCR) analyzed the mRNA levels of Il33 in DCs. The experiments were performed three times (n = 3). (C) Enzyme-linked immunosorbent assay (ELISA) assessed IL-33 secretion by DCs. The experiments were performed three times (n = 3). (D) Intracellular staining of IL-33 in DCs. Right, summarized results of three independent experiments obtained as the left. MFI, mean fluorescence intensity. The experiments were performed three times (n = 3). (E–G) BMDCs, CurDCs, and SclDCs were generated from wild-type (WT) or dectin-1−/− mice. Same as in (B–D), the mRNA (E) and protein (F,G) levels of IL-33 expressed by DCs were analyzed by qPCR, ELISA, and intracellular staining separately. The experiments were performed three times (n = 3). Results shown are the mean ± SD of three (B–G) independent experiments. *P < 0.05; **P < 0.01.
Figure 2
Figure 2
Interleukin (IL)-33 contributes to dectin-1-activated dendritic cell (DC)-induced Th9 priming. Naïve CD4+ T cells were cocultured with BMDCs or CurDCs under Th9-polarizing conditions with or without addition of an anti-ST2 blocking antibody (αST2) or IL-33. Cell cultures without (Th0) addition of Th9-polarizing cytokines transforming growth factor β and IL-4 were used as controls. Cells were cultured for 3 days. (A) Flow cytometry analysis of IL-9-expressing CD4+ T cells. Numbers in the dot plots represent the percentages of IL-9+CD4+ T cells. (B) Summarized results of three independent experiments obtained in (A). The experiments were performed three times (n = 3). Quantitative polymerase chain reaction analysis of Il9 and Il13 (C), Irf4 (D), and St2 (E) in T cells. Expression was normalized to Gapdh and set at 1 in BMDC-induced Th9 cells. The experiments were performed three times (n = 3). Data are representative of three (A) independent experiments or presented as mean ± SD of three (B–E) independent experiments. NS, non-significant; *P < 0.05.
Figure 3
Figure 3
Interleukin (IL)-33/ST2 axis contributes to dectin-1-activated dendritic cell (DC)-induced Th9 priming in vivo. (A,B) OT-II mice (two to three mice/group) were immunized twice (1 week apart) with OVA-peptide-pulsed BMDCs or CurDCs. PBS served as a control. On day 3 after the second immunization, spleen cells were harvested and restimulated separately with OVA-peptide-pulsed BMDCs and CurDCs for 2 days in the culture. (A) Flow cytometry of ST2-expressing CD4+ T cells. Numbers in the dot plots represent the percentages of ST2+CD4+ T cells. Right, summarized results of three independent experiments obtained as at left. The experiments were performed three times (n = 3). (B) Quantitative polymerase chain reaction (qPCR) analysis of St2 in CD4+ T cells. The experiments were performed three times (n = 3). (C,D) OT-II mice (two to three mice/group) were immunized twice (1 week apart) with OVA-peptide-pulsed CurDCs in the presence of control IgG or αST2. PBS served as a control. On day 3 after the second immunization, spleen cells were restimulated separately with OVA-peptide-pulsed CurDCs plus IgG or αST2 for 48 h. (C) qPCR analyses of Il9, Ifng, and Gzmb in CD4+ T cells. The experiments were performed three times (n = 3). (D) Enzyme-linked immunosorbent assay (ELISA) assessed IL-9 and IFN-γ in the cultures. The experiments were performed three times (n = 3). (E–H) OT-II mice (two to three mice/group) were immunized twice (1 week apart) with OVA-peptide-pulsed BMDCs or CurDCs. In addition, some of the mice immunized with BMDCs or CurDCs were given IL-33 (250 ng/mouse) every 3 days, beginning on the day of the first immunization. Mice received PBS served as controls. Mouse spleen cells were restimulated with BMDCs or CurDCs in the presence or absence of IL-33 (50 ng/mL) for 2 days in the culture. (E) Flow cytometry of ST2-, IFN-γ-, IL-9-, or GzmB-producing CD4+ T cells. Numbers in the dot plots represent the percentages of double-positive T helper cells. (F) Summarized results of three independent experiments obtained in (A). The experiments were performed three times (n = 3). (G) ELISA assays of IL-9 and IFN-γ in the culture. The experiments were performed three times (n = 3). (H) qPCR analyses of St2, Il9, Ifng, and Gzmb in CD4+ T cells. The experiments were performed three times (n = 3). Data are representative of three (A,E) independent experiments or presented as mean ± SD of three (A–D,F–H) independent experiments. NS, non-significant; *P < 0.05; **P < 0.01.
Figure 4
Figure 4
Interleukin (IL)-33 promotes dectin-1-activated dendritic cell (DC)-induced antitumor efficacy in vivo. (A) OT-II mice were injected subcutaneously with 1 × 105 B16-OVA cells. On day 3 after tumor challenge, mice (five mice/group) were given two weekly subcutaneously immunizations with 1 × 106 OVA-peptide-pulsed BMDCs or CurDCs. In addition, some of the mice immunized with BMDCs or CurDCs were given IL-33 (250 ng/mouse) every 3 days, beginning on the day of the first immunization. Mice received PBS served as controls. Shown are the tumor growth curves. The experiments were performed twice with a total of 10 mice per group (n = 10). (B) Balb/c mice were injected subcutaneously with 1 × 106 MPC-11 cells. On day 3 after tumor challenge, mice (five mice/group) were given two weekly subcutaneously immunizations with 1 × 106 tumor cell lysate-pulsed BMDCs or CurDCs. Some mice were given IL-33 every 3 days, beginning on the day of the first immunization. Mice that received PBS served as controls. Shown are the tumor growth curves. The experiments were performed twice with a total of 10 mice per group (n = 10). Results shown are the mean ± SD of two combined experiments. **P < 0.01.
Figure 5
Figure 5
The role of interleukin (IL)-33 in dendritic cell (DC)-induced regulatory T (Treg) differentiation. (A–C) OT-II mice (two to three mice/group) were immunized twice (1 week apart) with OVA-peptide-pulsed BMDCs or CurDCs. In addition, some of the mice immunized with BMDCs or CurDCs were given IL-33 (250 ng/mouse) every 3 days, beginning on the day of the first immunization. Mice received PBS served as controls. Mouse spleen cells were restimulated with BMDCs or CurDCs in the presence or absence of IL-33 (50 ng/mL) for 2 days in the culture. (A) Flow cytometry analysis of Foxp3+CD4+ T cells. Right, summarized results of three independent experiments obtained as at left. The experiments were performed three times (n = 3). (B,C) Quantitative polymerase chain reaction (qPCR) examined the expression of Foxp3 (B) and Il10 (C) in CD4+ T cells. The experiments were performed three times (n = 3). (D) Naïve CD4+ T cells were cocultured with BMDCs or CurDCs under Treg [transforming growth factor β (TGFβ)] polarizing conditions in the presence (TGFβ + IL33) or absence of IL-33. qPCR examined the expression of Foxp3 in CD4+ T cells. The experiments were performed three times (n = 3). Data are representative of three (A) independent experiments or presented as mean ± SD of three (A–D) independent experiments. NS, non-significant; *P < 0.05; **P < 0.01.
Figure 6
Figure 6
Interleukin (IL)-33 maintains the cell proliferation capability of dectin-1-activated dendritic cell (DC)-primed T helper cells in vivo. OT-II mice (two to three mice/group) were immunized twice (1 week apart) with OVA-peptide-pulsed BMDCs or CurDCs. In addition, some of the mice immunized with BMDCs or CurDCs were given IL-33 (250 ng/mouse) every 3 days, beginning on the day of the first immunization. Mice received PBS served as controls. Mouse spleen cells were restimulated with BMDCs or CurDCs in the presence or absence of IL-33 (50 ng/mL) for 2 days in the culture. (A) Flow cytometry analysis of CD4+ T cells in mouse spleen cells. Right, summarized results of three independent experiments obtained as at left. The experiments were performed three times (n = 3). (B) Flow cytometry analysis of Ki67+CD4+ T cells. Right, summarized results of three independent experiments obtained as at left. The experiments were performed three times (n = 3). (C) Flow cytometry analysis of PD-1+CD4+ T cells. Right, summarized results of three independent experiments obtained as at left. The experiments were performed three times (n = 3). (D,E) CD4+ T cells were isolated by the magnetic cell sorting. Quantitative polymerase chain reaction examined the expression of Pdcd1 (D) and Il2 (E) in CD4+ T cells. The experiments were performed three times (n = 3). Data are presented as mean ± SD of three (D,E) independent experiments. NS, non-significant; *P < 0.05; **P < 0.01.

Similar articles

Cited by

References

    1. Anguille S, Smits EL, Lion E, van Tendeloo VF, Berneman ZN. Clinical use of dendritic cells for cancer therapy. Lancet Oncol (2014) 15:e257–67.10.1016/S1470-2045(13)70585-0 - DOI - PubMed
    1. Bol KF, Schreibelt G, Gerritsen WR, de Vries IJ, Figdor CG. Dendritic cell-based immunotherapy: state of the art and beyond. Clin Cancer Res (2016) 22:1897–906.10.1158/1078-0432.CCR-15-1399 - DOI - PubMed
    1. Timmerman JM, Levy R. Dendritic cell vaccines for cancer immunotherapy. Annu Rev Med (1999) 50:507–29.10.1146/annurev.med.50.1.507 - DOI - PubMed
    1. Palucka K, Banchereau J. Cancer immunotherapy via dendritic cells. Nat Rev Cancer (2012) 12:265–77.10.1038/nrc3258 - DOI - PMC - PubMed
    1. Zhu J, Yamane H, Paul WE. Differentiation of effector CD4 T cell populations (*). Annu Rev Immunol (2010) 28:445–89.10.1146/annurev-immunol-030409-101212 - DOI - PMC - PubMed

Publication types

MeSH terms

LinkOut - more resources