. 2017 Oct 31;8(12):2181-2194.
doi: 10.1039/c7md00486a. eCollection 2017 Dec 1.

Novel T-C@AgNPs mediated biocidal mechanism against biofilm associated methicillin-resistant Staphylococcus aureus (Bap-MRSA) 090, cytotoxicity and its molecular docking studies

Affiliations

Novel T-C@AgNPs mediated biocidal mechanism against biofilm associated methicillin-resistant Staphylococcus aureus (Bap-MRSA) 090, cytotoxicity and its molecular docking studies

H M Manukumar et al. Medchemcomm. .

Abstract

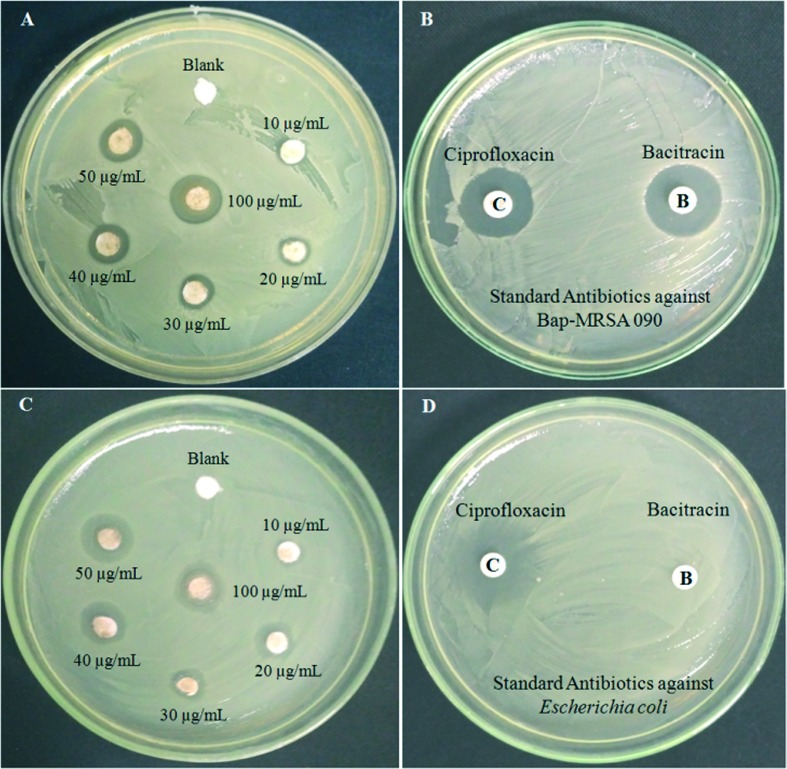
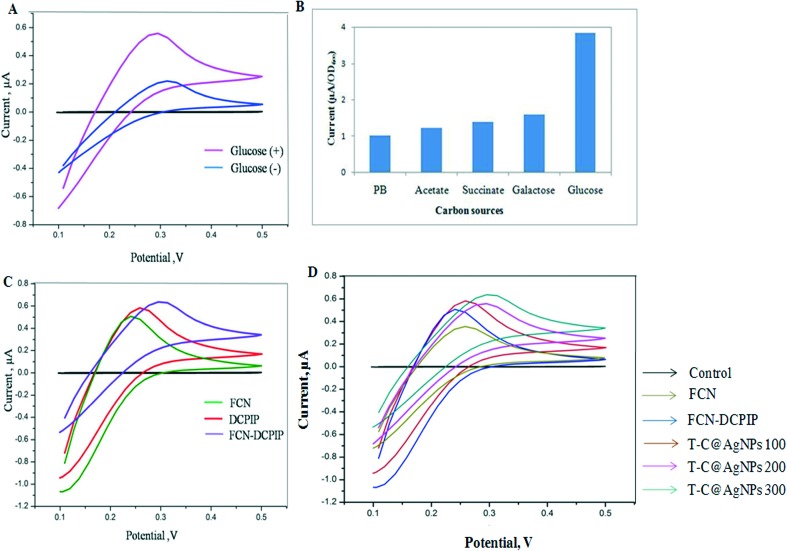
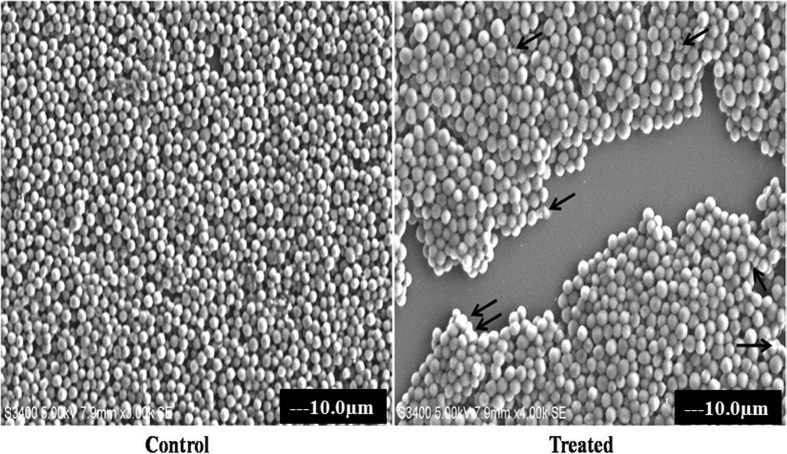
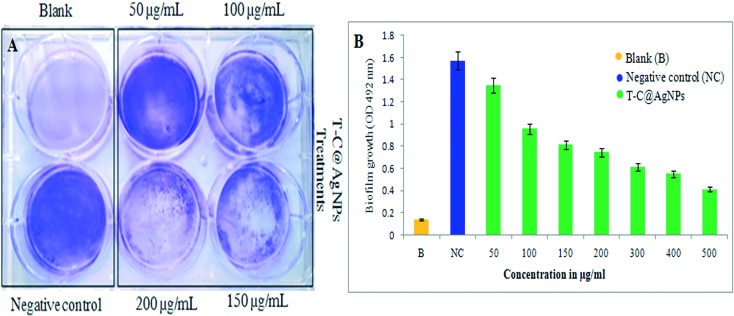
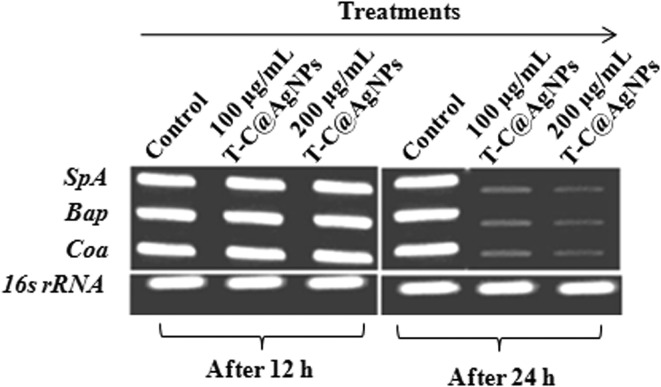
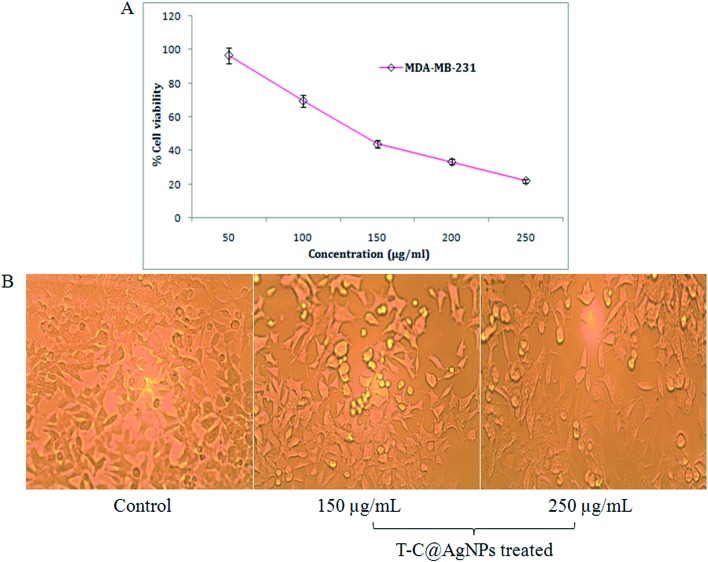
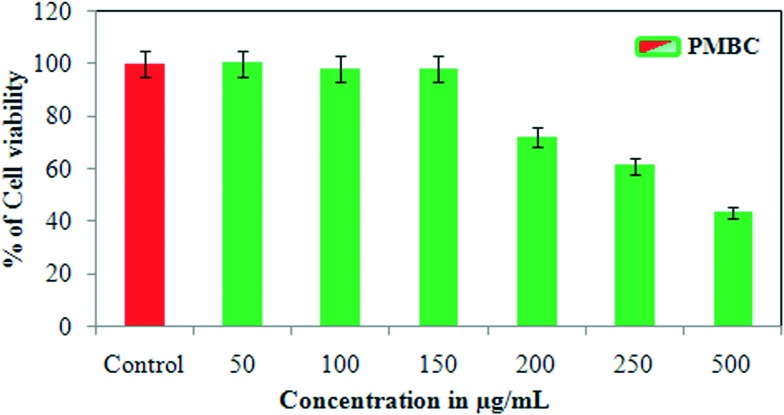
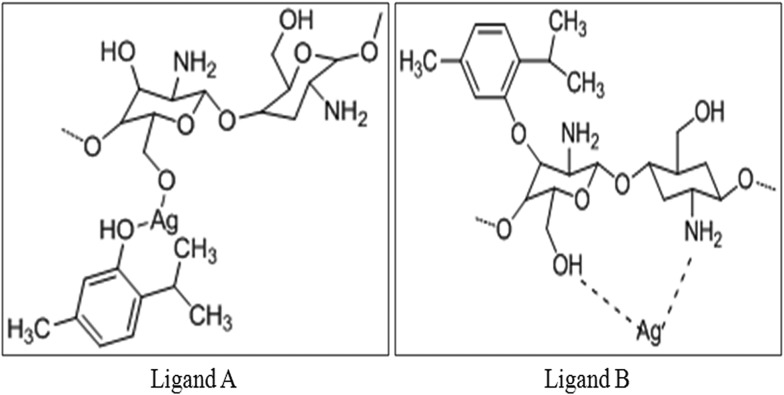
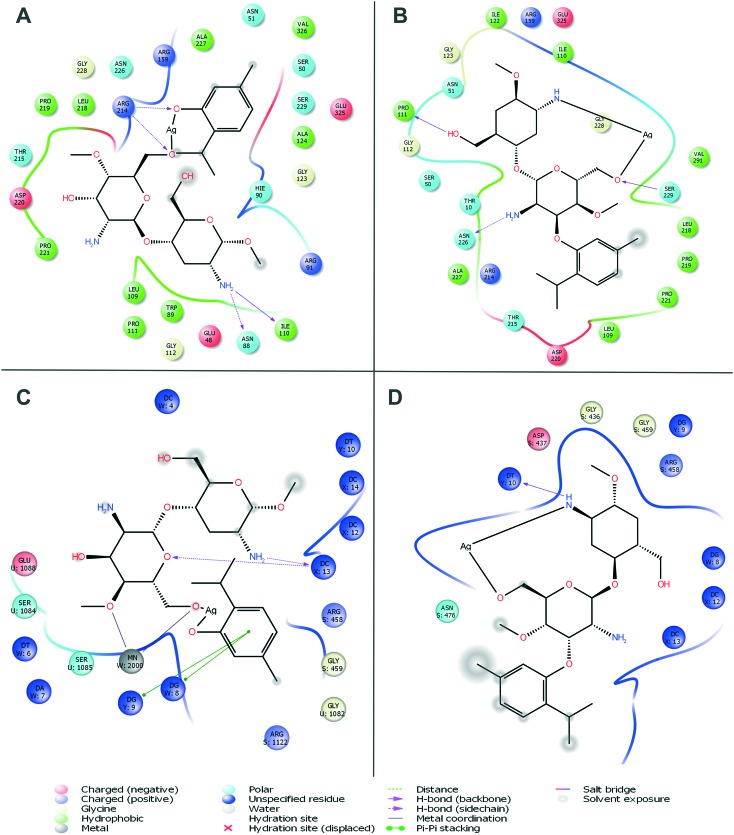
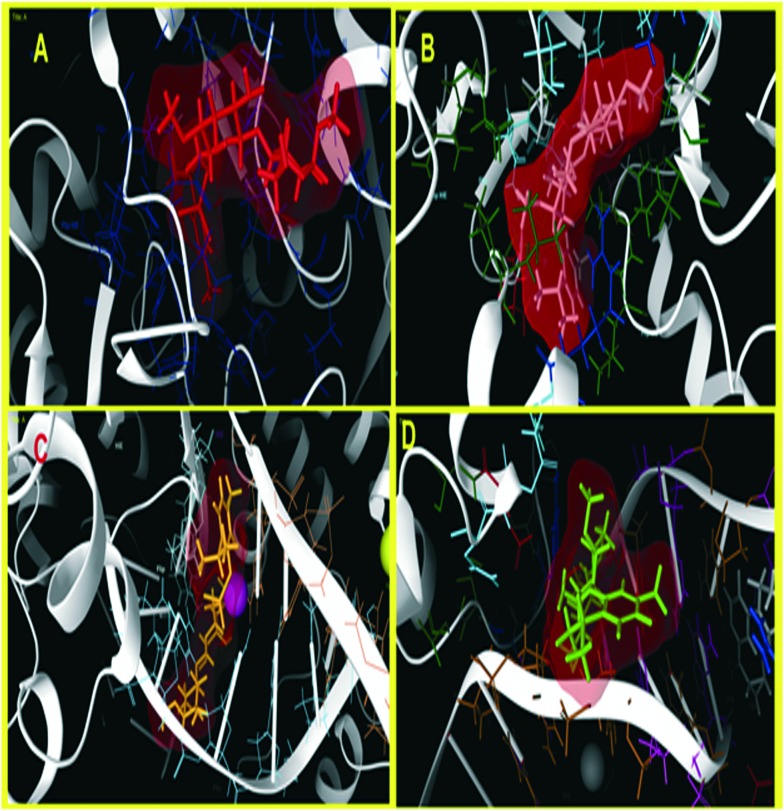
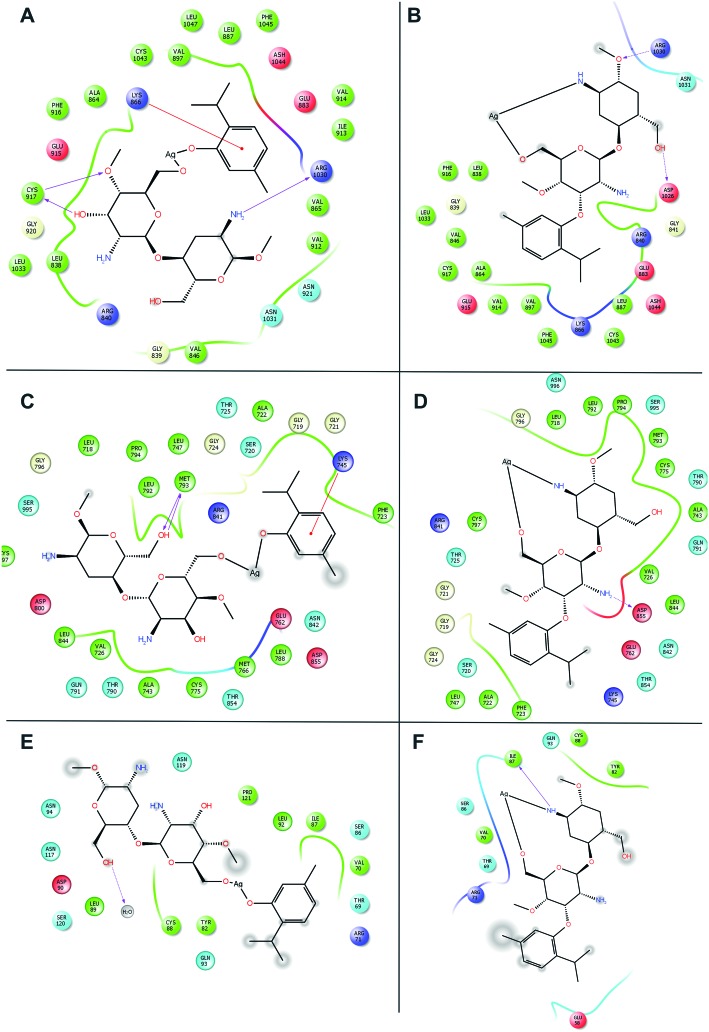
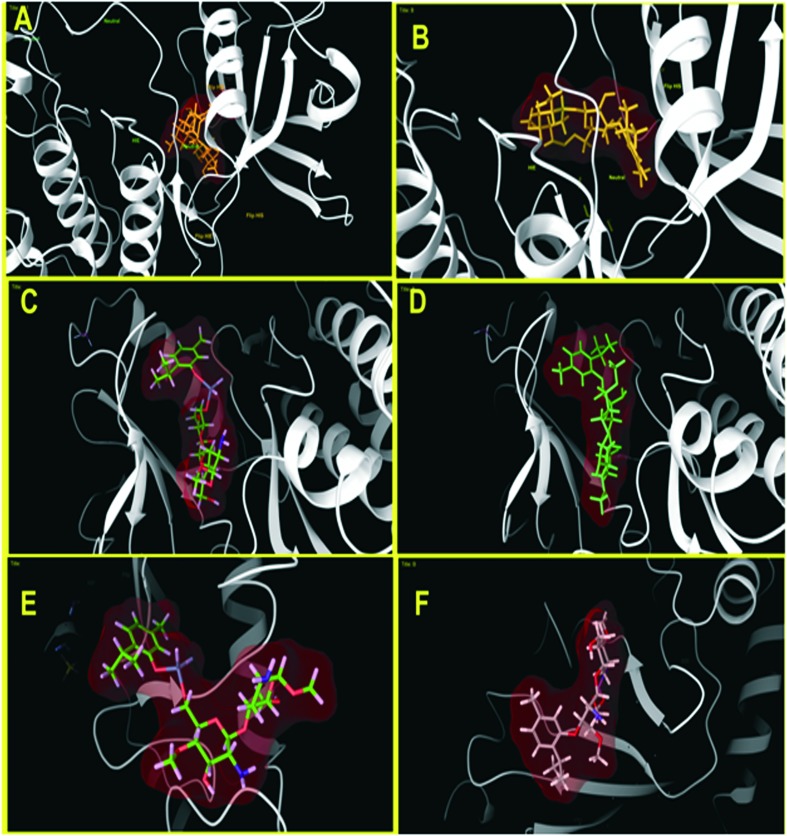
Staphylococcus aureus is a commonly found pathogen that can cause food-spoilage and life threatening infections. However, the potential molecular effects of natural active thymol molecules and chitosan silver nanoparticles (C@AgNPs) in bacteria remain unclear. This gap in the literature has prompted us to study the effects of thymol loaded chitosan silver nanoparticles (T-C@AgNPs) against biofilm associated proteins in methicillin-resistant S. aureus (Bap-MRSA) 090 and also their toxicity, anti-cancer activity, and validation of their in silico molecular docking. The results showed excellent antibacterial activity of T-C@AgNPs against Bap-MRSA 090, having a minimum inhibitory concentration of 100 μg mL-1 and a 10.08 ± 0.06 mm zone of inhibition (ZOI). The cyclic voltammogram (CV) analysis clearly showed pore forming of T-C@AgNPs at 300 μg mL-1 concentration, and evidence of the interruption of the electron transport chain was clearly seen. The 200 μg mL-1 concentration exhibited a 52.60 ± 0.25% anti-biofilm property by T-C@AgNPs against Bap-MRSA 090. The T-C@AgNPs showed no toxicity to peripheral blood mononuclear cells (PBMC) (IC50 = 221 ± 0.71 μg mL-1) compared to the control, and anti-cancer activity against human triple negative breast cancer cell line (MDA-MB-231) (IC50 110 ± 1.0 μg mL-1) compared to the standard drug Doxorubicin (IC50 = 19 ± 1.0). The excellent properties of T-C@AgNPs were validated by in silico molecular docking studies and showed best match scoring to target proteins compared to standards. These excellent properties of T-C@AgNPs highlight for the first time its pharmacology and potential in medicinal drug development applications for future research.


Figures

Fig. 1
Fig. 1. The SEM image of T-C@AgNPs. The T-C@AgNPs were synthesized and analyzed to determine the shape of NPs by SEM. The T-C@AgNPs were spherical in shape and monodispersive in nature in a colloidal state.
Fig. 2
Fig. 2. Antimicrobial activity of T-CAgNPs against Bap-MRSA 090 and E. coli. The Bap-MRSA 090 evaluated for biocidal activity by T-CAgNPs is shown in a dose-dependent manner (10 to 100 μg mL–1) compared to antibiotics ciprofloxcin and bacitracin. The minimum inhibitory concentration (MIC) 100 μg mL–1 of T-C@AgNPs was 10.08 ± 0.06 mm against Bap-MRSA 090 along with standard ciprofloxcin (10.95 ± 0.08) and bacitracin (9.12 ± 0.13) as an antibiotic, respectively (A and B). The T-C@AgNPs showed excellent activity to E. coli at MIC and had 9.16 ± 0.06 mm compared to ciprofloxcin (10 μg = 11.18 ± 0.04 mm) and E. coli resistant to bacitracin can be observed clearly in figure C and D. Whereas blank water served as a negative control depicted in the picture (A and C).
Fig. 3
Fig. 3. Cyclic voltammogram (CV) analysis. The CV of cell suspension of Bap-MRSA 090 in FCN in the absence (–) and presence (+) of glucose (10 g L–1) (A) Bap-MRSA 090 response to different carbon sources; (B) and CV studied at 1 mM FCN, 40 μM DCPIP and combination in PB at pH 7.0; (C) and the effect of T-C@AgNPs at 100, 200 and 300 μg mL–1 concentration in presence of FCN affecting the Bap-MRSA 090 CV was represented. (D) All CV measurements were conducted after incubation of Bap-MRSA 090 suspension (0.5 OD at A600 nm).
Fig. 4
Fig. 4. The membrane damaging effect of T-C@AgNPs. The MIC of T-C@AgNPs treated with Bap-MRSA 090 showed alterations in the cell membrane and shrinkage, clumping of the damaged cells was observed shown by the arrow in the treated compared to control.
Fig. 5
Fig. 5. The qualitative and quantitative determination of effect of T-C@AgNPs on S. aureus biofilm. Bap-MRSA 090 treated with different concentrations (50–500 μg mL–1) of T-C@AgNPs for 24 h compared to blank and negative control in the experiment, then using the crystal violet method. The reading was measured at 492 nm to understand the role in biofilm development. The inhibition by T-C@AgNPs is shown at 200 μg mL–1 concentrations for the inhibition of Bap-MRSA 090 biofilm effectively (A) and a dose dependent decrease of biofilm formation by Bap-MRSA 090 was observed quantitatively (B).
Fig. 6
Fig. 6. Effect of T-C@AgNPs in regulation of clotting responsible coagulase (Coa), biofilm associated protein (Bap) and surface Ig binding protein (SpA) genes. The gene regulation of Bap-MRSA 090 was carried out at 50 to 300 μg mL–1 concentrations. The T-C@AgNPs treatment against Bap-MRSA 090 gene regulation at 24 h for 200 μg mL–1 concentration exhibited a profound action against Bap-MRSA 090 gene regulation and was seen by relative expression of genes (Coa, Bap and SpA) compared to the housekeeping 16S rRNA gene. This indicates the T-C@AgNPs exactly matches the MIC.
Fig. 7
Fig. 7. Anti-cancer analysis of T-C@AgNPs. (A) The MDA-MB-231 cell line was treated with different concentrations of T-C@AgNPs (50, 100, 150, 200, and 250 μg mL–1). The cell viability was measured using the MTT method and reported at concentration 110 ± 1.0 μg mL–1, which is the IC50 against the MDA-MB-231 cell line and concluded that the T-C@AgNPs had anti-cancer activity compared to the standard drug Doxorubicin (IC50 = 19 ± 1.0 μg mL–1). (B) The MDA-MB-231 cell line morphology after treatment of T-C@AgNPs at 150 and 250 μg mL–1 concentrations, compared to control.
Fig. 8
Fig. 8. Cytotoxicity analysis of T-C@AgNPs. The PBMC cell was treated with different concentrations of T-C@AgNPs (50, 100, 150, 200, 250, and 500 μg mL–1). The cell viability was measured using the MTT method and reported at concentration 221 ± 0.71 μg mL–1, which is the IC50 against PBMC cell and concluded that the T-C@AgNPs had no toxicity to the PBMC normal cells up to 221 μg mL–1 concentrations.
Fig. 9
Fig. 9. The proposed structural arrangement of T-C@AgNPs in two different configurations by sharing functional groups.
Fig. 10
Fig. 10. Molecular docking interactive maps of ligand A (A) and ligand B (B) against oxidoreductase from Escherichia coli. Whereas with DNA Gyrase, ligand A (C) and ligand B (D) show a best pose residing at the active site wherein the DNA gyrase is binding with DNA.
Fig. 11
Fig. 11. Three dimensional molecular interaction of ligand A (A) and ligand B (B) against oxidoreductase from E. coli, whereas with DNA Gyrase, ligand A (C) and ligand B (D) show a best pose residing at the active site, wherein the DNA gyrase is binding with DNA (ligands are represented in an enclosed surface displayed as red in color).
Fig. 12
Fig. 12. Molecular docking interactive maps of ligand A (A) and ligand B (B) against VEGFR2. Whereas with EGFR kinase, ligand A (C) and ligand B (D) show best pose. While with Rad18, ligand A (E) and ligand B (F) form a better orientation with the Rab18 active site.
Fig. 13
Fig. 13. Three dimensional molecular interaction of ligand A (A) and ligand B (B) against VEGFR2. Whereas with EGFR kinase, ligand A (C) and ligand B (D) show best pose. While with Rad18, ligand A (E) and ligand B (F) form a better orientation with the Rab18 active site (ligands are represented in an enclosed surface displayed as red in color).

References

    1. Manukumar H. M., Umesha S., Kumar H. N. Int. J. Biol. Macromol. 2017;102:1257–1265. - PubMed
    1. Sharma D., Kanchi S., Bisetty K. Arabian J. Chem. 2015 doi: 10.1016/j.arabjc.2015.11.002. - DOI
    1. Ramezani Ali Akbari K., Abdi Ali A. Nanomed. J. 2017;4(1):37–43.
    1. Shi S. F., Jia J. F., Guo X. K., Zhao Y. P., Chen D. S., Guo Y. Y., Zhang X. L. Int. J. Nanomed. 2017;11:6499–6506. - PMC - PubMed
    1. Jian W., Zhang L., Siu K. C., Song A., Wu J. Y. Molecules. 2016;22(1):50–62. - PMC - PubMed

LinkOut - more resources