. 2018 Aug 9:4:24.
doi: 10.1038/s41420-018-0086-x. eCollection 2018.

Increased glutamine anabolism sensitizes non-small cell lung cancer to gefitinib treatment

Affiliations

Increased glutamine anabolism sensitizes non-small cell lung cancer to gefitinib treatment

Liang Wang et al. Cell Death Discov. .

Erratum in

Abstract

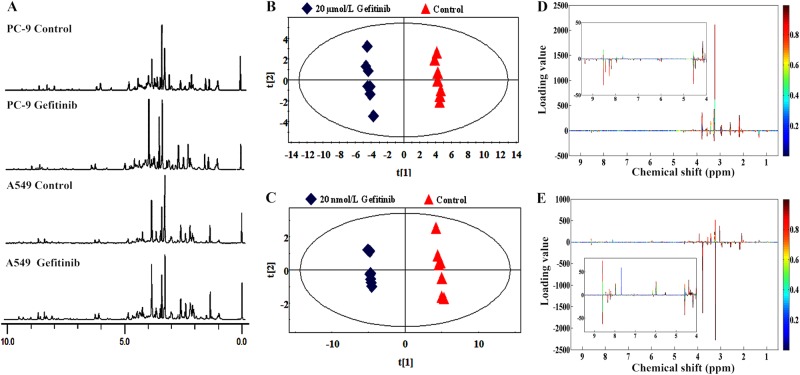
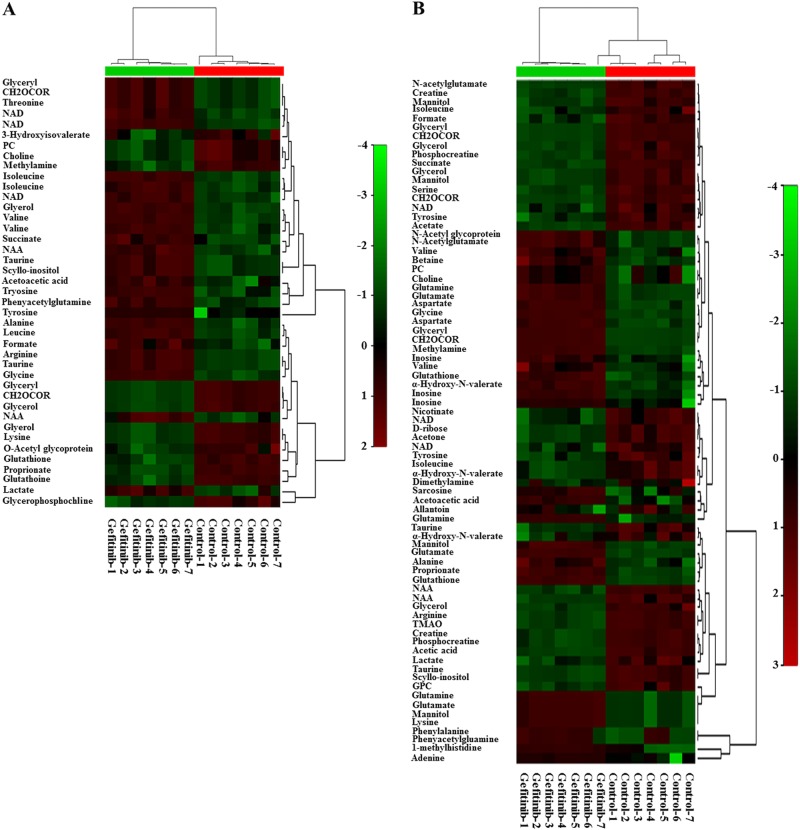
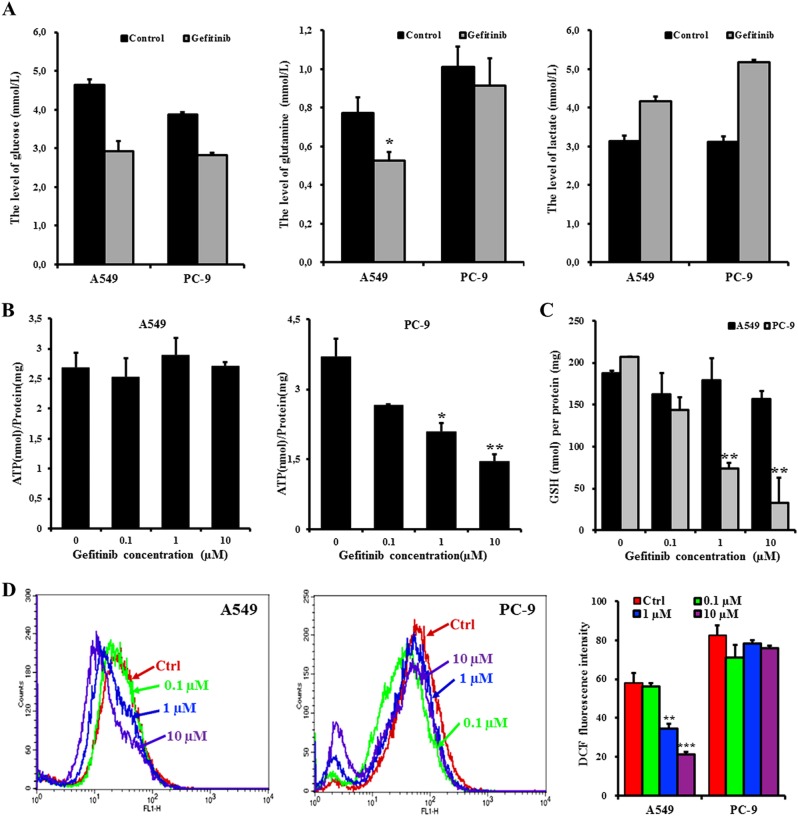
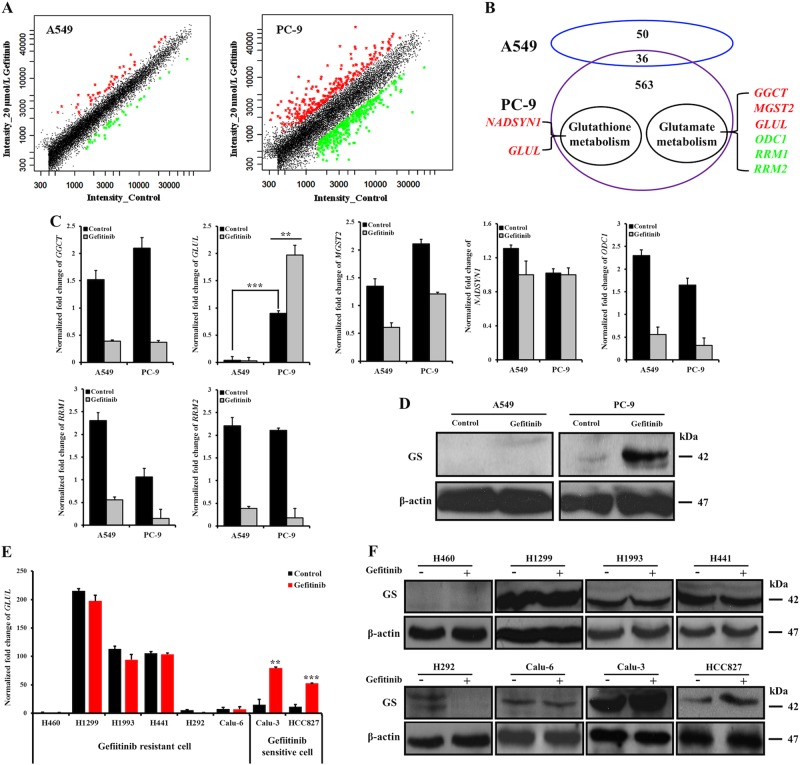
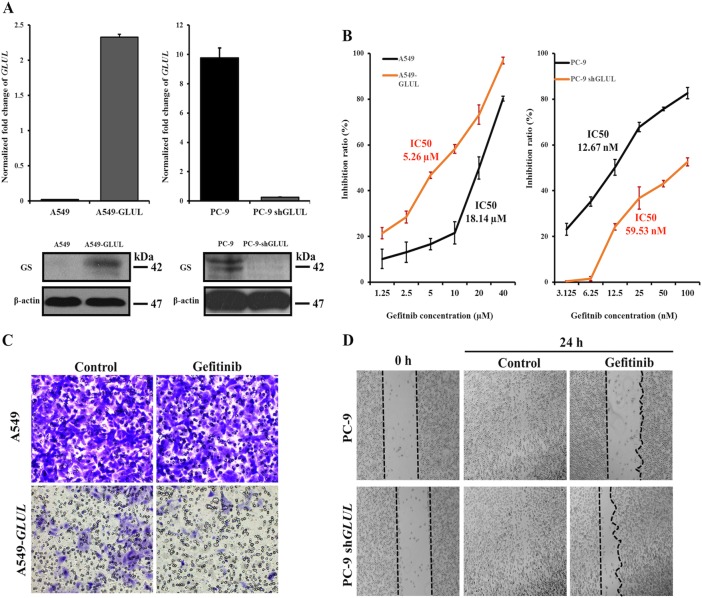
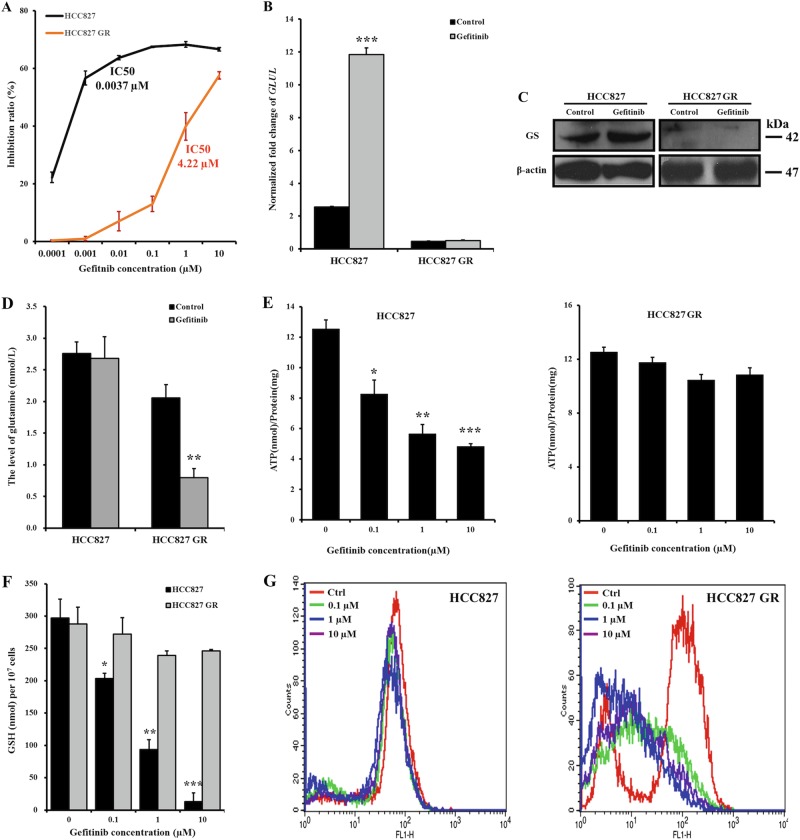
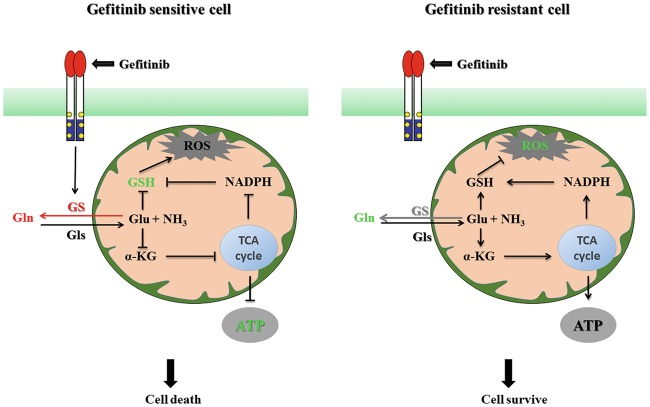
To better understand the resistance mechanism of non-small cell lung cancers (NSCLCs) to gefitinib, the metabolic profiles of gefitinib-resistant A549 cells and gefitinib-sensitive PC-9 cells were analyzed with a metabolomics analytical platform. A549 and PC-9 cells exhibited significant differences in the levels of glutamine-related metabolites. After gefitinib treatment, the glutamine level decreased in A549 cells but showed no change in PC-9 cells. The glutamine consumed by A549 cells was used to generate ATP and glutathione (GSH). As glutamine utilization was suppressed in gefitinib-treated PC-9 cells, the resulting ATP shortage and ROS accumulation led to cell death. The difference in glutamine metabolism was caused by differential changes in the levels of glutamine synthetase (GS, encoded by glutamate-ammonia ligase (GLUL)). GLUL expression was upregulated in gefitinib-sensitive cells, but it was either absent from gefitinib-resistant cells or no significant change was observed in the gefitinib-treated cells. GLUL overexpression in A549 cells significant sensitized them to gefitinib and decreased their invasive capacity. Conversely, knockout GS in PC-9 cells reduced gefitinib sensitivity and enhanced metastasis. Furthermore, the continuous exposure of gefitinib-sensitive HCC827 cells to gefitinib created gefitinib-resistant (GR) HCC827 cells, which exhibited a GLUL deletion and resistance to gefitinib. Thus, GLUL plays a vital role in determining the sensitivity of NSCLCs to gefitinib. Elevated GS levels mediate increased glutamine anabolism, and this novel mechanism sensitizes NSCLCs to gefitinib. The inhibition of glutamine utilization may serve as a potential therapeutic strategy to overcome gefitinib resistance in the clinic.


Conflict of interest statement

The authors declare that they have no conflict of interest.

Figures

Fig. 1
Fig. 1. Gefitinib treatment induces differences in the metabolic profiles of PC-9 and A549 cells.
a Representative 1H-NMR spectra (δ0.0–δ10.0) of PC-9 and A549 cells after a 24-h incubation with or without 20 µM and 20 nM gefitinib, respectively. b, c PCA score plots of PC1 versus PC2. The untreated A549 cells (b) and PC-9 cells (c) are shown as red triangles, and gefitinib-treated samples are shown as blue diamonds. Each group contains seven replicates. d, e The color map separately shows the significant variations in the chemical shifts of A549 cells (d) and PC-9 cells (e). Peaks in the positive direction represent enhanced chemical shifts in the gefitinib-treated group compared to the corresponding untreated group. Decreased chemical shifts in the gefitinib-treated group are presented as peaks in the negative direction
Fig. 2
Fig. 2. Comparative metabolomics indicates that glutamine-related metabolism affects the sensitivity of NSCLCs to gefitinib.
a, b Heat map representation of a 2D hierarchical clustering of metabolites identified as differentially changed in A549 cells (a) and PC-9 cells (b) after treatment with gefitinib compared to control cells. Each column represents a treatment group, and each row represents a metabolite
Fig. 3
Fig. 3. The inhibition of glutamine utilization in PC-9 cells reduces ATP and GSH generation, which induces cell death in response to gefitinib. However, A549 cells utilize glutamine to survive the gefitinib treatment.
a Levels of glucose, glutamine, and lactate in A549 and PC-9 cells after a 24-h treatment with or without 20 µM and 20 nM gefitinib, respectively. bd After A549 and PC-9 cells were exposed to 0, 0.1, 1, and 10 µM gefitinib for 72 h, the intracellular ATP (b), GSH (c), and ROS levels (d) were measured using the ATP determination kit, the GSH-Glo glutathione assay kit, and the DCFH-DA reagent, respectively. The total ATP and GSH levels were normalized to the total protein concentration that was used for ATP and GSH assays. The histogram shows the mean fluorescent intensity of DCF in the control and gefitinib-treated groups. The data represent the mean ± SEM of three independent experiments. *p< 0.05; **p< 0.01; ***p< 0.001, two-tailed Student’s t-test
Fig. 4
Fig. 4. GLUL and GS levels were upregulated in gefitinib-sensitive cells in response to the gefitinib treatment. Gefitinib-resistant cells lack GLUL expression or exhibit no significant changes following the gefitinib treatment.
a After separately exposing A549 and PC-9 cells to 20 µM and 20 nM gefitinib, respectively, for 48 h, DNA microarray scatter plots were prepared to reveal the expression of activation-induced genes in gefitinib-treated cells compared with that in the corresponding control cells. Each point represents a gene; the red points indicate genes that significantly upregulated in gefitinib-treated cells (ratio ≥ 2-fold, p< 0.05), whereas the green points indicate genes that were significantly downregulated (ratio ≤ 0.5-fold, p< 0.05) in response to the gefitinib treatment. The black points represent genes for which the signal intensity ratio was between 0.5 and 2, indicating that gefitinib treatment had no obvious effect on these genes. b A scheme displays the relationships between the differentially expressed genes in A549 and PC-9 cells. The genes related to glutamine metabolism are listed. The red- and green-colored genes represent increased and decreased gene expression, respectively, in gefitinib-treated cells. c Changes in the mRNA expression levels of seven important genes (GGCT, GLUL, MGST2, NADSYN1, ODC1, RRM1, and RRM2) in A549 and PC-9 cells in response to the 48-h gefitinib treatment are shown. The data represent the mean ± SEM of three independent experiments. *p < 0.05; **p < 0.01; ***p < 0.001, two-tailed Student’s t-test. d Western blot detection of the levels of the GS protein in A549 and PC-9 cells after treatment with 20 µM and 20 nM gefitinib, respectively, for 48 h. e, f Changes in GLUL mRNA expression levels were quantified by qRT-PCR (e), and the GS protein levels were examined by western blotting (f) in cells treated with gefitinib for 48 h and the corresponding control cells. The bars shown are normalized to the GAPDH control and represent the mean ± SD of triplicate samples
Fig. 5
Fig. 5. Expression of GLUL in A549 cells sensitizes them to the gefitinib treatment and decreases cell motility, whereas the loss of GLUL expression in PC-9 cells increases resistance to gefitinib treatment and increases cell motility.
a qRT-PCR and western blotting were used to assess the GLUL mRNA level and the GS protein level, respectively, to identify the GLUL knock-in efficacy in A549 cells and the GLUL knockout efficacy in PC-9 cells. The bars shown are normalized to the GAPDH control and represent the mean ± SD of triplicate samples. b MTT assays detected the cell growth inhibition ratios following the gefitinib treatment in GLUL-expressing A549 cells and GLUL knockout PC-9 cells. c Based on the transwell assay, significantly fewer A549-GLUL cells invaded the membrane than A549 cells, and the 24-h gefitinib treatment further suppressed the invasion of A549-GLUL cells. In contrast to A549-GLUL cells, the gefitinib treatment did not inhibit the invasion of A549 cells. d Scratch wound-healing assays showed that the knockout of GLUL in PC-9 cells resulted in a decrease of the ability of cells to close a wound after the 24-h treatment with gefitinib
Fig. 6
Fig. 6. Decreased GS expression in HCC827 cells is associated with acquired resistance to gefitinib.
a According to the MTT assays, HCC827 GR cells became resistant to gefitinib after chronic and repeated exposure to increasing doses of gefitinib compared to HCC827 cells, which were sensitive to gefitinib. b, c Changes in GLUL mRNA expression levels were quantified by qRT-PCR (b), and GS protein levels were examined by western blotting (c) to compare the levels between HCC827 and HCC827 GR cells after exposure to the gefitinib or control treatment for 48 h. The bars shown are normalized to the GAPDH control and represent the mean ± SD of triplicate samples. d Glutamine levels in HCC827 and HCC827 GR cells were assessed after a 24-h exposure to 5 µM and 5 nM gefitinib, respectively. eg After exposing HCC827 and HCC827 GR cells to 0, 0.1, 1, and 10 µM gefitinib for 72 h, the intracellular ATP (e), GSH (f), and ROS levels (g) were measured using the ATP determination kit, the GSH-Glo glutathione assay kit, and the DCFH-DA reagent, respectively. The gefitinib treatment significantly reduced the normalized ATP and GSH levels in HCC827 cells in a dose-dependent manner. Compared to the stable ROS level in HCC827 cells, the total ROS level in HCC827 GR cells was reduced, indicating scavenging. The data represent the mean ± SEM of three independent experiments. *p < 0.05; **p < 0.01; ***p < 0.001, two-tailed Student’s t-test
Fig. 7
Fig. 7. The increased glutamine anabolism promoted by GS expression sensitizes NSCLCs to gefitinib by attenuating energy production and GSH generation, leading to cell death.
However, glutamine is utilized when GS is not expressed or when GS expression does not change; thus, glutamate is converted to energy and GSH to protect cells from gefitinib-induced cell stress. The GS and glutamine levels are increased in gefitinib-sensitive cells in response to the gefitinib treatment, leading to decreased GSH and ATP levels. The glutamine level is reduced in gefitinib-resistant cells, and the utilized glutamine efficiently scavenges the accumulated ROS. Taken together, the combination of gefitinib with an inhibitor of glutamine utilization, such as an inhibitor of GLS activity, is a rational therapeutic strategy to overcome gefitinib resistance in patients with NSCLC

References

    1. Paez JG, et al. EGFR mutations in lung cancer: correlation with clinical response to gefitinib therapy. Science. 2004;304:1497–1501. doi: 10.1126/science.1099314. - DOI - PubMed
    1. Kim HR, et al. Clinical characteristics of non-small cell lung cancer patients who experienced acquired resistance during gefitinib treatment. Lung Cancer. 2014;83:252–258. doi: 10.1016/j.lungcan.2013.11.008. - DOI - PubMed
    1. Baykara O, et al. Association of epidermal growth factor receptor and K-Ras mutations with smoking history in non-small cell lung cancer patients. Exp. Ther. Med. 2013;5:495–498. doi: 10.3892/etm.2012.829. - DOI - PMC - PubMed
    1. Lee DS, et al. The implications of human metabolic network topology for disease comorbidity. Proc. Natl Acad. Sci. USA. 2008;105:9880–9885. doi: 10.1073/pnas.0802208105. - DOI - PMC - PubMed
    1. Merz A. Use of NMR-based metabolomics in detecting drug resistance in cancer. Biomark. Med. 2009;3:289–306. doi: 10.2217/bmm.09.15. - DOI - PMC - PubMed