

Adaptive metabolic pattern biomarker for disease monitoring and staging of lung cancer with liquid biopsy
- PMID: 30109276
- PMCID: PMC6082903
- DOI: 10.1038/s41698-018-0059-9
Adaptive metabolic pattern biomarker for disease monitoring and staging of lung cancer with liquid biopsy
Abstract
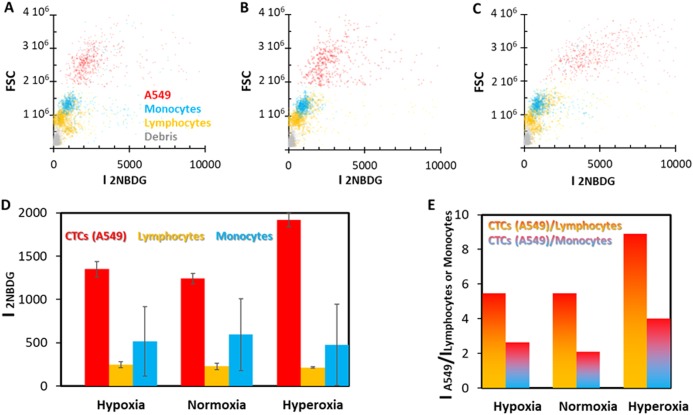
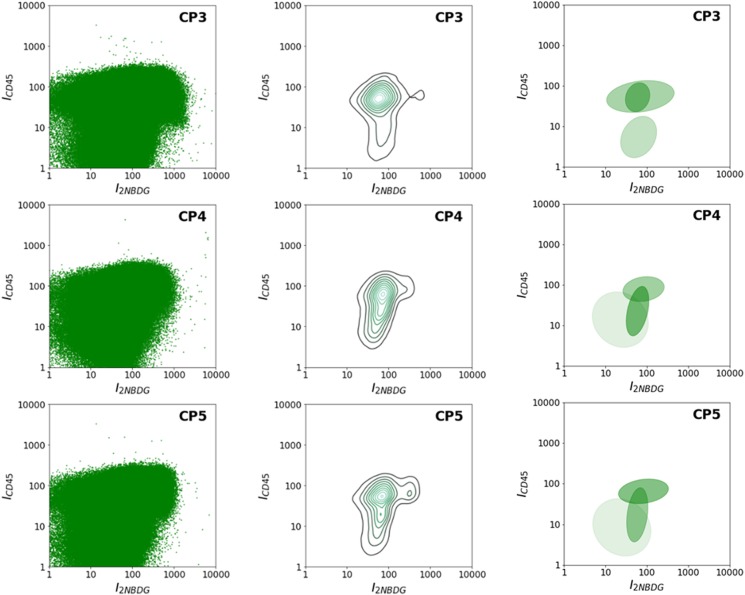
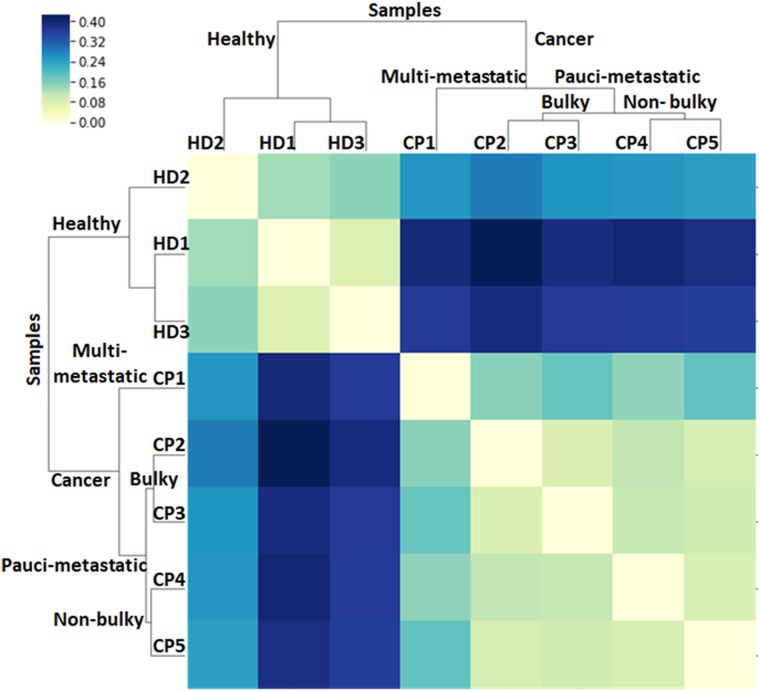
In this manuscript, we demonstrate the applicability of a metabolic liquid biopsy for the monitoring and staging of patients with lung cancer. This method provides an unbiased detection strategy to establish a more precise correlation between CTC quantification and the actual burden of disease, therefore improving the accuracy of staging based on current imaging techniques. Also, by applying statistical analysis techniques and probabilistic models to the metabolic status and distribution of peripheral blood mononuclear cell (PBMC) populations "perturbed" by the presence of CTCs, a new category of adaptive metabolic pattern biomarker (AMPB) is described and unambiguously correlated to the different clinical stages of the patients. In fact, this strategy allows for classification of different categories of disease within a single stage (stage IV) before computed tomography (CT) and positron emission tomography (PET) scans and with lower uncertainty.
Conflict of interest statement
The authors declare no competing interests.
Figures


Similar articles
-
More advantages in detecting bone and soft tissue metastases from prostate cancer using 18F-PSMA PET/CT.Hell J Nucl Med. 2019 Jan-Apr;22(1):6-9. doi: 10.1967/s002449910952. Epub 2019 Mar 7. Hell J Nucl Med. 2019. PMID: 30843003
-
Association of circulating tumour cells with early relapse and 18F-fluorodeoxyglucose positron emission tomography uptake in resected non-small-cell lung cancers.Eur J Cardiothorac Surg. 2017 Jul 1;52(1):55-62. doi: 10.1093/ejcts/ezx049. Eur J Cardiothorac Surg. 2017. PMID: 28369376
-
Circulating tumor cells and [18F]fluorodeoxyglucose positron emission tomography/computed tomography for outcome prediction in metastatic breast cancer.J Clin Oncol. 2009 Jul 10;27(20):3303-11. doi: 10.1200/JCO.2008.19.4423. Epub 2009 May 18. J Clin Oncol. 2009. PMID: 19451443
-
Comparison of 68Ga-labeled Prostate-specific Membrane Antigen Ligand Positron Emission Tomography/Magnetic Resonance Imaging and Positron Emission Tomography/Computed Tomography for Primary Staging of Prostate Cancer: A Systematic Review and Meta-analysis.Eur Urol Open Sci. 2021 Sep 28;33:61-71. doi: 10.1016/j.euros.2021.09.006. eCollection 2021 Nov. Eur Urol Open Sci. 2021. PMID: 34632423 Free PMC article. Review.
-
68Ga-Labeled Prostate-specific Membrane Antigen Ligand Positron Emission Tomography/Computed Tomography for Prostate Cancer: A Systematic Review and Meta-analysis.Eur Urol Focus. 2018 Sep;4(5):686-693. doi: 10.1016/j.euf.2016.11.002. Epub 2016 Nov 15. Eur Urol Focus. 2018. PMID: 28753806
Cited by
-
Optimization of Tumor Disease Monitoring in Medical Big Data Environment Based on High-Order Simulated Annealing Neural Network Algorithm.Comput Intell Neurosci. 2021 Oct 19;2021:8996673. doi: 10.1155/2021/8996673. eCollection 2021. Comput Intell Neurosci. 2021. Retraction in: Comput Intell Neurosci. 2023 Aug 2;2023:9894742. doi: 10.1155/2023/9894742. PMID: 34712319 Free PMC article. Retracted.
-
Paper-based plasmonic substrates as surface-enhanced Raman scattering spectroscopy platforms for cell culture applications.Mater Today Bio. 2021 Aug 4;11:100125. doi: 10.1016/j.mtbio.2021.100125. eCollection 2021 Jun. Mater Today Bio. 2021. PMID: 34485892 Free PMC article. Review.
-
Surface-Enhanced Raman Spectroscopy in Cancer Diagnosis, Prognosis and Monitoring.Cancers (Basel). 2019 May 29;11(6):748. doi: 10.3390/cancers11060748. Cancers (Basel). 2019. PMID: 31146464 Free PMC article. Review.
-
Present and Future of Surface-Enhanced Raman Scattering.ACS Nano. 2020 Jan 28;14(1):28-117. doi: 10.1021/acsnano.9b04224. Epub 2019 Oct 8. ACS Nano. 2020. PMID: 31478375 Free PMC article.
References
-
- Cancer survival and prevalence in Australia: period estimates from 1982 to 2010. (Australian Institute of Health and Welfare, Canberra; 2012). - PubMed
LinkOut - more resources
Full Text Sources
Other Literature Sources
Molecular Biology Databases
