

Region-by-region analysis of PET, MRI, and histology in en bloc-resected oligodendrogliomas reveals intra-tumoral heterogeneity
- PMID: 30109401
- PMCID: PMC6351509
- DOI: 10.1007/s00259-018-4107-z
Region-by-region analysis of PET, MRI, and histology in en bloc-resected oligodendrogliomas reveals intra-tumoral heterogeneity
Abstract
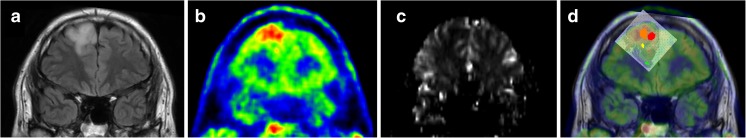
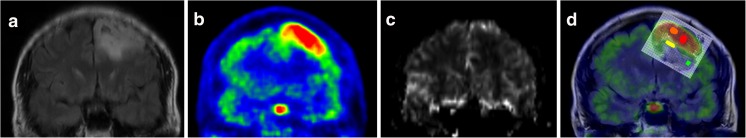
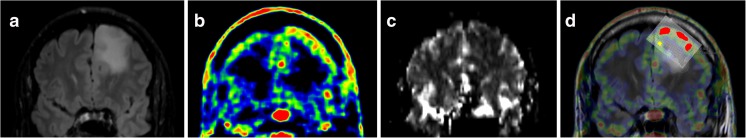
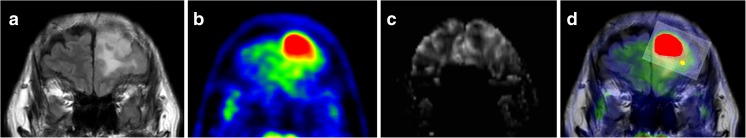
Purpose: Oligodendrogliomas are heterogeneous tumors in terms of imaging appearance, and a deeper understanding of the histopathological tumor characteristics in correlation to imaging parameters is needed. We used PET-to-MRI-to-histology co-registration with the aim of studying intra-tumoral 11C-methionine (MET) uptake in relation to tumor perfusion and the protein expression of histological cell markers in corresponding areas.
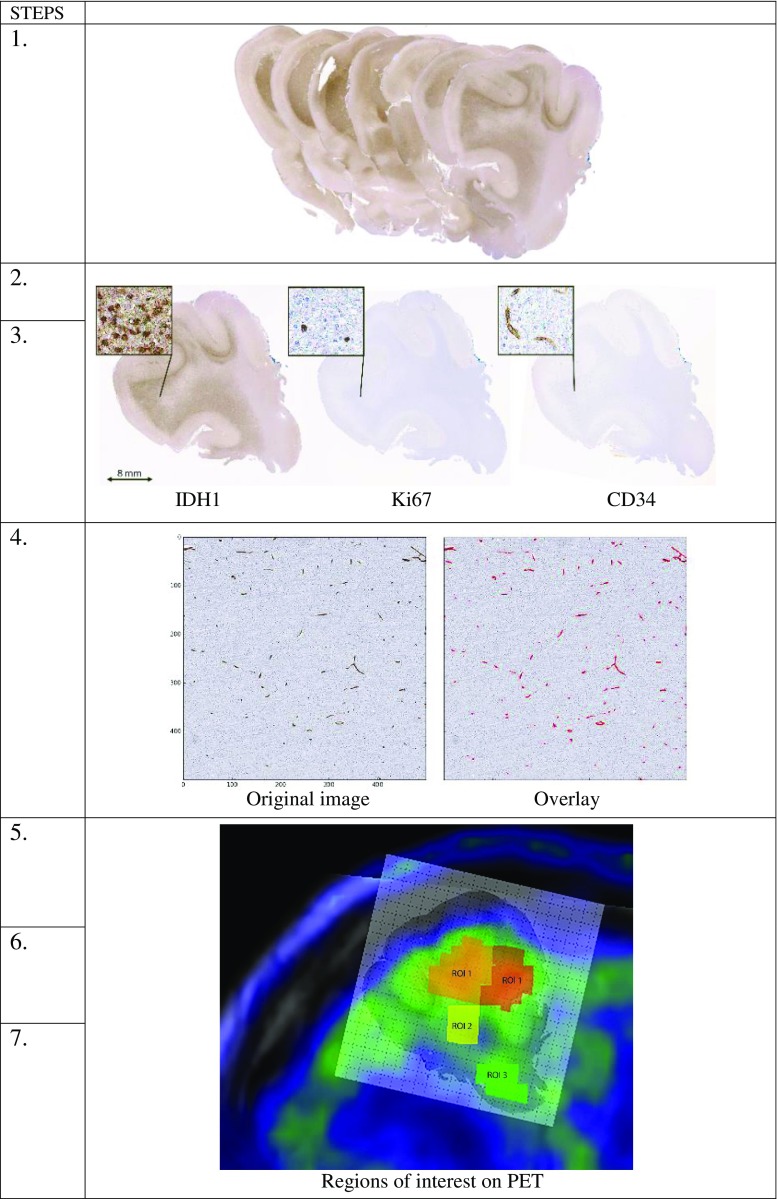
Methods: Consecutive histological sections of four tumors covering the entire en bloc-removed tumor were immunostained with antibodies against IDH1-mutated protein (tumor cells), Ki67 (proliferating cells), and CD34 (blood vessels). Software was developed for anatomical landmarks-based co-registration of subsequent histological images, which were overlaid on corresponding MET PET scans and MRI perfusion maps. Regions of interest (ROIs) on PET were selected throughout the entire tumor volume, covering hot spot areas, areas adjacent to hot spots, and tumor borders with infiltrating zone. Tumor-to-normal tissue (T/N) ratios of MET uptake and mean relative cerebral blood volume (rCBV) were measured in the ROIs and protein expression of histological cell markers was quantified in corresponding regions. Statistical correlations were calculated between MET uptake, rCBV, and quantified protein expression.
Results: A total of 84 ROIs were selected in four oligodendrogliomas. A significant correlation (p < 0.05) between MET uptake and tumor cell density was demonstrated in all tumors separately. In two tumors, MET correlated with the density of proliferating cells and vessel cell density. There were no significant correlations between MET uptake and rCBV, and between rCBV and histological cell markers.
Conclusions: The MET uptake in hot spots, outside hotspots, and in infiltrating tumor edges unanimously reflects tumor cell density. The correlation between MET uptake and vessel density and density of proliferating cells is less stringent in infiltrating tumor edges and is probably more susceptible to artifacts caused by larger blood vessels surrounding the tumor. Although based on a limited number of samples, this study provides histological proof for MET as an indicator of tumor cell density and for the lack of statistically significant correlations between rCBV and histological cell markers in oligodendrogliomas.
Keywords: 11C-methionine PET; Co-registration; Perfusion MR; Proliferation; Vascularization.
Conflict of interest statement
Conflict of interest
None.
Ethical approval
All procedures performed in studies involving human participants were in accordance with the ethical standards of the institutional and/or national research committee and with the principles of the 1964 Declaration of Helsinki and its later amendments or comparable ethical standards.
Informed consent
Informed written consent was obtained from all individual participants included in the study.
Figures
Similar articles
-
Perfusion and diffusion MRI combined with ¹¹C-methionine PET in the preoperative evaluation of suspected adult low-grade gliomas.J Neurooncol. 2013 Sep;114(2):241-9. doi: 10.1007/s11060-013-1178-3. Epub 2013 Jun 16. J Neurooncol. 2013. PMID: 23771511 Free PMC article.
-
Surgical target selection in cerebral glioma surgery: linking methionine (MET) PET image fusion and neuronavigation.Minim Invasive Neurosurg. 2007 Oct;50(5):273-80. doi: 10.1055/s-2007-991143. Minim Invasive Neurosurg. 2007. PMID: 18058643
-
Discrimination between low-grade oligodendrogliomas and diffuse astrocytoma with the aid of 11C-methionine positron emission tomography.J Neurosurg. 2011 Jun;114(6):1640-7. doi: 10.3171/2010.11.JNS10553. Epub 2011 Jan 7. J Neurosurg. 2011. PMID: 21214332
-
Comparison of 18F-FET PET and perfusion-weighted MR imaging: a PET/MR imaging hybrid study in patients with brain tumors.J Nucl Med. 2014 Apr;55(4):540-5. doi: 10.2967/jnumed.113.129007. Epub 2014 Feb 27. J Nucl Med. 2014. PMID: 24578243
-
Metabolic mapping of gliomas using hybrid MR-PET imaging: feasibility of the method and spatial distribution of metabolic changes.Invest Radiol. 2013 May;48(5):295-301. doi: 10.1097/RLI.0b013e31827188d6. Invest Radiol. 2013. PMID: 23296081
Cited by
-
Individualized discrimination of tumor progression from treatment-related changes in different types of adult-type diffuse gliomas using [11C]methionine PET.J Neurooncol. 2023 Dec;165(3):547-559. doi: 10.1007/s11060-023-04529-7. Epub 2023 Dec 14. J Neurooncol. 2023. PMID: 38095773
-
Combined Amino Acid Positron Emission Tomography and Advanced Magnetic Resonance Imaging in Glioma Patients.Cancers (Basel). 2019 Jan 29;11(2):153. doi: 10.3390/cancers11020153. Cancers (Basel). 2019. PMID: 30699942 Free PMC article. Review.
-
Hybrid PET/MRI in Cerebral Glioma: Current Status and Perspectives.Cancers (Basel). 2023 Jul 12;15(14):3577. doi: 10.3390/cancers15143577. Cancers (Basel). 2023. PMID: 37509252 Free PMC article. Review.
-
Glioma Biopsy Based on Hybrid Dual Time-Point FET-PET/MRI-A Proof of Concept Study.Front Neurol. 2021 May 11;12:634609. doi: 10.3389/fneur.2021.634609. eCollection 2021. Front Neurol. 2021. PMID: 34046002 Free PMC article.
-
Physiological MRI of microvascular architecture, neovascularization activity, and oxygen metabolism facilitate early recurrence detection in patients with IDH-mutant WHO grade 3 glioma.Neuroradiology. 2022 Feb;64(2):265-277. doi: 10.1007/s00234-021-02740-9. Epub 2021 Jun 11. Neuroradiology. 2022. PMID: 34115146 Free PMC article.
References
-
- Weller M, van den Bent M, Tonn JC, Stupp R, Preusser M, Cohen-Jonathan-Moyal E, et al. European Association for Neuro-Oncology (EANO) guideline on the diagnosis and treatment of adult astrocytic and oligodendroglial gliomas. Lancet Oncol. 2017;18:e315–ee29. doi: 10.1016/S1470-2045(17)30194-8. - DOI - PubMed
Publication types
MeSH terms
LinkOut - more resources
Full Text Sources
Other Literature Sources
Medical
Research Materials
Miscellaneous
